P-ISSN: 2087-1228 E-ISSN: 2476-9053 Binus Business Review, 7(3), November 2016, 261-268
DOI: 10.21512/bbr.v7i3.1637
THE MODERATING EFFECT OF ENVIRONMENTAL
DYNAMISM ON MANAGERIAL OWNERSHIP, RISK,
AND PERFORMANCE
Levana Dhia Prawati
1; Martinus Hanung Setyawan
21Accounting and Finance Department, Faculty of Economic and Communication, Bina Nusantara University
Jln. K.H. Syahdan No 9, Jakarta Barat, DKI Jakarta, 11480, Indonesia
2Ministry of Finance of Republic Indonesia, Gedung Prijadi Praptosuhardjo 3 Lt. 3,
Jln. Dr. Wahidin II No 3, Jakarta Pusat, DKI Jakarta, 10710, Indonesia
1[email protected]; 2[email protected]
Received: 30th August 2016/ Revised: 16th November 2016/ Accepted: 26th November 2016
How to Cite: Prawati, L. D., & Setyawan, M. N. (2016).The Moderating Effect of Environmental Dynamism on Managerial Ownership, Risk, and Performance. Binus Business Review, 7(3), 261-268.
http://dx.doi.org/10.21512/bbr.v7i3.1637
ABSTRACT
The goal of this research was to examine the effect of managerial ownership and risk toward company performance with company environment as the moderating variables and the firm-size as the control variable. The hierarchical cluster analysis was used to acquire two group samples of prospector and defender company. The result of multiple regression analysis shows that company environment moderates the risk and the managerial ownership toward the performance. Polynomial regression analysis method was conducted to test the effect of managerial ownership and risk toward the performance in the company with the type of prospector and defender. The result shows that in the prospector company, managerial ownership statistically does not give significant influence to company performance, and in the second degree, managerial ownership does not affect the company performance. This research also proves that managerial ownership negatively affects company performance in the defender company, although this influence gradually changes into the positive influence. This research reveals that risk gives positive influence to company performance in the defender company. Moreover, this influence gradually changes into negative influence. On the other hand, the risk gives negative influence to the performance of prospector company, and it gradually changes into the positive influence.
Keywords: environmental dynamism, managerial ownership, risk, performance, defender companies, prospector companies
INTRODUCTION
In general, the goal of owner and company management is performance achievement which is measured by company profitability. In addition, the purpose of performance achievement is the prosperity level which can be accepted by every party. According to the agency theory, there is a separated function between the owner (principal) and the manager (agent). The result of this separation raises conflict of interest for each party trying to change the acquisition or acquired company welfare for themselves thus the achievement of the company related to the main goal cannot be optimal. The previous study proved that
there were several mechanisms to reduce the agency problems, one of which is the managerial ownership mechanism and debt policy (Agrawal & Knoeber, 1996).
entire company activities can be monitored through a great managerial ownership.
Jensen and Meckling (1976) stated that the increase in managerial ownership could be used as a way to reduce agency conflict. It is because it can align the interests of management with external shareholders thus the company goal can be achieved. Previous research by Short and Keasey (1999) concluded that ownership by directors significantly gave an effect to company performance positively. Demsetz and Villalonga (2001) in Jahmani and Ansari (2006) explained that company performance always depends on the ownership structure. The other experts, Shleifer and Vishny (1986) argued that the parties which had a large proportion of share ownership had the capability to monitor and control the activities of managerial companies. In addition, it was expected to improve company performance.
Mehran (1992) conducted research to examine the relationship between the capital structure with executive incentive plans, managerial equity investment, and monitoring by the board of directors, and its largest shareholder. The research revealed that the company was largely owned by manager tending to have a high leverage ratio or investing using high debt. According to the theory of capital structure this company indicates the high value or good performance. In the research claimed that the increase of managerial ownership give positive influence to the company value that it could create an effective activity. Thus it could maximize the company’s decision. There was also research that stated managerial ownership had a positive impact on the corporate value. On the other hand, Siallagan and Machfoedz (2006) stated that managerial ownership negatively affected the value of the company as measured by Tobin’s Q.
Chilin and Liao (2007) provided inconsistent research result. They said that there was no relationship between managerial ownership and company value. They explained that managerial ownership did not directly affect company value. Juhandi et al. (2013) supported him that managerial ownership had no effect on the dividend policy and the value of manufacturing companies in Indonesia Stock Exchange. Jahmani and Ansari (2006) had examined the mechanism of managerial ownership, risk-taking and corporate performance. Their research was concluded that there was no significant relationship between variables in the entire sample which were companies in the United States. Another study by Hastuti (2005) also found that there was no relationship between corporate ownership and corporate performance.
The funding policy has to be a major concern in management to finance a worthy investment to achieve maximum performance. Funding through debt or capital markets will result in the cost of funds. Thus, it is required to have the careful consideration to decide what types of funding that will be used. It is because the policy will directly impact the corporate goal. Based on the agency theory, the concept of labor relationship to solve the conflict between owners and
managers is called debt creation (Jensen, 1989). Debt is seen as the symbol of company management which is used to enhance the efficiency and effectiveness to generate cash flow in the future. On the other hand, debt can also be seen as equipment which controls opportunistic behavior that reduces cash flow for spending discretionary. However, debt increase at some point showing accretion risks that will be undergone by the company. Agrawal and Knoeber (1996) conducted a study to examine a mechanism that control agency problems to improve company performance. The research proved that debt policy was significantly related to company’s performance. Taswan (2003) conducted a test to probe the effect of insider ownership, debt policy and dividend toward company value and some others influential factors. The finding showed that debt policy had the positive effect on firm value. Same line with them, HT and Miftahurrohman (2014) conducted a test used structural equation modeling toward companies which were listed on the Stock Exchange Company. Their result revealed that the debt policy had the positive effect on firm value.
However, Soliha and Taswan (2002), and Sofyaningsih and Hardiningsih (2011) had the different view regarding the previous study. Their research explained that debt policy had no significant effect on company value.
Research about the impact of risk and managerial ownership oncompany performance still show different and inconclusive results. It has been the questionable debate that there must be another factor that moderates the effect of managerial ownership and risk on company performance. Syafruddin (2006) concluded that ownership was not the only factor which influenced the performance. The other factors could be uncertain environmental conditions and ownership by internal parties. Another finding by Simerly and Li (2000) said that funding decisions gave impact on company performance achievement. However, it can be said that funding decisions have to consider environmental dynamism. There are some different result between companies which have certain and uncertain environmental in using debt or equity market. This statement is supported by Setyawan (2006).
to achieve company performance (Williamson, 1996). Miles and Snow (1978) described four types of strategy to face the environment. They were the defender, analyzer, prospector, and the reactor. Different typology is based on the stability of the demand for goods and services, quantity and pressure of competitor, and technological innovation, and predictable development of new products. Another expert like Veliyath et al., (1994) conducted research by dividing the company into three groups to show instability level of the environment which is dealt with the company. The groups were the prospector, defender, and analyzer company. The theoretical framework that will be shown in Figure 1 investigates the moderate impact of environmental dynamism, ownership and risk on company performance. The researchers use size as the control variable in the regression model.
Figure 1 Theoretical Framework (Source: Authors)
The problem formulations of this research are whether the different environment moderates the managerial ownership and risk level to company performance and whether in the different environment, managerial ownership and risk give different impact to company performance.
METHODS
This research uses purposive sampling method. The samples are manufacturing companies which are listed in Indonesia Stock Exchange (BEI) in 2013-2014. These companies have information about managerial ownership and data of financial calculation ratios.
The hypotheses of this research are:
H1: Company environment moderates the effect of managerial ownership toward company performance.
H2: Company environment moderates the effect of risk toward company performance.
H3: In an unstable environment (prospector), managerial ownership has the positive influence toward company performance, and the influence gradually changes to negative influence.
H4: In the stable environment (defender), managerial ownership has the negative influence on company performance, and the influence gradually changes into the positive influence.
H5: In stable environments (defender), the risk level has the positive influence on company performance, and the influence gradually changes to negative influence.
H6: In an unstable environment (Prospector), the risk level has negative influence to company performance, and the influence gradually changes to positive influence.
The first and second hypotheses in this research were tested using Multiple Regression Analysis (MRA) with pooled data. The equation is as following:
(1)
The description is:
ROI = Return on Investment
MO = Managerial Ownership
DER = Debt to Equity Ratio
FIRMSIZE = the natural logarithm of total assets of the company
LINGK = the company environment in
the form of dummy variables. Dummy 0 for prospector companies, and a dummy one for defender companies.
LINGK*MO = the interaction between the environment and managerial ownership.
LINGK*DER = the interaction between the environment and risk.
ε = the error of the regression
equation.
To test the effect of ownership and risk on company performance on both level of environment, the researchers use polynomial regression analysis. This analysis is used to estimate the effect of independent variables on the dependent variable whether it runs into different directions. The regression equation for both defender company and prospector company are as following:
Information:
ROI = Return on Investment MO = Managerial Ownership
MO2 = The second degree variable of
managerial ownership which indicates the polynomial function
ε = the error of the regression equation and
(3)
Information:
ROI = Return on Investment DER = Debt to Equity Ratio
DER2 = The second degree of DER which indicates the polynomial function
ε = the error of the regression equation
Managerial ownership is obtained from the percentage of company ownership by the manager (Jahmani and Ansari, 2006; Short and Keasey, 1999; Fuad, 2005) while the risk is defined as Debt to Equity Ratio (Jahmani and Ansari, 2006; Simerly and Li, 2000; and Setyawan, 2006).
Performance is measured by Return on Investment (Simerly and Li, 2006). According to Jahmani and Ansari (2006), company performance can be measured by two ways. There are accounting measure and market-based indicators. This research uses the accounting measurement because it shows the true state of a company, while the market indicator only shows the expecting state.
The moderating variable in this research is the corporate environment. This variable is measured by using ratios to describe the environment which is dealt by company (Veliyath et al., 1994). With these ratios, researchers have divided the companies into some groups using hierarchical cluster analysis–method linkage within groups. There are three ratios used. First, total assets ratio measures the efficiency of asset usage by the company. Prospector company tends to have the lowest ratios and defender company has the higher ratio. Second, it is cost of public administration and sales/total sales. This ratio measures the efficiency of costs incurred by the company to create, develop, and introduce the products. Prospector company will have the highest ratio while defender company will have the lowest ratio. Last, general administration costs and sales/ total assets also measure the efficiency of costs incurred by the company in use of company assets. Prospector company will have the highest ratio while defender company will have the lowest ratio.
The previous research conducted by Smith, Guthrie and Chen (1989) in Setyawan (2006) proved that the size of the company affected the strategic relationship and economic performance. Different
types of company size could cause different influence on the regression model. The company size variable is calculated from the natural log of total assets.
RESULTS AND DISCUSSIONS
The samples were obtained from 38 companies with 76 observations. After the researchers analyzed these samples using hierarchical cluster analysis - within groups linkage method. The results show there are 33 observations in the unstable environment (Prospector) and 43 observations in stable environments (defender). Observations in these two groups defines that the prospector companies focus on pharmaceutical, cosmetics and house hold, and industrial machinery and heavy equipment. Meanwhile, the groups of defender companies are in textile and garment, consumer goods, ceramics, porcelain and glass, and electronics. The researchers also find out that some companies are included in both prospector and defender company. There are food and beverage, automotive and components, house hold appliances, cigarettes, chemicals, metals, plastics and packaging, and pulp and paper.
After the researchers have analyzed the 76 companies as ROI variable using descriptive statistical analysis, it shows that the mean is 6,422267, and the standard deviation is 6,6002649. The result is in the range of 0,06 to 43,88. Variable DER with the mean (0,1983) and the standard deviation (0,95206) has the range of -3,22to 2,08. Variable MO with the mean (7,593564) and the standard deviation (13,70298) has the range of 0,01 to 73,93. Variable FIRMSIZE with the mean (27,9579) and the standard deviation (1,75354) has the range of 25,30 to 33,12. Variable LINGK*MO with the mean (4,5586) and the standard deviation (12,68811) has the range of 0 to 73,93. Variable LINGK*DER with the mean (-0,0546) and the standard deviation (0,843507) has the range of -3,22 to 2,08. These results of Descriptive Statistical Analysis are described in Table 1.
Then, the researchers use Kolmogorov- Smirnov Z value to conduct the normality test. The result of Asymp. Sig. (2-tailed) shows 0,311 is above the alpha value (0,05). Thus, it can be concluded that the all tested data variable are normally distributed. Table 2 shows the results of this test.
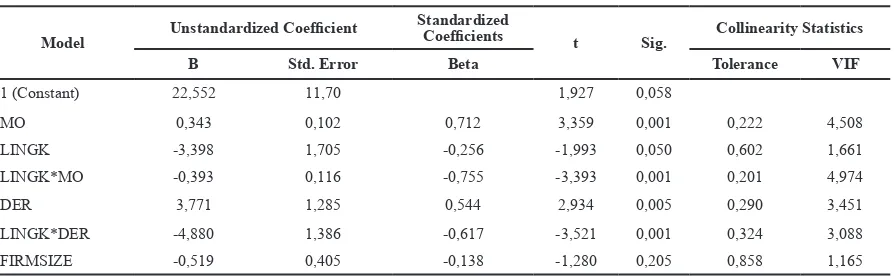
The value of Variance Inflation Factor (VIF) on regression model is used to test the presence of multicollinearity. The result can be seen in Table 3. It shows that all the VIF variables are under ten which means there is no existence of multicollinearity (Gujarati and Porter, 2012).
Table 1 Descriptive Statistics Test Results
N Minimum Maximum Mean Std Deviation
MO 76 0,0100 73,9300 7,59356 13,702982
ROI 76 0,0600 43,8800 6,42226 6,6002649
LINGK 76 0 1 0,57 0,498
FIRMSIZE 76 25,30 33,12 27,9579 1,75354
LINGK*MO 76 0,00 73,93 4,5586 12,68811
DER 76 -3,22 2,08 -0,1983 0,95206
LINGK*DER 76 -3,22 2,08 -0,0546 0,83507
Valid N (listwise) 76
Table 2 Normality Test Results
One-Sample Kolmogorov-Smirnov Test Unstandardized
Residual
N 76
Normal Parameters a.b Mean 0,0000000
Std. Deviation
5,43209073
Most Extreme Absolute 0,111
Differences Positive 0,111
Negative -0,103
Kolmogorov-Smirnov Z 0,964
Asymp. Sig. (2-tailed) 0,311
a. Test Distribution is Normal
b. Calculated from data
Table 3 Multicollinearity Test Result
Coefficientsa
Model Unstandardized Coefficient
Standardized
Coefficients t Sig. Collinearity Statistics
B Std. Error Beta Tolerance VIF
1 (Constant) 22,552 11,70 1,927 0,058
MO 0,343 0,102 0,712 3,359 0,001 0,222 4,508
LINGK -3,398 1,705 -0,256 -1,993 0,050 0,602 1,661
LINGK*MO -0,393 0,116 -0,755 -3,393 0,001 0,201 4,974
DER 3,771 1,285 0,544 2,934 0,005 0,290 3,451
LINGK*DER -4,880 1,386 -0,617 -3,521 0,001 0,324 3,088
FIRMSIZE -0,519 0,405 -0,138 -1,280 0,205 0,858 1,165
a. Dependent Variable: ROI
Table 4 Autocorrelation Test Result
Model Summaryb
Model R R Square Adjusted R Square Std. Error of the Estimate Durbin-Watson
0,568a 0,323 0,263 5,6666765 1,992
a. Predictors: (Constant), FIRMSIZE, LINGK, MO, LINGK*DER, DER, LINGK*MO
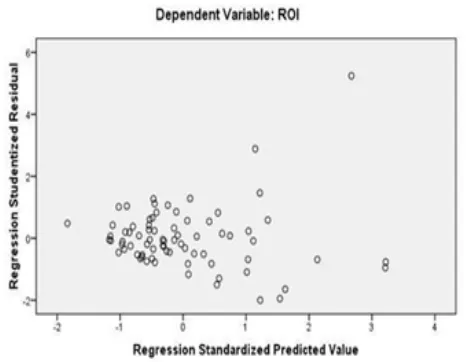
Heteroscedasticity test is done by looking at the scatterplot graph. The Scatterplot graph shows the sample data spreads randomly in both above and below of the number 0 on the Y axis and does not form a specific pattern. It can be concluded in this research that there is no heteroscedasticity in the regression model as shown in Figure 2.
Figure 2 Result of the Scatterplot Test
Next, it is the Multiple Regression Analysis (MRA) to test the first and second hypothesis. Table 5 illustrates the result.
Table 5 Multiple Regression Analysis Result
Model Summaryb
Model R R Square Adjusted R Square Std. Error of
the Estimate
1 0,568a 0,323 0,263 5,6666765
a. Predictors: (Constant), FIRMSIZE, LINGK, MO, LINGK*DER, DER, LINGK*MO
b. Dependent Variable: ROI
Coefficientsa
Model
Unstandardized
Coefficient Standardized Coefficients
t Sig.
B ErrorStd. Beta
1 (Constant) 22,552 11,70 1,927 0,058
MO 0,343 0,102 0,712 3,359 *0,001
LINGK -3,398 1,705 -0,256 -1,993 ***0,050
LINGK*MO -0,393 0,116 -0,755 -3,393 *0,001
DER 3,771 1,285 0,544 2,934 *0,005
LINGK*DER -4,880 1,386 -0,617 -3,521 *0,001
FIRMSIZE -0,519 0,405 -0,138 -1,280 0,205
a. Dependent Variable: ROI
**Significant at α1% **Significant at α5% *** Significant at α10%
The result of Multiple Regression Analysis (MRA) in Table 5 indicates that the variable MO has a significant positive influence on ROI that the 1%, 5%, and 10% of alpha. The DER variable also influences ROI positively at 1%, 5% and 10% of alpha. Meanwhile, the FIRMSIZE variable does not have the significant influence on ROI. The LINGK variable has the significant influence on ROI at 10% of alpha.
The LINGK*MO variable influences the ROI at 5% and 10% of alpha. It means that ENVIRONMENTAL significantly moderates the influence of MO to ROI. The first hypothesis is proven to be true. It means that the size of managerial ownership affects the company performance with variations in the specific influence indicated by the influence of circumstances and conditions of company environment.
The LINGK*DER variable has statistically influence on ROI at 1%, 5% and 10% of alpha. It’s mean that ENVIRONMENTAL statistically moderates the influence of DER to ROI. The second hypothesis is statistically proven. It means that critical decision such as funding decision, and the environment is the essential factor that requires being considered by the company. Thus the decision can improve the performance.
Polynomial regression analysis is used to test the third to sixth hypothesis. The result is in Table 6.
Table 6 The Result of Polynomial Regression Analysis on Prospector Company
Model Summaryb
Model R R Square Adjusted R
Square
Std. Error of the Estimate
1 0,402a 0,162 0,104 8,0823489
a. Predictors: (Constant), MO2, MO
Coefficientsa
Model
Unstandardized
Coefficient Standardized Coefficients
t Sig.
B ErrorStd. Beta
1 (Constant) 6,874 1,889 3,639 0,001
MO -0,024 0,464 -0,029 -0,053 0,958
MO2 0,013 0,017 0,430 0,787 0,438
b. Dependent Varia **Significant at α1% **Significant at α5% *** Significant at α10%
is statistically proven. In defender company, the lower amount of stock which is belonged to the manager will enhance the company performance, but this condition decreasingly moves to the opposite direction like declining performance. It is because the boards of directors who are the owner of defender company have wide chance to improve in managing and making the investment decision without personal interest.
Table 8 The Result of Polynomial Regression Analysis on Defender Company
Model Summaryb
Model R R Square Adjusted
R Square
Std. Error of the Estimate
1 0,948a 0,898 0,893 0,5507740
a. Predictors: (Constant), DER2, DER
The value of R Square on Table 8 shows that the 89.8% of ROI can be analyzed by the predictor variables, DER and DER2. While, 10,2% of the remaining valueis influenced by other factors. In the defender companies, it shows that the DER has influenced the ROI positively at 1%, 5% and 10% of alpha. The DER2 variable has statistically negative influence on ROI at 1%, 5% and 10% of alpha. Thus, the fifth hyphotesis is statistically proven. The use of funding through debt in defender company is more efficient to improve company performance. It means that monitoring and controlling manager decisions by debt holder have proven to be effective. Defender company tends to be easily predicted, consistent with sales, costs and have easily assessed sales trends. It creates an effective monitoring by debt holder to achieve maximum performance. On the other hand, funding through debt does not always produce the good performance. If the funding is just through debt and increases the debt continuously, the performance will decline. This condition indicates that the company has financial difficulties or aggressive investments, and ignore performance.
Table 9 The Result of Polynomial Regression Analysis on Prospector Company
Model Summaryb
Model R R Square Adjusted
R Square
Std. Error of the Estimate
1 0,629a 0,395 0,354 6,8649512
a. Predictors: (Constant), DER2, DER
Coefficientsa
Model
Unstandardized
Coefficient Standardized Coefficients t Sig.
B Std. Error Beta
1 (Constant) 18,458 2,580 7,153 0,000
DER2 -35,183 8,775 -1,740 -4,009 *0,000
DER 20,729 6,447 1,395 3,215 *0,003
b. Dependent Variable: ROI
The value of R Square on Table 9 shows that only 39,5% of ROI can be seen by the predictor variables, DER and DER2. While the remaining value which is 60,5% is influenced by other factors. In the prospector companies, DER has the negative influence on ROI at 1%, 5% and 10% of alpha. While the DER2 variable influence the ROI positively at 1%, 5% and 10% of alpha. The sixth hypothesis is statistically proven. The use of high-level debt in prospector company will causes strict monitoring by the debt holder, so the funding through the capital markets will increase company performance. However, this research also finds out that prospector company does not always use capital markets for funding to improve the performance. The evidence indicates that at some point company will need quick funding through debt that can increase the performance.
CONCLUSIONS
This research finds out that the environmental dynamism moderates the effect of managerial ownership and risk toward company performance. The firm size does not affect the company performance in the regression model. The level of managerial ownership and the second-degree have no significant impact on the company performance in prospector company. While in defender company, the level of managerial ownership has the negative impact on the company performance but the impact gradually moves to positive impact.
The another finding is that risk has the positive impact on company performance but the impact gradually moves to the negative impact in defender company. Moreover, in prospector company, risk impact the company performance negatively but the impact gradually moves to the positive area. The further researches related to these issues may consider the confounding effect of industry and the using of another environmental dynamism proxy.
REFERENCES
Agrawal, A., & Knoeber, C. R. (1996). Firm performance and mechanisms to control agency problems between managers and shareholders. The Journal of Financial and Quantitative Analysis, 31(3), 377– 797. http://doi.org/10.2307/2331397
Astuti, A. D., Rahman, A., & Sudarno, S. (2015). Pengaruh kepemilikan keluarga terhadap kinerja perusahaan dengan agency cost sebagai variabel moderating. Jurnal Dinamika Akuntansi, 7(2), 98–108.
Chilin, & Liao, G. M. (2007). Ownership structure, information disclosure and corporate value: An empirical analysis of Taiwan companies. In
Proceedings of the 13 Asia Pacific Management
Conference, Melbourne, Australia, 698–704.
Fuad. (2005). Simultanitas dan “trade off” pengambilan
keputusan finansial dalam mengurangi konflik
Nasional Akuntansi, 8, 262–276.
Gujarati, D.N., & Porter, D.C. (2012). Basic Econometrics (5th ed). New York: McGraw-Hill.
Hastuti, T. D. (2005). Hubungan antara good corporate governance dan struktur kepemilikan dengan kinerja keuangan. Simposium Nasional Akuntansi, 8, 238– 247.
HT, H. A., & Miftahurrohman. (2014). Pengaruh struktur kepemilikan saham, kebijakan deviden dan kebijakan hutang terhadap nilai perusahaan (studi pada perusahaan yang terdaftar di BEI). Jurnal Etikonomi, 13(2), 148–163.
Jahmani, Y., & Ansari, M. (2006). Managerial ownership, risk, and corporate performance. International Journal of
Commerce and Management, 16(3&4), 212–221.
http://doi.org/10.1108/10569210680000218
Jensen, M. C. (1989). Eclipse of the public corporation. Harvard Business Review, 67(5), 61–74.
Jensen, M. C., & Meckling, W. H. (1976). Theory of the firm:
Managerial behavior, agency costs and ownership structure. Journal of Financial Economic, 3(4), 305– 360. http://doi.org/10.2139/ssrn.94043
Juhandi, N., Sudarma, M., & Aisjah, S. (2013). The effects of internal factors and stock ownership structure on
dividend policy on company’s value [A study on
manufacturing companies listed on the Indonesia Stock Exchange (IDX)]. International Journal of
Business and Management Invention, 2(11), 6–18.
Mehran, H. (1992). Executive incentive plans, corporate control, and capital structure. The Journal of
Financial and Quantitative Analysis, 27(4), 539– 560. http://doi.org/10.2307/2331139
Miles, R. E., & Snow, C.C. (1978). Organizational strategy, structure and process. New York: Mc Graw Hills. Setyawan, M. H. (2006). Pengaruh leverage terhadap
kinerja dengan lingkungan sebagai variabel
pemoderasi (Master thesis). Surakarta: Universitas Sebelas Maret.
Shleifer, A., & Vishny, R. W. (1986). Large shareholders and corporate control. Journal of Political Economy, 94(3), 461–488. http://doi.org/10.1086/261385 Short, H., & Keasey, K. (1999). Managerial ownership and
the performance of firms: Evidence from the UK.
Journal of Corporate Finance, 5(1), 79–101. http:// doi.org/10.1016/S0929-1199(98)00016-9
Siallagan, H., & Machfoedz, M. (2006). Mekanisme
corporate governance, kualitas laba dan nilai perusahaan. Simposium Nasional Akuntansi, 9, 1–23. Simerly, R. L., & Li, M. (2000). Environmental dynamism,
capital structure, and performance: A theoretical integration and an empirical test. Strategic
Management Journal, 21(1), 31–49.
Sofyaningsih, S., & Hardiningsih, P. (2011). Struktur kepemilikan, kebijakan dividen, kebijakan utang dan nilai perusahaan. Dinamika Keuangan Dan
Perbankan, 3(1), 68–87.
Soliha, E., & Taswan. (2002). Pengaruh kebijakan hutang terhadap nilai perusahaan serta beberapa faktor yang mempengaruhinya. Jurnal Bisnis dan Ekonomi, 9(2), 143–163.
Syafruddin, M. (2006). Pengaruh struktur kepemilikan perusahaan pada kinerja : Faktor ketidakpastian lingkungan sebagai pemoderasi. Jurnal Akuntansi dan Auditing Indonesia, 10(1), 85–99.
Taswan. (2003). Analisis Pengaruh insider ownership, kebijakan hutang dan deviden terhadap nilai perusahaan serta faktor-faktor yang mempengaruhinya. Jurnal Ekonomi dan Bisnis, 10(2), 162–181.
Veliyath, R., Ferris, S. P., & Ramaswamy, K. (1994). Business strategy and top management compensation:
The mediating effects of employment risk, firm performance, and size. Journal of Business Research, 30(2), 149–159. http://doi.org/10.1016/0148-2963(94)90034-5
Williamson, O. E. (1996). Economic organization: The case
for Candor. The Academy of Management Review,