143
The Willingness to Pay Water User Association (
WUA’s
) toward the Water
Resource Conservation
(Study Case in Boro’s Irrigation Area )
Endah Kusumaningrum
1*, Nuddin Harahab
2, Bagyo Yanuwiadi
31Master’s in Natural Resources Management and Development, University of Brawijaya 2 Faculty of Fisheries and Marine Sciences, University of Brawijaya
³ Department of Biology, Faculty of Mathematic and Science, University of Brawijaya
Abstract
The degradation of watershed, especially the damages on the upstream may affect hydrological conditions on the downstream area which is the irrigation system. Through payments for environmental services, the result of the rehabilitation of irrigation can be used by communities on the upstream area for conservation so that the availability of water for farmers downstream are available. The purpose of this study is to analyze the perception of WUA’s to the conservation of water resources, observe the value of Willingness to Pay (WTP) of WUA’s and analyze the factors that
form WUA’s toward the conservation of water resources. The variables of this research were the socioeconomic
variable of WUA’s and their perception of the water resources conservation. The study was conducted at Boro’s Irrigation Area in Purworejo with a total sample of 44 WUA’s in the first planting season in 2016. There are three methods for data analysis in this study, namely (1) descriptive analysis with content analysis to analyze the perception
of the WUA’s to the water resources conservation; (2) Contingent Valuation Method Approach (CVM) to determine the
price of willingness to pay by WUA’s in the water resources conservation; (3) Factor Analysis to analyze the relevant
factors that affect the willingness to pay (WTP) of WUA’s in the water resources conservation. The result of content
analysis show that WUA’s perception about water resources conservation is still need to be raised with education about the importance of water resource conservation. Estimated average WTP of WUA’s in the water resources conservation is IDR 88,438 per year. The total value WTP in Boro area could reach IDR 461.340.000,- Factors that affect their shared WTP simultaneously are age, farming tenure, income, education, land ownership, land coverage and perceptions of the water resources conservation, while the number of family dependents does not significantly affect their WTP are farming experience, knowledge about the condition of the upstream, income, knowledge about the changing quality of irrigation, skills utilization of irrigation, and conservation efforts.
Keyword: Payment for Environmental Services, perception, willingness to pay (WTP), Water User’s Assosiation (WUA’s), water resources conservation
INTRODUCTION
Such a phenomena like global climate change, increasing population and the intensity of economic activities have resulted in an increasing need for water resources very quickly. The utilization of surface water in addition to meeting the needs of irrigation water also has a multidimensional role that meets the needs of the household as drinking water, industries, fisheries and also recreation. Currently the agricultural sector itself uses nearly 80% of total water demand, while the need for industry and households is only 20%. In 2020, it is estimated the demand for households and industry will increase by 25% to 30% [1].
Reallocation of irrigation water for other purposes will negatively impact on the rural
Endah Kusumaningrum Email : [email protected]
Alamat : Agriculture Ministry Jl. Taman Margasatwa No.1 Ragunan, South Jakarta
economy. Damage to forests and land in the upper reaches of the river flow has a negative impact on the local conditions and other downstream (off site) areas connected hydrologically including irrigation systems. The solution of the issue of degradation of water resources depends on the value of humans in the environment that ultimately saw the value will inturn affect the behavior of the human [2]. There is a relationship between the human behavior, including their beliefs, perceptions, attitudes, social concepts and action and decision-making in terms of environmental management [3].
144
WTP P3A dalam Konservasi Sumberdaya Air (Kusumaningrum, et al.)
be integrated with other sectorial policies, namely the forestry sector to manage forests as the hydrological control that maintain the availability of water for irrigation [5].
Such mechanism of payment for
environmental service (PES) to water resources in the watershed system is one of the alternatives that could be applied in conducting and funding conservation of water resources. Through this service returns, the result of the construction of irrigation can be used by communities inhabiting on the upstream area to maintain the availability of irrigation by managing the forest of which will affect the lives of the farmers downstream.
In order to determine the community’s
willingness to pay for environmental services of water resources was conducted a direct survey by Contingent Valuation Method (CVM) method to service users [6], [7], [8]. There was a strong
connection between the community’s willingness
to pay for the improvement of the environment [9].
The purpose of this study was to analyze the perception from WUA’s to the water resources conservation and also analyze the factors that determine their willingness to pay water resources conservatin and the price of retribution of WUA’s are willing to pay for the conservation of water resources.
RESEARCH METHOD
This research is quantitative with qualitative descriptive approach. The study was conducted in the irrigation area of Boro in the first planting season with the data collection was done within February and April 2016. The water irrigation in Boro area has been taken from the Bogowonto watershed, of which approximately 14.98% in critical condition and the other 34.58% area is somewhat critical too [10].
Data collection method was through direct survey by providing questionnaire by involving 44 of 80 WUA’s as the population. The sample was determined through sampling methods of Slovin’s Approach with degree of confidence was 0.1. The samples were also determined with purposive sampling [11]. Respondents include administrators or members who are active in the institutional of WUA’s. Data collection instruments were questionnaire distributed with in-depth interviews.
Therewere three methods for data analysis in this study, namely (1) descriptive analysis with content analysis to analyze the perception of the
WUA’s to the water resources conservation; (2)
Contingent Valuation Method Approach (CVM) to determine the price which meets the willingness to pay by WUA’s in the water resources conservation; (3) Factor Analysis to analyze the relevant factors that affect the willingness to pay (WTP) of WUA’s in the water resources conservation.
CVM Survey was used by using direct questions (open ended questions), namely by providing direct question how much the price offered that could be paid by the respondents in order to to meet the environmental management [12].
The result from perception analysis was analyzed through content analysis to describe the results of the interview so that the results can provide relevant information with the discussion [13]. Factor analysis was used to find the relationship (inter-correlation) of some independent variables so that these variables have certain correlation that can be made as the factors together [14]. Factor analysis was used to measure the dimensions of different data measurements which is widely used to measure different types of environmental values in the study [15]. Factor analysis was processed by using SPSS Software Program.
FINDINGS AND DISCUSSION Description of the Respondents
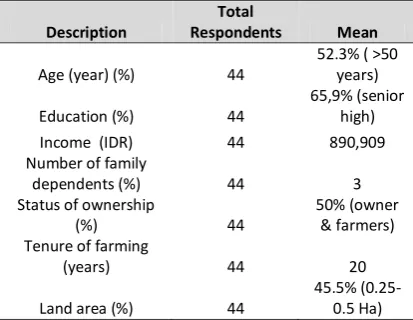
Most of respondents were over 50 years old; this also showed that employments in the agricultural sector in this area are dominated by older age of the community. This age might become individual characteristic that may influence biological and psychological function of the individual. The older farmers will affect their commitment and experience in farming [16]. Highest educational level of the respondent is a high school; it was assumed that most of the farmers are able to read and write (gaining information). The average income of the respondents is quite low in relation to the majority of land coverage for agriculture is only within 0.25 - 0.5 Ha. The proportion of land ownership is equal between the land owners and tenants. Here is a table that can describe the social and economic characteristics of respondents in this study in table 1.
Willingness to Pay (WTP) of WUA’s in the Water Resources Conservation
145 12 respondents were not willing to pay the
conservation program of water resources.
Table 1. Description of the Respondents
Description them considered that conservation program should be the responsibility of the government, while the other half of respondents claimed that they do not have a sufficient budget to pay the retribution and the small portion of the respondents considered the payment of environmental services of water is not an official government program. Estimated average WTP of
WUA’s in the water resources conservation is IDR 88,438 per year. The total value WTP in Boro area could reach IDR 461,340,000. This funding obtained from WUA’s can be used for water resources conservation program and can be used to apply to whole of the watershed management model in Bogowonto area as one integrated cultivation and farming technology. This means the higher of income is the higher their importance of conservation of water resources, such as the importance of efficiency in the utilization of irrigation is by technology and
water-saving rice cultivation system. Besides this, conservation will increase the efficiency in the utilization of irrigation water, the farmers may also increase the farming productivity which in turn will increase their income.
Perception of WUA’s towards Water Resources Conservation
Perception is the process by which individuals would choose, organizing further the interpretation as the stimulus they receive into a meaning [18]. This perception will affect the
individual’s behaviors that will also affect social life and the environment. If the object has a positive perception will affect the perceiver both physically and psychologically so as to motivate positive behavior in the environment [19]. The forests to the water availability was that 81.8% of the respondents have the perception that the influenced by management in the upstream area (the condition of the forest). This shows that the
WUA’s have adequate knowledge about the
function of the forest of which the conditions will affect its function as a regulator of the hydrology system in the ecosystem. The availability of water resources in the downstream area depends on the management and conservation strategies in the upstream area [20].
2. The Condition of Upstream Area
The perceptions of the respondents towards the condition of upstream area in Boro irrigation showed that 59.1% respondents stated that the condition is not good, while the other 9.1%
respondents’ stance was neutral. While only by
146
WTP P3A dalam Konservasi Sumberdaya Air (Kusumaningrum, et al.)
declining soil fertility, biodiversity is reduced, and there is a change of microclimate. The reason is partly because of land use as a water catchment area in the upstream has been converted into productive land or buildings blocking the establishment of infiltration of water naturally. In addition, there have also been illegal logging activities in the protected forest areas.
3. Fluctuation of Water Availability
Fluctuations in the water availability have been perceived by most of the respondents, as much as 88.64% of respondents have claimed that there has been vast decrease of the water availability in the downstream areas for their crops. The other 11.36% respondents, claimed that the decline in water availability has been inattentive.
Fluctuation of water availability happened because of maximum – minimum water discharge and water level. Maximum of water discharge was happened in December and minimum of water discharge was happened in August. It shows that most farmers have perceived that the declined in the water availability has continuously occurred within current 5-10 years.
4. The Quality of Irrigation
Perception from the respondents towards the quality of irrigation reaching to the land varied, where 47.7% of the respondents answered it was not good quality, even the other 6.8% claimed the quality is even very bad, and the other 2.3% was neutral. There was descent number of respondents (31.8% and 11.4%) stated that the quality is very good.
The poor quality of irrigation is known because water contaminated with soil sediments, fertilizers or pesticides, animal waste and household waste. According to most respondents irrigation water quality is not good because polluted by household waste. From observations in the field, there were a lot of pollution in some irrigation channel; this includes household waste dumped into the irrigation so it has high potential for contaminating the quality of irrigation.
5. The Changing Quality of Irrigation
In relation to the changing quality of irrigation, 70.45% of respondents perceived that there has been declining quality of irrigation over time, while the rest of respondents claimed there is no any degraded quality of the irrigation water. Further inquiry from the respondents showed that declining quality of the water has
significantly decreased within the last 5-10 years because of household waste increased. Before that, the quality of the irrigation was very pure from the households that contaminated the water.
6. Water Discharge
As much as 86.36% of respondents have a perception that water discharge entering into the lands is not sufficient for irrigation. Based on the needs of local irrigation water in Boro in the cropping pattern in 2013, the highest water irrigation planting for the first season was in October [21]. Knowledge of this water discharge associated with irrigation water requirements for crops. Most respondents, especially in the tail end area of irrigation have knowledge that the distribution of water is insufficient for the needs of the plant. Irrigation requirement is highest in the first planting season is in October.
At the time of water shortages, especially in downstream areas, farmers usually use machine to pump irrigation water to meet irrigation needs for the crops. The challenge for this technique remains the high cost of fuel to operate the pump. On the other hand, irrigation water should be provided due to the lack of water availability, otherwise, the shortage may reduce agricultural productivity in that area [22], [23], [24], [25]. 7. Utilization of Irrigation
The number of respondents who have a perception of the efficiency in the utilization of irrigation was the same number. Some farmers already understand about the efficiency in the use of irrigation through water-saving irrigation system. However, some others are still using conventional irrigation. Water efficiency in irrigation is to do with the efficiency of storage, distribution and field.
Respondent’s skill in the utilization of
irrigation need to be improved. This also indicates that the farmers should be provided with new information on the ways of efficient utilization of irrigation. Inefficient utilization of water resources for irrigation occurs partly because of the loss during the water flow on average of 47% and loss on the cropping land reaching to 20% -36% [26].
8. Conservation Efforts
147 while the other 34.1% have not conducted any
efforts in the conservation of water resources. It showed that the majority of the farmers were already aware to make an effort in order to conserve water resources. Conservation efforts include reforestation in the area of private lands with perennials, cleaning irrigation channels from grasses and trashes. Conservation efforts undertaken by the government has been also made such as planting trees in the streets, handing out seeds for crops such as sengon
(Albiziachinensis) to farmers. While direct
conservation efforts related to the conservation of water resources has not been optimally executed by the farmers.
Conservation methods carried out with the use of plants or vegetative methods, manipulating the surface of the land and construction of buildings to prevent erosion that called mechanical methods. Vegetative methods can be done by planting vegetation, crop rotation, agroforestry, the use of green manure, planting vegetation waterways with reparian. Mechanical method to do with soil tillage, terracing, and irrigation improvements [26].
Factors Affecting the Willingness to Pay of
WUA’s in the Conservation of Water Resources
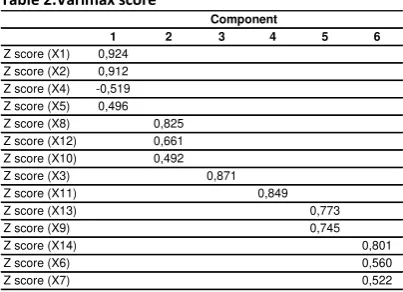
Analysis of the factors that determine willingness to pay WUA’s for the conversation of water resources was conducted through Varimax orthogonal rotation method. Socio-economic variables such as age (X1), tenure (X2), income (X3), education (X4), land ownership status (X5), land coverage (X6), and water users’ perception variable such as the function of upstream area (X7), the condition of upstream area (X8), the fluctuation of water availability (X9), the quality of irrigation (X10), the changing quality of irrigation (X11), water discharge (X12), utilization of irrigation (X13) and conservation effort (X14) were analyzed by factor analysis. According to the results of the analysis, there is one variable that is the number of family that does not affect
the users’ willingness to pay for conservation as
the Varimax score <0.5 which is 0.292. Analysis of the factors generated the value of Kaiser-Meyer-Olkin (KMO) > 0.5 = 0.671 which indicates that the measurements have adequate sample
number. The result of the Barlett’s test with
significance of < 0.05 was 0.000, which indicates that these variables significantly are correlated each other. The result of the rotation of factors indicates that the variables mentioned above
generated six (6) component factors. The following table is the result of varimax score :
Table 2.Varimax score
1 2 3 4 5 6
Z score (X1) 0,924 Z score (X2) 0,912 Z score (X4) -0,519 Z score (X5) 0,496
Z score (X8) 0,825
Z score (X12) 0,661
Z score (X10) 0,492
Z score (X3) 0,871
Z score (X11) 0,849
Z score (X13) 0,773
Z score (X9) 0,745
Z score (X14) 0,801
Z score (X6) 0,560
Z score (X7) 0,522
Component
9
Source: Primary Data, 2016
Variable of age (Zscore = 0.924), farming tenure (Zscore = 0.912), education Zscore = (0,519), and land ownership status(0,496) have a relationship or inter-correlation to affect the
water users’ willingness to pay in the
conservation of water resources so as to form the Factor Component I so the naming of the factors that are considered to represent the four constituent variables is Farming Experience.
According to the description of the respondents, it can be seen that most of the respondents are over 50 years old with sufficient farming experience for 10-20 years. This shows that with increasingly older the age of the farmers, the bigger experience in farming, the bigger understanding especially in water issues. Besides the experience of the respondents, the higher levels of knowledge and perceptions about conservation of water so that their WTP for the conservation of water resources is also
higher. Respondents’ age and experience of
farming grow their awareness of the dependence of farming on water availability and sustainability in the future.
148
WTP P3A dalam Konservasi Sumberdaya Air (Kusumaningrum, et al.)
Factor of two ( F2 ) is formed of a variable factor knowledge of the upstream (0.825) , the discharge of water (0.661) and water quality (0.492), the naming of which represents both constituent variables are factors Knowledge of Upstream Conditions. Those variables have a relationship and the most dominant variable is the perception of conditions in upstream irrigation are forests in the upper watershed . Farmers' perceptions of conditions upstream correlated with the amount of water flow and quality of irrigation water reached the farm land in the form of willingness to pay for conservation of water resources. Where the higher the farmers' knowledge about the conditions in the upstream, the amount of discharge, and the high quality of irrigation water, the higher is also the willingness to pay for conservation. Forming factors that are considered to represent is the farmer's perception of the condition of forests in the upstream at this time.
Conditions upstream forest which is well managed and maintained sustainability, supported by infrastructure and facilities in the center will be able to affect the functions and benefits of watershed general and direct impact on downstream areas, namely for agricultural irrigation [28].
A factor of three ( F3 ) is formed by a variable income. The higher the income of farmers , the Willingness to Pay in the conservation of water resources will be higher. The higher the income the farmers' willingness to pay will be even greater [29]. Willingness to Pay is also defined as the price at the consumer level that reflects the value of the goods or service and sacrifice to obtain it [30].
Factor Four (F4) is formed of variable water quality changes with the loading factor (0,849). From the results of the questionnaire data collection is known that most of the respondents have the perception has been that a decline in water quality compared to 5-10 years ago. Knowledge of respondents about changes in water quality in the study related to the increasing amount of garbage which pollute irrigation channels mainly household waste.
A factor of five ( F5 ) formed by variable skill of utilization of water (0.773) and knowledge of the fluctuations in the availability of water (0.745). With increasing knowledge of fluctuations in the availability of water then it would increase the willingness to pay farmers for the conservation of water resources. Skills regarding water use also correlated with WTP
conservation of water resources where the higher efficiency of water use by farmers it will also increase the willingness to pay for the conservation of water resources . Forming factors representing the five factors are the Water Utilization Efficiency .
Factors six ( F6 ) is a component formed by variable factors skills in conservation (0.801), land area (0.560) and knowledge of the functions of forests in the upstream (0.522) . This suggests that the land area has a relationship with the efforts made by farmers in conservation such as reforestation or duct cleaning and management influence in the upstream . Where more land is cultivated , increasing skills in conservation and increasing understanding of the influence of management in the upstream , the willingness to pay will be higher. Forming factors that are considered to represent a factor of six is Skills in Conservation Efforts.
The factors that form WUA’s Willingness to Pay P3A are Farming Experience, Knowledge
about Upstream’s area Conditions, Knowledge
about Changes on Water Quality, Efficiency of utilization of irrigation, and in conservation efforts. The knowledge and skills of farmers' water user in the conservation of water resources needs to be improved through counseling . With the information obtained by the farmers of the extension will be created awareness of farmers to participate in the reward mechanisms.
CONCLUSION
The perceptions from farmers as the water users to the conservation of water resources have been quite good. The value of WTP in the water resources conservation is IDR 88,438, and the total WTP in Boro’s irrigation area is IDR 461,340,000. Factors that form their shared
WUA’s WTP are Farming Experience and
perception regarding the conservation of water resources that include Upstream Area Conditions Knowledge, Knowledge Changes on Water Quality, Efficiency of utilization of irrigation , and Conservation Efforts
RECOMMENDATION
This willingness to pay from the farmers should be improved as the irrigation water needs to be maintained in the conservation of water resources so that it will be fulfilled availability of irrigation water in the future. Strategies to raise
WUA’s willingness to pay towards water resource
149 a. Undertaking intensive coordination between
the WUAs, country and goverment agencies that responsible for water resources conservation
b. Providing information and education about the mechanisms in the conservation of water resources and dissemination of relevant policies
c. Strengthening Institutional Capacity of WUAs and assistance for the maintenance and operation of irrigation that is sustainable environmental
d. Involving farmers in WUAs in the planning and implementation of PES programs for the conservation of water resources
ACKNOWLEDGMENT
Researchers would like to deliver our gratitude to Dr. Nuddin Harahab, MP and Dr. Ir. Bagyo Yanuwiadi who have provided supervision in the writing of this article. Thank you the Government of Purworejo Distric and all those who have participated in this research activities.
REFERENCES
[1]. Darma, A. 2000. The Policies Growth of Water Resources and The Effect to Irrigation Management. Gunadarma University. Jakarta
[2]. Rokeach, M. 1979. Understanding Human Values. Macmillan. New York
[3]. Halkos, G. S, Matsiori. 2012a. Determinants of Willingness to Pay for Coastal Zone Quality Improvement. The Journal of Socio Economics. 41 (4) : 391- 399
[4]. Johnson, N. A, White. D.P., Maitre. 2001. Developing Markets for Water Services from Forests : Issues and Lessons for Innovators. Forest Trendas. Washington DC [5]. Pasya, G. 2002. Payment of Environtmental
Services and The Insentive and Disinsentive Mechanism in Watershed Management,
Proceeding Environmental Good
Governance in Goverment Policies related with Water Resources Management in Autonomy, Juli 13, 2002, page. 1 - 10 [6]. Widada. Darusman, D. 2004. Economic
Domestic Water Value and Irrigation ; Study case in Villages Halimun National Park. Jurnal Tropical Forest Management. 5 (1) : 15 -27
[7]. Nurafifah, K. 2013. Willingness to Pay Water for Conservation in Kerandangan, Lombok Barat. Jurnal Ekosains. 5 (2) : 21 – 31
[8]. Halkos, G. S, Matsiori. 2014. Exploring Social Attitude and Willingness to Pay for Water Resources Conservation. Jornal of Behavioral and Experemental Economics. 49. 54 - 62
[9]. Halkos, G. S, Matsiori. 2012. Assesing the Economic Vaue of Protecting Artificial Lakes. University of Munich. Germany
[10].BBWS Serayu Opak. 2013. Profil BBWS Serayu Opak. Ministry of Public Works. Jakarta
[11].Sugiyono. 2011. Statistic for Research. CV. Alfabeta. Bandung
[12].Pramastiwi, F.E. Irham. S, Any. Jamhari. 2011. Willingness to Pay Coffee Farmers to Environmental Rehabilitation. Jurnal Economic Development. 12 (2) : 187 – 199 [13].Sugiyono. 2011. StatistikauntukPenelitian.
CV.Alfabeta. Bandung
[14].Singgih, S. 2004. SPSS StatistikMultivariat. CetakanKetiga. PT. Elex Media Komputindo. Jakarta.
[15].Halkos, G. S, Matsiori. 2014. Exploring Social Attitude and Willingness to Pay for Water Resources Conservation. Journal of Behavioral and Experimental Economics. 49. 54 - 62
[16].Nurarifah, F. 2008. Analysis Willingness to Pay Farmer to Irrigation Services through Irrigation Rehabilitation. Tesis. IPB
[17].Fauzi, A. 2011. Natural Resources Economic and Environmental. Gramedia. Jakarta [18].Hamidiana, Z. 2016. The Effect of
Community Characteristic to Quantity and Quality of Spring. Study Case in Gunungsari Village, Batu. Tesis. Brawijaya University. [19].Ritohardoyo, S. 2003. Introduction Planning
Regional Development. UGM. Yogyakarta [20].Dasrizal. 2011. Model of Payment for
Environmental Services in Water Resouces Conservation and Land; Study Case in Batang Anai. Jurnal Economic Development. 12 (2) : 187 – 199
[21].UPT Purwodadi. 2014. Evaluation Report 2014. Irrigation Agency. Distric of Purworejo.
[22].Peng, S., J. Huang, J.E. Sheelhy, R.C. Laza, R.M. Visperas, X. Zhong, G.S. Centeno, G.S. Khush, and K.G. Cassman. 2004. Rice Yields Decline with Higher Night Temperature from Global Warming, Proc. Natl. Acad. Sci. 101: 9971 – 9975.
150
WTP P3A dalam Konservasi Sumberdaya Air (Kusumaningrum, et al.)
of Sustainable Development of Agricultural Innovation. 1(2): 83 – 104.
[24].Surmaini, E., Rakman, R, Boer. 2008.Impact of Climate Change on Rice Production : A Case Study in Three Regions with Different Altitude . Proceedings of the National Seminar and Dialogue Land Resources . Research and Development of Land Resources Bogor.
[25].Surmaini, E., E. Runtunuwu, I, Las. 2011. Efforts Agricultural Sector in the Face of Climate Change, Journal of Agricultural Research. 30 (1): 1 – 7.
[26].Arsyad, S. E, Rustiadi. 2012. Rescue Soil , Water and Environment. Second Printing. Obor. Jakarta
[27].Halkos, G. S, Matsiori. 2014. Exploring Social Attitude and Willingness to Pay for Water Resources Conservation. Journal of Behavioral and Experimental Economics. 49. 54 - 62
[28].Effendi, Edie. 2004. Study of Integrated Watershed Management Model Bappenas. [29].Arifah . 2008. Analysis of Willingness to Pay
Farmers to Increase Irrigation Service through Rehabilitation Irrigation in Cisadane Area . Thesis. IPB
[30].Fauzi. 2011. Economic of Natural Resource and Environment. Gramedia. Jakarta [31].Bhandari. Betman. M, Grant. 2007. User