SAND-LIME COLUMN STABILIZATION ON THE CONSOLIDATION OF
SOFT CLAY SOIL
Publication
To fulfill partial of requirement to
achieve S-1 graduate degree in Civil Engineering
Prepared by :
Puguh Merdhiyanto (D 100 112 014)
CIVIL ENGINEERING DEPARTMENT
ENGINEERING FACULTY
UNIVERSITAS MUHAMMADIYAH SURAKARTA
S
AND-LIMEC
OLUMNS
TABILIZATIONONT
HEC
ONSOLIDATIONOFS
OFTC
LAYS
OILP
ENGARUHS
TABILISASIK
OLOMP
ASIR-K
APURT
ERHADAPK
ONSOLIDASIT
ANAHL
EMPUNGL
UNAKPuguh Merdhiyanto
Civil Engineering Department, Engineering Faculty,
Universitas Muhammadiyah Surakarta, Jl. A. Yani Pabelan Kartasura Tromol Pos 1, Surakarta Post Code 57102 Telp. 0271 717417 ext. 159,
e-mail: [email protected]
ABSTRACT
The area in Indonesia has many kind of soft clay, can be found in Central Java area includes Blora, Purwodadi, Solo, Sragen, Klaten and Yogyakarta. It exposes a problem when building on soft clay sites. Therefore to improve infrastructure, many construction activities are increasingly focused on the behavior of the soil. Especially with different soil conditions not always the same in each area of construction that requires accuracy in the planning and execution of construction itself. To overcome the soil conditions are not as expected, then there are several techniques used in order to improve the quality of a particular soil, among which are add other materials (lime) and the vertical drain technique. This research aims to determine the effect of sand-lime column stabilization on soft clay soil from Troketon Pedan Klaten in terms of the consolidation coefficient (Cv), compression index (Cc), and the settlement consolidation (Sc) along with some physical properties. Spacing sampling variation is 50 cm; 33.33 cm and 16.67 cm from sand-lime column. The results physical properties show, from spacing sampling variation of the sand-lime column that specific gravity (Gs) and liquid limit (LL) values decreased, whereas the plastic limit (PL) and shrinkage limit (SL) values actually increased, whereas plasticity index (PI) decreased when the closer spacing sampling of lime column. From the test mechanical properties results show, the closer the sampling of the sand-lime column Cv value tends to increase, the highest average Cv values are 0.00177 cm2/s occur in soil samples 16.67 cm from sand-lime column. While the value of compression index (Cc) tends to decrease, the Cc value was smallest are 0.655 occur in the soil samples using a sand-lime column at a spacing sampling 16.67 cm. While settlement consolidation (Sc) decreases, the smallest Sc value are 0.245 cm occurs in soil samples with sand-lime column at a spacing of 16.67 cm. Based on the above study showed that the addition of sand-lime column can increase/improve the physical properties and mechanical properties of soft clay from Troketon Pedan Klaten.
Key words: Coefficient Consolidation, Compression Index, Physical Properties, Sand-lime Column, Settlement Consolidation, Soft Clay.
ABSTRAK
Daerah di Indonesia banyak memiliki jenis tanah lempung lunak diantaranya bisa ditemukan di daerah Jawa Tengah meliputi Blora, Purwodadi, Solo, Sragen, Klaten, Wates dan Yogyakarta. Hal tersebut menghadapkan suatu permasalahan bila mendirikan bangunan pada lokasi tanah lempung lunak. Maka dari itu untuk meningkatkan pembangunan infrastruktur, banyak kegiatan konstruksi yang semakin fokus terhadap perilaku tanah. Apalagi dengan kondisi tanah yang beragam dan tidak selalu sama pada masing-masing areal konstruksi sehingga mengharuskan ketelitian dalam perencanaan dan pelaksanaan konstruksi itu sendiri. Untuk mengatasi kondisi tanah yang tidak sesuai dengan yang diharapkan, maka ada beberapa teknik yang digunakan dalam rangka meningkatkan mutu tanah tertentu, diantaranya yaitu menambah bahan tambah (kapur) dan teknik vertikal drain. Penelitian ini untuk mengetahui pengaruh stabilisasi kolom pasir-kapur terhadap konsolidasi tanah lempung lunak dari daerah Troketon Pedan Klaten meliputi koeffisien konsolidasi (Cv), index pemampatan (Cc), penurunan konsolidasi (Sc), dan beberapa uji fisis tanah. Spasi jarak yang digunakan adalah 50 cm, 33,33 cm, 16,67 cm dari kolom pasir-kapur. Hasil uji fisis dari spasi jarak yang digunakan yaitu nilai specific gravity (Gs) dan nilai liquid limit (LL) mengalami penurunan, serta nilai plastic limit (PL) dan shrinkage limit (SL) mengalami kenaikan, serta plasticity index (PI) mengalami penurunan ketika mendekati kolom pasir-kapur. Dari hasil uji mekanis, nilai Cv mengalami peningkatan ketika mendekati kolom pasir kapur, nilai Cv tertinggi didapatkan dari jarak 16,67 cm yaitu 0,00117 cm2/s. Nilai Cc mengalami penurunan ketika mendekati kolom pasir kapur, nilai Cv terendah didapatkan dari jarak 16,67 cm yaitu 0,655. Nilai Sc mengalami penurunan ketika mendekati kolom pasir kapur, nilai Cv terendah didapatkan dari jarak 16,67 cm yaitu 0,245 cm. Berdasarkan dari hasil penelitian bahwa penambahan kolom pasir-kapur dapat meningkatkan sifat fisis dan sifat mekanis pada tanah lempung lunak dari daerah Troketon Pedan Klaten.
Kata-kata kunci: Index pemampatan, Koeffisien konsolidasi, Kolom pasir-kapur, Lempung lunak, Penurunan konsolidasi, Sifat fisis tanah.
INTRODUCTION
Background
The area in Indonesia has many kinds of soft clay, can be found in Central Java area includes Blora, Purwodadi, Solo, Sragen, Klaten and Yogyakarta. It exposes a problem when building on soft clay sites. Therefore, to improve infrastructure,
In general, lime is used in many projects for soil stabilization. This method is used in a variety of conditions such as on transportation projects and many of the project structure. The use of lime in the comparatively very low cost because the lime is obtained in several regions in Indonesia. Later known in the fishing world, lime is used as a media to raise the pH of the soil on farms to improve soil conditions by lowering the permeability. In the world of civil engineering lime used for the stabilization of problematic soils. From the description above is intended for mixing lime to raise the pH (Potential of Hydrogen) of the soil where the soil pH rises and the permeability will go down, so soils will be more stable.
Vertical drain basically intended to improve the shear strength of the soil, reducing the compressibility of the soil, and prevent a high settlement and possible damage to the building structure. Vertical drain is generally used on soils with low bearing capacity as the soft clay and organic soil. The soil type typically has the following characteristics: extreme moisture content, high compressibility, and permeability coefficients are little. In principle, the technique is a method of vertical drains soil reinforcement by reducing the water content in the soil (dewatering).
Based on the problems above, this research try to study influence of stabilization sand-lime column for consolidated soft clay soil. Because lime normally used for soil stabilization and sand vertical drain has benefit to reduce moisture content thereby increasing the permeability of the soil.
Research Objective
1) To determine the influence of soil stabilization with sand-lime column method on soil have low permeability or soft clay.
2) To determine the rate of Cv,Cc,Sc for soil with sand-lime column.
3) To determine the effect of sampling spacing variation to the sand-lime column on consolidation value (Cv,Cc,Sc). LITERATURE REVIEW
Soft Clay Soil
Clay soil included fine-grained soils, clay soils are classified as grains have a size of up to micro until sub-micro derived from the weathering of rocks constituent chemical elements. Very hard clay soil is dry and the moisture content is plastic medium, whereas at higher water content of clay is sticky and very soft (Das, 1994). The nature of clay is as follows (Hardiyanto, 2002):
1. The size of fine grains, less than 0.002 mm. 2. Low Permeability.
3. Increase high capillary water. 4. Inter cohesive.
5. The level of development of high shrinkage. 6. The consolidation process is slow.
Sand
Sand is an example of granular materials. Sand grains are generally sized between 0.0625 to 2 millimeters. The material forming of sand is silicon dioxide, but in some tropical and subtropical beaches are generally formed from limestone. Sand is a widely used building material on the bottom of the structure to the top of the building. As well as embankment, mixture, until the concrete mix. Some of sand use in buildings can be encounte-red such as :
1. Use as embankment, sand embankment under the foundation, embankment sand under-floor, sand embank-ment under installation of paving blocks and others. 2. The use of a mortar or a space, usually used as a mortar
for floor work, installation of the foundation stone, brick
wall mounting, space for the installation of ceramic floor and wall tiles, space for the installation of natural stone, plastering walls and others.
3. The use of a good concrete mix for reinforced and non-reinforced concrete, can be encountered in the structure of reinforced concrete foundation, sloop, floors, columns, floor plate, castings, ring beams and others.
Besides, it is still much of sand in the use of building materials that are used as ingredients for the manufacture of molding materials such as paving blocks, concrete blocks, etc. Lime
Limestone is a mineral that is commonly used by industry or construction and agriculture, include for building materials, building stone stabilizers highway, agricultural liming etc. Material Lime is a white and fine objects made of sedimentary rock, forming a rock composed of the mineral calcium.
1. Quicklime is the burning of natural limestone composition is mostly calcium carbonate (CaCO3) at temperatures above (9800 ± C) occur calcination process with the release of CO2 gas to the remaining solids CaO or also called quick lime.
CaCO3 (limestone) -> CaO (quicklime) + CO2 2. Slaked lime is quicklime outage results with water and
form hydrates.
CaO + (H2O) Water -> Ca (OH)2 (slaked lime) + heat 3. Lime air is slaked lime mixed with water after some time
the mixture can be hardened in the air due to the binding of carbon dioxide. contents (volume) of soil will be shrink. Consolidation generally lasts only one department, namely vertical department, because of the additional layer in contact with the load it cannot move in a horizontal department (retained by the surrounding soil). In this state the drainage water is also running one department, namely the vertical department or called "one-dimensional consolidation" and the calculation of consolidation is almost always based on this theory of "one-dimensional consolidation".
In the sand layer, the settlement are quick (immediately) and thoroughly, then the occur of settlement are small, because of sands having "low compressibility".
In the clay layer, the settlement is running a bit slow (takes a long time), then the occur of settlement are high. Therefore, research consolidation generally only on clay soil (fine grain). Because clay has the properties of "high compressibility".
According to the consolidation theory of Terzaghi, consolidation consists entirely of two parts, namely:
1. Primary Consolidation
Consolidation which runs due to the drainage of water from the soil so this settlement is due to in effective stress.
2. Secondary Consolidation
Consolidation is still running after the primary consolidation is completed, after there is no more stress of pore water. And lasts for a long time and having small value.
SOIL PROPERTIES Physical Properties 1. Specific Gravity
temperature of 4 ºC (Hardiyatmo, 1994). This test is intended to determine the change of density due to the effect of sand-lime column declared in the following equation:
Gs= γs/γw
Basically, the soil has three limitations include liquid limit, plastic limit and shrinkage limit. However, the plasticity index of a soil is determined only from the difference of the liquid limit and plastic limit (Plasticity index = Liquid limit-Plastic limit).
1. Plastic limit (PL)
Plastic limit (PL) is determined by rolling out a thread of the fine portion of a soil on a flat, non-porous surface. If the soil is at a moisture content where its behavior is plastic, this thread will retain its shape down to a very narrow diameter. The sample can then be remoulded and the test repeated. As the moisture content falls due to evaporation, the thread will begin to break apart at larger diameters.
2. Liquid limit (LL)
Liquid limit (LL) is conceptually defined as the water content at which the behavior of a clayey soil changes from plastic to liquid. However, the transition from plastic to liquid behavior is gradual over a range of water contents, and the shear strength of the soil is not actually zero at the liquid limit.
3. Plasticity index (PI)
Plasticity index (PI) is a measure of the plasticity of a soil. The plasticity index is the size of the range of water contents where the soil exhibits plastic properties. The PI is the difference between the liquid limit and the plastic limit (PI = LL-PL). Soils with a high PI tend to be clay, those with a lower PI tend to be silt, and those with a PI of 0 (non-plastic) tend to have little or no silt or clay. 4. Shrinkage limit (SL)
Shrinkage limit (SL) is the water content where further loss of moisture will not result in any more volume reduction. The shrinkage limit is much less commonly used than the liquid and plastic limits.
Mechanical Properties Consolidation
As described in the above literature review, consolidation occurs due to the reduced water volume and the air contained in the soil due to the presence of a stress on the soil.
A process of consolidation typically has a long enough time span can reach even 50 years or more. In this incident will show the ability of the soil condenses or so-called index compression.
1. Compressibility Index (Cc)
The value of Cc is the slope of the straight part of the graph of e-log p' consolidation in the laboratory test results that can be written in equation:
Where :
2. Coefficient of Consolidation (Cv)
Consolidation coefficient is used to estimate the speed of soil settlement. This speed is very important to known, especially for soil that has a very large settlement, this is because will greatly affect the condition of the building structures that stand above it.
While the coefficient of consolidation can be formulated as follows :
Where : T = time factor t = time (second)
Cv = Coefficient of Consolidation (cm2/second) H = high of soil (cm)
3. Settlement Consolidation (Sc)
If the cohesive soil (clay) receive an additional load, it will consolidation occurs. Consolidation rate will be affected by the amount permeability and thickness of the soil. The amount of settlement consolidation after finishes can be formulated as follows:
Where :
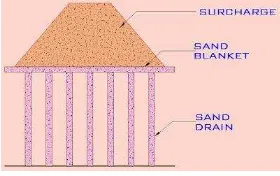
Cc : Compressibility index H : Thickness layer of soil (cm) sand has been filled. A sand blanket is placed over the top of the sand drains to connect all the sand drains. To accelerate the drainage, a surcharge load is placed on the sand blanket. The surcharge is usually in the form of dumped soil.
The pore water pressure is increased by the applied surcharge load in the embankment. The drainage occur in the vertical and horizontal directions. The horizontal drainage occur because of sand drains. The sand drains accelerate the process of dissipation of excess pore water created by the surcharge.
Figure III.1 Illustration of sand drain
Figure III.2 Zone of influence of each drain
The theory of sand drains was given by Rendulic (1935) and Barron (1948). Later, Richart (1959) summarized the theories. Depending on the type of strain, there are two cases ;
1. Free strain case
If the surcharge load placed over the sand blanket is flexible, free strain case occurs. In this case, there is uniform distribution of surface loads, but the settlement at the surface is uneven.
2. Equal strain case
This case occurs when the surcharge applied is rigid, such as heavy steel plates. In this case, the settlements are uniform, but the distribution of pressure is non-uniform. RESEARCH METHOD
Research Location
This research is planned and carried out at the Laboratory of Soil Mechanics Civil Engineering, Faculty of Engineering Universitas Muhammadiyah Surakarta.
Material Used
The test material used is soft clay from Troketon Pedan Klaten Central Java. Other materials for the manufacture of column stabilization include sand and lime.
Equipment Used
Place of test in the form of a steel plate box 100x40x40 cm
Specific gravity tools study and make a load weighing 50 kg.
2. Stage II
In the second phase of this experiment will be conducted without the soft clay consolidation of sand-lime column and the column of sand-lime. On soft clay consolidation the test without sand-lime column in the first phase the test to prepare the box, then insert a soil sample to a height of 30 cm solid soil and gradually 3 layers with the number of strokes by 25 per layers. After the samples column in the first stage insert the sand 5 cm at the base of the box the test as horizontal drainage and installing molding sand-limestone columns that form a semi-circle is placed on the edge of the right and left of the box testing. Then insert soil sample until soil reaches a height of 30 cm solid and gradually 3 layers with the number of strokes by 25 per layers. After the samples were saturated with water soaking for 4 days. After soaking for 4 days of water discharged by opening the drain and wait for 24 hours.
Furthermore remove mold sand-lime column and then fill the hole with sand and lime that have been prepared. Then insert the sand above the soil samples with a thickness of 5 cm in a horizontal drainage. Then place the heap with a weight of 50 kg. Then let stand for 4 days. edges of the box test for consolidation testing.
3. Stage III
At this stage the test will conducted the consolidation of the soft clay without lime column and with sand-lime column. Physical properties test of soil as well as the calculation of the plasticity index (PI).
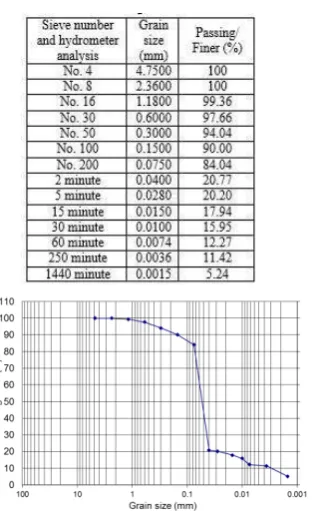
4. Stage IV size distribution test can be showed on the Table V.1 and Figure V.1
Table V.1 Result of grain size distribution
Based on Table V.1 and Figure V.1 from the previous study, soil Troketon Pedan Klaten according to the methods Association Of State Highway And Transportation Officials (AASHTO), classify as A-7-6, the poor clay. According to the methods United Soil Classification System (USCS), classify as CH group that inorganic clay with high plasticity.
1. Specific Gravity Test (Gs)
Specific Gravity test (Gs) includes soil stabilization without sand-lime column and also soil stabilization with sand-lime column use spacing sampling variation from the right and left of the column as 16.67 cm; 33.33 cm; 50 cm. Test results can be viewed in Table V.2.
Table V.2. Result of Specific Gravity Test
Figure V.2. Relationship between spacing sampling variation and specific gravity (Gs)
From the Table V.2 and Figure V.2 indicates of average Specific Gravity value decrease start from: without column; 50 cm; 33.33 cm; and 16.67 cm. This due to specific gravity of lime are 2.107 less than specific gravity of soil, so it makes the specific gravity of soil closer from the sand-lime column decrease.
2. Atterberg Limits Test
Atterberg Limit test intended to determine physical properties changes from each sample of soil without stabilization and sand-lime stabilization installed with spacing as in Table V.3.
Table V.3 Result of Atterberg Limit Test
Figure V.3 Relationship between spacing sampling variation and liquid limit value (LL)
From Table V.3 and Figure V.3 indicates that liquid limit value (LL) decrease when getting closer to the sand-lime column. The lime which mixed with the soil causing release of bond soil
particles, this makes the soil cohesion decreases, so that the liquid limit value decrease too.
Figure V.4 Relationship spacing sampling variation and plastic limit value (PL)
From Table V.3 and Figure V.4 indicates the plastic limit value always increase when getting closer to the sand-lime column. This was due to decrease soil cohesion.
Figure V.5 Relationship between spacing sampling variation and plasticity index value (PI)
From Table V.3 and Figure V.5 indicates the plasticity index value decrease when getting closer to the sand-lime column. Decreasing plasticity index value are indicates down of potential expansion the soil.
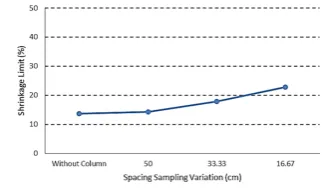
Figure V.6 Relationship between spacing sampling variation and shrinkage limit value (SL)
When the soil loses moisture content then it will have depreciation until it in a position solid or semi-solid and called Shrinkage Limit (SL). In Table V.3 and Figure V.6 shows the shrinkage limit value (SL) increased when samples taken closer sand-lime columns that mean less the potential of expansion. This due to the reaction that causes the soil with lime soil grains become larger and reduce the specific surface area of soil and cause soil sensitivity to reduce water absorption.
Mechanical Soil Properties
1. Coefficient of Consolidation (Cv)
Spacing sampling variation are taken 50 cm, 33.33 cm and 16.67 cm from the edge of the sand-lime column. Result coefficient of consolidation (Cv) can be viewed on Table V.4.
Table V.4 Result coefficient of consolidation (cm2/second)
Table V.5 Result of coefficient consolidation value (Cv)
Figure V.7 Chart of relationship between spacing sampling variation and Cv
From Table V.4 and Figure V.7 indicates of comparison coefficient consolidation (Cv). If taking the sample from the column is closer, then coefficient consolidation (Cv) increasing as well. The greater Cv value, then the consolidation process become faster. This due to soil that is closer sand-lime column is drier.
Table V.6 Difference Cv value spacingsampling variation against without column
From Table V.6 indicates percentage of Cv value indicates that the Cv value show a very significant increase in percentage as close to the sand-lime column.
2. Compression Index (Cc)
Result of compression index (Cc) taken from spacing variation can be viewed on Table V.7.
Table V.7 Result of compression index value (Cc)
Figure V.8 Relationship between spacing sampling variation and compression index (Cc)
From Table V.7 and Figure V.8 indicates compression index value decrease when getting closer to the sand-lime column. This due to decreasing soil compression that occurs, then the compression index decrease too.
Table V.8 Difference Cc value spacing sampling variation against without column
From Table V.8 indicates percentage of Cc value indicates that the Cc value show significant increase in percentage as close to the sand-lime column.
3. Settlement Consolidation (Sc)
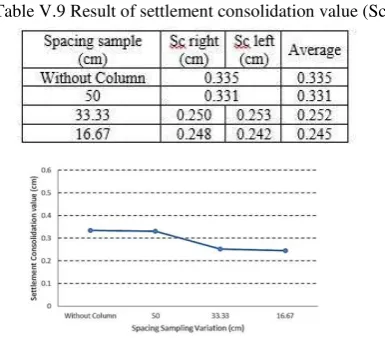
Result of settlement consolidation (Sc) taken from spacing variation can be viewed on Table V.9.
Table V.9 Result of settlement consolidation value (Sc)
From Table V.9 and Figure V.9 indicates settlement consolidation value decrease when getting closer to the sand-lime column. The decreasing Sc value shows that sand-lime column have a good effect, because it can reduce the settlement.
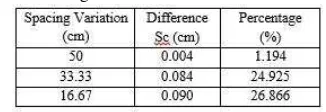
Table V.10 Difference Sc value spacing sampling variation against without column
From Table V.10 indicates percentage of Sc value indicates that the Sc value show increase in percentage as close to the sand-lime column.
CONCLUSION AND SUGGESTION
Conclusion
Based on research in the laboratory and analysis data, can be concluded as follows:
1. Sand-lime column stabilization have improved to the consolidation on soft clay.
2. Large of average coefficient consolidation (Cv) on soft clay used there 0.00022 cm2/s. Compression Index (Cc) are 0.899. Settlement consolidation (Sc) are 0.335 cm.
3. Sand-lime column have improved on physical properties soil from Troketon Pedan Klaten, soil sampling spacing taken 50 cm ; 33.33 cm ; and 16.67 cm from edge of the column having good specific gravity (Gs) there 2.277 ; 2.234 ; 2.151 than without column there 2.303. Liquid limit (LL) have decreasing value are 79.5%; 76.25%; 74.88% than without column are 82%. Plastic limit (PL) have increasing value are 36.07%; 37.64%; 41.61% than without column are 31.8%. Plasticity index (PI) have decreasing value are 43.43%; 38.62%; 33.27% than without column are 50.20%. Shrinkage Limit (SL) have increasing value are 14.26%; 17.84%; 22.74% than without column are 13.67%. Sand-lime column can be increasing coefficient of consolidation value (Cv), the higher percentage is closer from sand-lime column there 547.856%. Compression index value (Cc) is decreasing, the higher percentage is closer from sand-lime column there 27.141%. Settlement consolidation (Sc) is decreasing, the higher percentage is closer from lime column there 26.886%. So, adding the sand-lime column is well for soft clay soil.
Suggestion
Based on research conducted, so for the next research has suggested as follows:
1. Further research needs to be conducted for the variation diameter of the column.
2. Research needs to be conducted, mixing sand and lime to comparison with this research.
3. Research need to be conducted with other material. REFFERENCES
Apriyono A, Sumiyanto, Adhe NPSH 2008, Studi Pengaruh Stabilsasi Tanah Lempung Lunak Menggunakan Kolom Kapur Terhadap Parameter Kecepatan
Penurunan Tanah, Jurnal Dinamika Rekayasa, Vol 4
No 1, pp. 1-5.
Luftfiarta, D (2014), Stabilisasi Tanah Lempung Lunak Dari ds. Jono kec. Tanon kab. Sragen Menggunakan Kolom Kapur Dengan Variasi Jarak Pengambilan Sampel, Universitas Muhammadiyah Surakarta.
Muhammad, TK (2013), Study Perilaku Penurunan Tanah Kelempungan Dengan Perkuatan Kolom Pasir. Universitas Hasanuddin.
Satriyana, MRW (2014), Tinjauan Jarak Pengambilan Sampel Pada Tanah Lempung Lunak dari ds. Jono kec. Tanon kab. Sragen Yang Distabilisasi Dengan Kolom
Pasir, Universitas Muhammadiyah Surakarta.
Septian, R (2012), Perbaikan Tanah Secara Hidrolis, Accessed 19.September 2014.http://aboutsoil.wordpress.com/ 2012/08/01/perbaikan-tanah-secara-hidrolis/
Setiawan, A (2008), Pengaruh Pemakaian Kapur Terhadap Tekanan Pengembangan Dan Penurunan Konsolidasi
Pada Tanah Lempung Pedan Klaten. Universitas
Muhammadiyah Surakarta
Terzaghi, K., & Peck, R. B. (1993).Mekanika Tanah dalam Rekayasa.In Mekanika Tanah dalam Rekayasa. Jakarta:Erlangga
Yulianto, EF (2013), Perhitungan Tekanan Air Pori Pada Proses
Sand Drain Dengan Metode Beda Hingga.
Universitas Madura.