Agriculture, Ecosystems and Environment 75 (1999) 145–146
Erratum
Erratum to “Long-term agricultural field experiments in Northern
Europe: analysis of the influence of management on soil carbon stocks
using the ICBM model” [Agric. Ecosyst. Environ. 72 (1999) 165–179]
qThomas Kätterer
∗, Olof Andrén
Department of Soil Sciences, SLU P.O. Box 7014, S-75007, Uppsala, Sweden
In the original publication of this article three errors were published. 1. In Abstract, lines 13 and 14, the units should be kg C m−2,
2. In Fig. 1(c) and (d) the title is incorrect,
3. Table 2: In column 1, the order of entries under C and D should be interchanged. The corrected version is given below.
Abstract
Land use in general and particularly agricultural practices can significantly influence soil carbon (C) storage. Changes in topsoil C mass measured in long-term agricultural field trials in Sweden and other Northern European countries were compiled and aggregated into seven treatment classes, including manured, fertilized and straw exported. The impact of crop rotations and management practices on C stocks in the topsoil was analyzed using both a static model and a dynamic soil carbon model (introductory C Balance Model; ICBM). ICBM consists of two state variables and four fluxes (governed by four rate-determining parameters), and one parameter. re, combining most external factors affecting C mineralization (temperature. precipitation. drainage, etc.). Simple ‘front-end models’ were used to estimate values for two of the parameters, i (annual C input) and h (humification coefficient) initially based on incomplete records from the field trials, official agricultural statistics and other literature. The reparameter was then optimized for each class of treatments, using an algorithm for non-linear least squares. Initial soil C mass, present C inputs and abiotic conditions, such as soil temperature and moisture. were the deciding factors in whether C stocks declined or increased. Steady-state values calculated using the static and dynamic model were similar for both models, but differed greatly between treatment classes. For cereal-dominated cropping systems where the straw was removed, manure application increased steady-state values about three times (from 3 to 9 kg C m−2) compared with corresponding treatments. Incorporation of straw resulted in intermediate steady−state values (5–6 kg C m−2) C mineralization rates were highest in bare fallow treatments. For one class of soils, C retention in the soil was found to increase significantly with increasing clay content. The hypothesis that the climatic gradients in Northern
q
PII of original article: S0167-8809(98)00177-7 ∗Corresponding author. Fax: +46-18-672-795
E-mail address: [email protected] (T. Kätterer)
146 T. Kätterer, O. Andr´en / Agriculture, Ecosystems and Environment 75 (1999) 145–146
Fig. 1. Carbon in the topsoil (kg m−2) measured in long-term field experiments as affected by management: See Table 1 for site descriptions and references and http://www.mv.slu.se/vaxtnaring/olle/icbm.html for details. Classes: A, bare fallow (no crop, repeated weeding and/or harrowing); B, Straw exported or burnt, no or low N fertilization; C, crop residues incorporated, medium-to-high N fertilization; D, straw exported or burnt, medium to high N fertilization; E, application of different amounts of farm-yard manure; F, permanent grassland or crop rotations with more than 50% ley; G, crop rotations with different frequency of fallow, cereals and ley, with or without manure/slurry application.
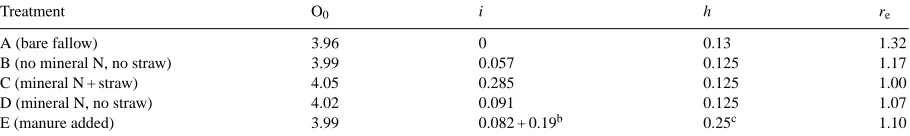
Table 2
Parameter values as calibrated for treatments in a Swedish long-term experiment (Andr´en and Kätterer, 1997)a
Treatment O0 i h re
A (bare fallow) 3.96 0 0.13 1.32
B (no mineral N, no straw) 3.99 0.057 0.125 1.17
C (mineral N + straw) 4.05 0.285 0.125 1.00
D (mineral N, no straw) 4.02 0.091 0.125 1.07
E (manure added) 3.99 0.082 + 0.19b 0.25c 1.10
aO0is in kg C m−2in the topsoil, i is in kg C m−2per year, summed from above- and below-ground C sources and from manure (E), whereas h and reare dimensionless. The rate constants kYand kOwere the same for all treatments, 0.8 and 0.006 per year, respectively.
bFrom manure.
cWeighted mean, i.e. h = 0.125 for plant-derived material and 0.31 for manure.