FACTORS INFLUENCING THE USE OF PUBLIC LIBRARY:
A CASE IN INDONESIA
Ahmad Ridwan Siregar
(Department of Library Science/Universitas Sumatera Utara (USU) /Indonesia/ +62 618215956/[email protected])
ABSTRACT
This paper aims to address a question whether location, location supporting infrastructure, demographics characteristic, physical specification, library operational, and users motivation have influence on the usage of public library.
This study used is explanatory method using a survey to explain relationship between the tested variables. 351 samples were collected by accidental sampling from users of two libraries i.e. Public Library of Medan city and Provincial Public Library of North Sumatera. An instrument was designed with 109 questions to gather data on 7 variables with a total of 45 indicators. The closed question uses a 5 point Likert scale. The validity and reliability tests were done, while the descriptive and inferential statistic analysis were used as the technique of data analysis.
Using a Structural Equation Modeling (SEM), five out of six independent variables tested and found have significant influences to the usage of public library namely; location, location supporting infrastructure, physical specification, operationss, and users motivation, while demographic characteristic variable has no significant influence.
In maximizing the usage of public library in a region, the government whom responsible of taking care the public libraries initiatives, should take attention to the library location that has acceptable distance or travel time to community residence; library has attractiveness both in physical building specification and quality of services provided; and demographic factor and user motivation should be taken place as a basic in improving public library role. Spatial based public library should be included as a component in a city planning.
Keywords : Location Facilities Model, Location of Public Facilities, Location of Library Facilities and Usage of Public Library
Paper type − Research paper
1. INTRODUCTION
1.1. Background of Study
Formal education institutions should be supported by the facility to obtain information and knowledge. Libraries as one of the reliable facilities, traditionally is a main character repository and dissemination of information. In developing countries, the role of the library has not been sought maximum to support the improvement of human resources’ qualities especially in urban environments while in developed countries, it is seen as one of the important institutions that play a greater role in community empowerment.
Public library facilities is one of the necessary public facilities to improve the quality of human resources and support for economic and social activities in urban areas. Provision of library facilities that were good and easily accessible by all citizens will be increasingly important with regard to the challenges of globalization which demands competitiveness. Therefore, the issue of public library facilities, especially with regard to the location is crucially to be studies. Public library facility site selection is the most important decision made by city planners. A mistake in the choice of location or meant a decrease in access and usage (Palmer, 1981). In addition to the location and the infrastructure to support the location, the usage of library is also supported by other factors such as physical specifications, demographic characteristics of users, operational and users’ motivations.
The city's public library system varies greatly depending on the environment. A large city usually has a main building and a number of branches in a number of centers. In contrast to a small city, the library services provided at one location. For example, Singapore with a population of about 5 million people have a city’s public library system is at 39 locations (National Library Board Singapore 2008), and New York with approximately 20 million residents are served by a public library system located in 200 locations (Japzon and Gong, 2005).
A phenomenon occurs in a number of developing countries including Indonesia found that the public libraries are less developed as it is not included as a component in the planning of urban areas. Although the city has developed rapidly, but the library system almost unchanged. Thus, the unsufficient number of libraries could not serve the community. In addition with the above situations, the Indonesian people perceived that they do not see the importance of the public library location factor for optimal service performance and the pivotal role of public libraries in improving the quality of human resources. Thus a question arised, what factors to be considered in the planning of a public library location to increase
it’s usage by the population.
2. LITERATURE REVIEW
2.1 Location Facilities and Public Library
One important factor to enhance the role of the library is to provide library services or facilities to the population. This relationship has been shown to result in increased use of the library. In other words, the location became the determining factor for the level of use of public libraries, in addition to other factors such as infrastructure to support the location, demographic characteristics, attractiveness and user motivation. Facility location problems involving decisions about the number and location of a facility (Seppala, 1997). The location of the facility include the location of educational facilities such as schools and libraries. Placement facilities are generally carried out in relation to the demand and supply point. Location theory was formally introduced in the 19th century by Von Thunen, concentrating mainly on the location of the various different types of agriculture. Then at the beginning of the 20th century, Alfred Weber discusses a single warehouse location to minimize the total travel distance between the warehouse with a number of customers spread spatially. Finally, the location theory follows two paths. Economists follow Von Thunen and concentrate on explaining the spatial behavior of economic activity, such as housing or the flow of goods to the subject of consumption, while the researchers in operations research field followed Weber. According to Seppala (1997), both lines can be regarded as descriptive and normative approaches. Descriptive model to explain why a certain type of spatial behavior takes place, and the normative model provides guidance to decision makers for the location decision. This difference was not entirely exclusive because there are some models that are used in both aspects.
2.1.1 Location Facilities Model
Church and Revelle (1976) states that one important factor in measuring effectiveness of a facility location is determined by the average distance between user's location to the location of the facility. If the average trip distance users to the location of a facility increases, the accessibility of the facility will be decreased so that the effectiveness of the use of the facility will be decreased. The relationship phenomenon occurs in facilities such as libraries or schools which desired to be closely located.
In measuring effectiveness, some authors measured the distance between the point of the user with the facility for each user and calculates the total travel distance between users and facilities. P-median used to measure the effectiveness of the search for the location of a number of "p" facility, which then the total travel distance between users and facilities will be minimum. However, P-median is not suitable to be adopted because only measures the average distance.
To determine the location of the facility, the theory of affordability is often used. The demand will be covered if a facility can reach users in a specific amount of time. Affordability problems are divided into two main sections, one discusses about the area where the need for accessible and optimalization. Two issues of affordability is divided into location set covering problem and maximal covering problem. The objectives of set covering problem is to minimize the cost of the facility location. All models in the covering problem implicitly states that if the demand met by the available facilities, the facility will be to serve the demand. Another is called as center problem, known as minimax location problem. Minimax location problem is the classic form of a combination of optimization in operations research and location of the facility. The center problem is useful to minimize the maximum distance between the demand and the facility closest to the request. This approach is useful to close the gap between the customer who is located farthest to the nearest facility.
In relation to a dynamic location, Daskin and Owen (1998) divides into two dynamic locations categories namely; (i) a dynamic model of a single facility location; and (ii) a dynamic model of multi-facility location. The dynamic single facility location model was first introduced by Ballou in 1968 that explains how to put the warehouse to maximize profits through a particular plan. Ballou receipts deterministic dynamic optimal solutions. Ballou’s approach is optimized by Sweeney and Thatam (1976) and found a rank order (Rt) of best solution. However, Ballou, Sweeney and Thatam not consider the cost as variable constraints. Welowsky (1976) suggested to include the cost factor as a variable constraint in making
facility’s relocation decsion, especially in an emerging region whereby an increasing number of population, the location of existing facilities must have a minimal cost (Drezner and Welowsky, 1991). Meanwhile a model of multi-location dynamic facilities mentioned by Scott (1991) is an extension of a dynamic model of single facility location.
In addition to deterministic static and dynamic location, one known is stochastic location. Location stochastic divided into two parts namely; probabilistic and scenario planning approach. Probabilistic approach is the location of the facility considered the probability distribution model with random quantity. Probability models divided into two standard formulations developed by Manne (1961) and a queuing model introduced by Larson (1974), while the scenario planning is a model that was developed in which decisions are taken based on the uncertainty of the future. Therefore, it needs to make a plan for the future in the form of scenario planning through trend analysis (Mobasheri and Sioshansi, 1989).
2.1.2 Location of Public Facilities
The context of a public facility location model has different requirements compare the criteria in the private sector (Dear, 1974). The criteria of a public facility location problems encountered on the need for justice, which is as important as the efficiency of the impact on the location selection, lack of competition in provision of services, the need for public accountability, and public involvement in decision-making. Efficiency is a value to minimize the aggregate cost of movement in one particular space systems (Harvey, 1973). While in public sector, the principle of fairness and efficiency as the goal of the system of public facilities often lead to conflict (Truelove, 1993). Efficiency with respect to the distribution of services to the community and the justice due regard to the distribution of such services (Truelove, 1993). Problems in private sector concentrate on the structure and location of individual units, while public sector concentrates on the theory generally deal with multiple locations on a single system dynamic framework (Dear, 1974).
Furthermore, Dear (1974) identifies some common characteristics associated with the facility location problem such as; i) the importance of attention to public goods or on the welfare principle of redistribution of resources to the community; ii) the hierarchical nature of the system of public facilities. This hierarchy may be realized in relation to the building (one main library/large center and several smaller branch libraries).
In the classical approach to the location of public facilities, it is assumed that the demand for the services offered by the facilities is been available. The aim is to put the facility to meet existing demand (Daskin, 1995; Current and Schilling, 1990; Revelle and Eiselt, 2005). The decision of location based on the spatial distribution of the population, not based on population size. Facility location decisions based on demographic character could be overlooked when decisions are made to the facility have no great impact (Antunes and Bigotte, 2003).
The proximity (distance and travel time) is a fundamental aspect of location analysis. Many models which seek to minimize the distance and time between customer and facility in which a service can be obtained. As a counterpoint to this model, a covering model is introduced which based on the concept of acceptable proximity. This covering model can be classified based on several criteria the type of target (Marianov and Serra, 2004); i) to minimize the number of facilities required to fully cover the population (set covering model); ii) to maximize the population covered, with a limited number of facilities or servers (maximum covering models).
Selecting a location for providing a service with a number of limitations is the important logistics activities in various contexts. Decisions about the location of the facility is a crucial element in the strategic planning of both private and public institutions (Daskin and Owen, 1998).
2.1.3 Location of Library Facilities
The mistakes in the choice of facility location leads to reduced maximum potential, effectiveness, and fairness of service. For public libraries, the location is not optimal meant a decrease in access and decreased usage. There are differences in the nature of the destination of location for public and private sector must be considered (Revelle, 1970). Wheeler in 1920 develops his views using the librarians’ subjective assessment not by empirical research. For this reason, Wheeler criteria should be evaluated and compared with other descriptive literature of library location (Koontz, 1997).
Most of the literature on library locations can be categorized as an essay and not based on present analytical information. Those studies generally discussed on the construction of a single new building, additional and rearrangement initiatives that already exist. A number of descriptive literature is generally written by the librarians involved in the site selection process, including checklist techniques or description (Koontz, 1997). Koontz (1994) proposed the use of a retail location theory to solve the dilemma of the public library locations. Others are the demographic characteristics that influence consumer behavior such
usage (Koontz, 1997). In addition, the locational pattern is a system significantly affect the
library’s usage (Koontz, 1997; Coughlin, 1972), while studies have shown that the distance
between the library is imperative in determining the library location as well as having an
impact to the library’s usage (Getz, 1978).
Wheeler (1958) states that the public library location, both central and branch libraries should be strategically located in the commercial center or where people are gather/concentrated, which it is called as a center of gravity. Such locations are usually not directly related to the distribution of population but influenced by the facilities and customs/travel patterns. However, Koontz (1997) argued Wheeler’s view that does not take account of growth in suburban areas, land value concept, market segmentation, consumer behavior, and others. In 1965, Frank Wetzel stressed that the first step in the analysis of library location is based on economic survey including the potential population and trade area (Koontz, 1997). Previously, Koontz (1992) outlines some of the principles that are imperative in determining the library location such as; i) closeness of the library facilities; ii) a choice for the larger branches; iii) time of service; iv) age and education; v) families with children more often went to library than whom were not. While, a distance variable is the most often discussed as the public library facility location problems (Koontz, 1992).
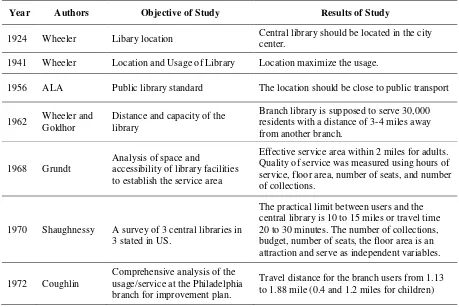
The determination of facility layout and planning of library systems have developed tremendously in the past (Coughlin, 1972). The determination of the library’s location in the context of general facility location theory is been mostly discussed topic in the 1970s and 1980s (Koontz, 1997). The distance and its influence on the usage has been a major focus (Coughlin, 1972; Bennett and Smith, 1975). The usage patterns have been studied by looking at the relationship of demographic characteristics and socio-economic against the library users. Some important characteristics are education, income, and employment (Coughlin, 1972). A widespread of libraries have been studied in relation to regulations set by the government. Various results of previous studies that have been done with regard to the location of the public library as summarized in Table 1.
Table 1. A Summary of Past Studies on Location and Usage of Library
Year Authors Objective of Study Results of Study
1924 Wheeler Libary location Central library should be located in the city center.
1941 Wheeler Location and Usage of Library Location maximize the usage.
1956 ALA Public library standard The location should be close to public transport
1962 Wheeler and Goldhor
Distance and capacity of the library
Branch library is supposed to serve 30,000 residents with a distance of 3-4 miles away from another branch.
1968 Grundt
Analysis of space and
accessibility of library facilities to establish the service area
Effective service area within 2 miles for adults. Quality of service was measured using hours of service, floor area, number of seats, and number of collections.
1970 Shaughnessy A survey of 3 central libraries in 3 stated in US.
The practical limit between users and the central library is 10 to 15 miles or travel time 20 to 30 minutes. The number of collections, budget, number of seats, the floor area is an attraction and serve as independent variables.
1972 Coughlin
Comprehensive analysis of the usage/service at the Philadelphia branch for improvement plan.
Year Authors Objective of Study Results of Study
1978 Getz Analysis of efficiency of 59 public libraries in New York
Service time is the most important variable in choosing between the two facilities and location of each library relative to the others.
1980 Getz
Analysis of 31 library system in the United States for measuring square miles per location
Survey on urban systems, as many as 32 libraries are located in 1 mile radius each, 4 metropolitan library located in 2.8-mile radius each, 3 libraries in the suburbs located in 3.7 miles radius each. populated urban area. Central library users to travel 20 minutes to get a specific service. The proximity of the facility to increase the usage.
1983 Hayes and the library with a population in a specific region
Characteristics of the population affect the
library’s usage. With a combination of quality characteristics of the population, it is useful to estimate the usage.
1996 Alaqeeli
Examined the frequency of visits of international students at Ohio public libraries.
Use the library for reading in spare time, self learning, and as needs of the family.
1996 Forde Examined the use of libraries and reading habits of Nobel laureate
2.2 Conceptual Framework and Hypothesis
Fig.1 Conceptual Framework
The research hypothesis is formulated as follows:
The location of the library, supporting infrastructure library location, the demographic characteristics of library users, the physical specifications of the library, library operations, and motivation of library users influence the use of public libraries in the city of Medan.
3. METHODOLOGY
This research used an explanatory design of survey. A design of explanation deployed to explain the position of the variables identified and the effect of one variable with other variables.
3.1 Operationalization of the Constructs
The use of libraray model incorporated six constructs. Location has been operationalized by
four items: distance of user’s residence, distance of user’s working/school/institution place, time needed to reach the location from residence, time needed to reach the location from working/school/institution place. Location supporting infrastructure has been operationalized by six items: availability of transportation from residence or working/school/institution place to reach the location, availability of road infrastucture to location from residence or working/school/institution place, availability of pedestrian, availability of corridor facilities connection from public and private vehicles’ stands to the location, condition of the road infrastructures to reach location, directions to reach location. Demographic characteristics has
been operationalized by seven items: user’s age, gender, education level, language ability, race/religion/tribe, economic level, physical disabilities and limitations. Physical specifications have been operationalized by nine items: floor space and the physical state of the building, capacity of the room consists of reading, discussion, collection, reference and Internet access rooms, room layout, furniture, garden or yard, parking facilities, building lobby, public facilities, facilities for physical disabilities. Operations have been operationalized by six items: service system of opening hours and service time, type of services, regulation, collection, retrieval system, program. Motivation has been operationalized by eight items: meeting the needs of information, achievement, self development, self awareness, reading interest, better hope expectation, task completion, joint
Library’s Usage
Motivation Operations Physical specifications Demographic characteristics Location supporting infrastructure
goals achievement. Library’s usage was operationalized by four items: frequency of visit, length of visit, total books borrowed, total pages copies, Internet access time.
3.2 Data collection and sampling
A questionnaire was used as a primary data collection tool. The researcher collected the data from the public libraries’ users in Medan City, North Sumatera province, Indonesia. This city has a relatively small area of 26,510 Ha with a large population which consists of 25 districts. The respondents were selected through accidental sampling method. This technique is based on chance, that is anyone who by chance met with researchers and deemed suitable as a data source (Sugiyono, 2002). Based on Krejcie’s Table of sample size, a population of 4,193 people (rounded to 4,000 people) has a sample of 351 respondents. A large number of samples have been following the rules of data analysis techniques that will be used; a structural equation model, which requires a minimum of 100 samples for maximum likelyhood estimation techniques (Ghozali, 2004).
4. RESULTS
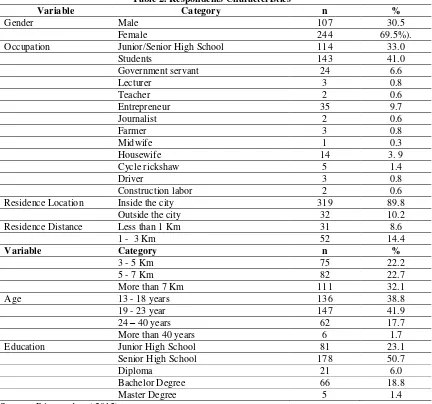
Preliminary analyses were conducted to provide information about the characteristics of sample firms in Table 2, including gender, occupation, residence location, residence distance, age and education.
Table 2. Respondents Characteristics
Variable Category n %
Gender Male 107 30.5
Female 244 69.5%).
Occupation Junior/Senior High School 114 33.0
Students 143 41.0
Government servant 24 6.6
Lecturer 3 0.8
Teacher 2 0.6
Entrepreneur 35 9.7
Journalist 2 0.6
Farmer 3 0.8
Midwife 1 0.3
Housewife 14 3. 9
Cycle rickshaw 5 1.4
Driver 3 0.8
Construction labor 2 0.6
Residence Location Inside the city 319 89.8
Outside the city 32 10.2
Residence Distance Less than 1 Km 31 8.6
1 - 3 Km 52 14.4
Variable Category n %
3 - 5 Km 75 22.2
5 - 7 Km 82 22.7
More than 7 Km 111 32.1
Age 13 - 18 years 136 38.8
19 - 23 year 147 41.9
24 – 40 years 62 17.7
More than 40 years 6 1.7
Education Junior High School 81 23.1
Senior High School 178 50.7
Diploma 21 6.0
Bachelor Degree 66 18.8
Master Degree 5 1.4
4.1 Structural Equation Modelling (SEM) Analysis
Using Structural Equation Model Analysis (SEM), there are three stages that must be done through confirmity factor analysis namely; overall model fit analysis, factor analysis of loading, and reliability analysis (Hair, 1998).
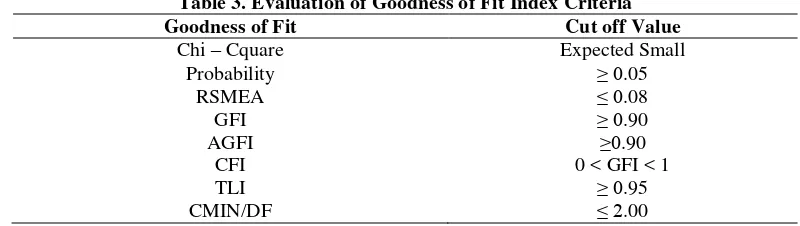
4.1.1 Goodness-of-Fit
Analysis using SEM requires some suitability index to measure the correctness of data and models to be filed. Goodness-of-fit of a model can be assessed based on some measure of fit as follows:
Table 3. Evaluation of Goodness of Fit Index Criteria Goodness of Fit Cut off Value
Chi – Cquare
Initially, the data were cleaned, and the variables were screened for normality, homogeneity of variance and for detection of outliers. No outliers were found during the analysis. In the first stage of data analysis, Conformity Factor Analysis (CFA) was used to determine if the number of factors and the loadings of measured items on them conform to what is expected on the basis of the proposed model (Kim and Mueller, 1978). Using CFA to fit the results to a model, it can be noted that all items have the same component loading sign, which indicates the measure fits the data well. After data reduction, the reliability coefficients are acceptable for all dimensions as shown in Table 4. All correlations were positive, ranging from 0.038 to 0.682, and significantly correlated at both the 0.01 and the 0.05 levels as seen in Table 5.
Table 4. Cronbach's Alpha and Component Loading Range. Variable Number of
Location supporting infrastructure 6 -0.126 – 0.977 .878
Demographic characteristics 7 0.283 – 0.653 .923
Table 5. Descriptive statistics and correlation coefficients
Independent Variables Mean SD (1) (2) (3) (4) (5) (6)
1. Location 3.75 1.099 1
2. Location supporting infrastructure 3.88 1.082 .570** 1
3. Demographic characteristics 4.22 0.974 .540** . .487** 1
4. Physical specifications 3.57 1.032 .682** .302** .344** 1
5. Operations 3.48 1.038 .361** .433** .302** .274** 1 6. Motivation 3.57 0.934 .038* .085* 0.140* .079* .105* 1
Tabel 6. A Summary of Goodness of Fit Model
Goodness of Fit Cut Off Value Estimation Values Test Results
Chi – Cquare
As depicted in Table 6, model evaluation on the construct as a whole has produced fit value of GFI so it can be stated that the model is acceptable. Thus the model is assessed valid for hypothesis testing.
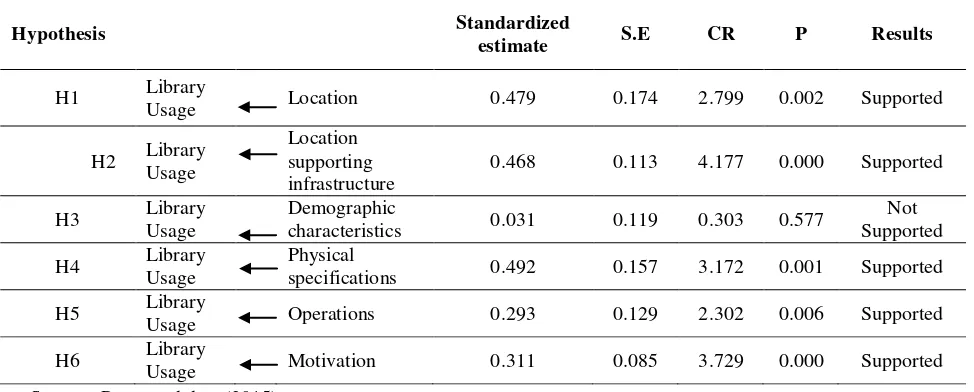
Hypothesis testing is done by looking at the probability value or significance relationship of each variable. The criteria used is: if p <0.05 then the relationship between variables is significant. The precision of the path measurement between each variable was tested by comparing the value of the direct effect, standard errors and CR.
Table 7. Standardized Estimates of the Library’s Usage Model
Hypothesis Standardized
characteristics 0.031 0.119 0.303 0.577
Not Supported
H4 Library Usage
Physical
specifications 0.492 0.157 3.172 0.001 Supported
H5 Library
Usage Operations 0.293 0.129 2.302 0.006 Supported
H6 Library
Usage Motivation 0.311 0.085 3.729 0.000 Supported Source : Processed data (2015).
As depicted in Table 7, the highest value among six exogenous variables that has appropriate affect to the library’s usage is the users’ motivation variable with path coefficient of 0.311 and the CR value of 3.729 and supported by a low standard error value (0.085).
5. DISCUSSION
The results found that five out of the six variables have a significant effect, and one variable, namely the demographic characteristics have a positive effect but not significant. It means that the location, location of supporting infrastructure, physical specifications, operations, and users’ motivation are important factors that should be considered in planning a city's public library system in order to optimize the purpose of providing facilities can be achieved. The identification of a number of variables with each indicator plays a role in the library usage. The library’s usage supported with empirical data has an impact on the frequency of visits, length of visits, number of borrowed collection, number of pages copied from library materials, and time taken to use the Internet.
There are two items found very influential with regard to the location namely the distance and travel time to reach the location (standardize path coefficient = 0.479 with a value of p = 0.002). Both of these factors called as the proximity. While the important matters relating to location of supporting infrastructure (standardize path coefficient = 0.468 with a value of p = 0.000) is the availability of public transport, main roads, pedestrian, and signage. These factors are discussed below.
Distance. The new findings in this study which also distinguishes it from previous research is the distance between the residence and travel time to reach the location of the public library.
Based on user expectations can be stated that the ideal desired distance is ≤ 3 Km (77.6%).
Previous research conducted and widely applied in developed countries like the United States with an ideal distance is ≤ 3 miles or 5.5 km (Koontz, 1997). This difference can be understood caused by factors other than transportation conditions as well as the different levels of mobility between the two regions.
Travel Time. The travel time desired by the user to reach the library facility is a maximum of 30 minutes (91.9%). This finding supports studies conducted by Leonard Grundt in 1963 (Koontz, 1997). These findings also support a research conducted by Thomas Shaughnessy of the use of public libraries in New York, Pennsylvania and New Jersey (Koontz, 1997).
Public Transportation. Public transport is the most widely used mode of transport in urban areas, as well as for users of public libraries. These results indicate that the public transportation route is the strongest indicator (loading factor=0.977) to measure variable of location supporting infrastructure. Therefore, all the city's public libraries, including branches should be in public transportation’s lines. This is consistent with the statement of ALA (1956) states that the location of public library should be close to public transport.
5.2 Physical Attractions and Operations
There are two factors that influence the use of the library in terms of management and operation used as the main attraction for the resident, namely the physical specifications of the building (path coefficient standardize = 0.492 with a value of p = 0.001) and operations of the library (path coefficient standardize = 0.293 with p = 0.006). Both are needed to determine whether a library facility is demanded or otherwise by the resident.
Physical specifications. These results indicate that the physical specifications of the building significantly influence the use of the library. It means the physical specifications of the building becomes imperative matter that must be considered to improve the use of the library. Physical specifications in the planning of the building includes capacity of the room, room layout, furniture, garden, car parking, lobby building, public facilities (cafes, public telephones, toilets, etc.), and access for people with disabilities and physical limitations. The convenient place of the library will attract more resident to use it.
Operations. This study proved that the library operations have a significant impact on the use of the library. This suggests that the better operation of the library, it will increase the use of the library. Therefore, the indicators that should be considered for operational support are; time of service, types of services including Internet access, rules of usage, collection according to user requirements, system retrieval collections, and programs or events offered by the public library.
5.3 Motivation and Demographic characteristics
6. CONCLUSIONS
The results proved that the motivation affect the use of the library. This indicates that the higher the user’s motivation, the higher the use of the library. It has a role in the increased use of the library. Motivation can be built either by intrinsic and extrinsic way. This supports a study by Berg (2009) concerning the encouragement to use the library which drived from a desire within ourselves such as motivation to read and write and need to be independent. The results proved that the demographic characteristics is not significant to the use of the public library. Demographic characteristics include users’ age, education, gender, economic level, language proficiency, disability, ethnicity, religion and race. It does not support the studies that have been conducted in developed countries where demographic factors significantly influence the use of the library (Koonzt, 1992). This likely due to the distinct conditions of population demographics such as problems of language, race and religion. In summary, the initiative to improve the use of public library is critical to build and enhance quality of human resources. The stakeholders must considered the above factors to put in the regional planning, need to anticipate the constraints, seek continous committment.
7. ACKNOWLEDGEMENTS
This study is dedicated to the University of North Sumatra that has been providing assistance funding for this research.
REFERENCES
Alaqeeli, Jamal Abdullah (1996), International students and public library use: An exploratory study. PhD Dissertation, Indiana University.
American Library Association (1956), Coordinating Committee on Revision of Public Library Standards, Public library standards: A guide to evaluation with minimum standards. American Library Association, Chicago.
Antunes and Bigotte. (2003). Comprehensive Public Facility Location Modeling, available at <http://www.esnips.com/doc/19f4d27f-f951-4772-834a-1fa017193351/
comprehensive-public-facility-location-modeling> (accessed on September 17, 2008).
Bennet, William D. and Bruce W. Smith (1975), The correlates of library patronage distance decay, East Lakes Geographer 10.
Berg, Margaret A. (2009), Motivation and discourse in a literate environment: A case study of a young adult library. PhD Dissertation, Faculty of the Graduate School, University of Kansas.
Bentler, P.M., Bonett, D.G. (1980), Significance tests and goodness of fit in the analysis of covariance structures, Psychol. Bull, 88, pp. 588−606.
Calcuttawala, Z. (2004), Knowledge stores: The spatial dynamics of public library accessibility and consumption in Calcutta, PhD Dissertation, University of Cincinnati.
Church, R. L. and C. S. ReVelle (1976), Theoretical and computational links between the p-median location set-covering and the maximal covering location problem, Geographical Analysis, 8, pp. 406-415.
Coughlin, R. E. (1972), Urban Analysis for branch library system planning, Greenwood Publishing, Connecticut.
Current, J., H. Min, and D. Schilling (1990), Multiobjective analysis of facility location decisions, European Journal of Operational Research, 49. pp. 295-307.
Daskin, Mark S. and Owen, S. H. (1998), Strategic facility location: A review, European Journal of Operational Research, 111, pp. 423-447.
Dear, M. J. (1974), A paradigm for public facility location theory, Antipode, 6(3), pp. 46-50. Drezner, Z. and G. O. Welowsky (1991), Facility location when demand is time dependent”,
Naval Research Logistics, 38, pp. 763-777.
Forde, Janet Lynch (1996), A study of reading and library use among Nobel Laureates, PhD Dissertation, Florida State University.
Getz, M. (1978). The efficient level of public library services. Working Paper No. 55 (October).The Joint Center for Urban Studies of M. I. T. and Harvard University Hair, et. al (1998), Multivariate data analysis, New Jersey, Prentice Hall.
Harvey, D. (1973), Social justice and the city, Maryland, John Hopkins University Press. Japzon, Andrea C. and Hongmian Gong (2005), A neighborhood analysis of public library use
in New York City, Library Quarterly, 75(4), pp. 446-463.
Kim, J.O. and Mueller, C.W. (1978), Factor Analysis: Statistical Methods and Practical Issues, pp. 14. Sage Publications, Thousand Oaks, CA.
Koontz, Christine M. (1992), “Public library site evaluation and location: past and present market-based modelling tools for the future”, Library and Information Science Research, 14, pp. 379-409.
Koontz, Christine M. (1994), Chapter 10: Retail location theory: Can it help solve the public library location dilemma? In Geiner, J. M. (Ed.), Research Issues in Public Librarianship, Westport, Greenwood Press.
Koontz, Christine M. (1997), Library facility siting and location handbook. Greenwood Press, Westport
Krejcie, R. V. and D. W. Morgan (1970), “Determining sample size for research activities”, Educational and Psychological Measurement, 30, pp. 607-610.
Larson, R. C. (1974), A hypercube queuing model for facility location and redistricting in urban emergency services, Computers and Operations Research, 1. pp. 67-95.
Lovato-Gassman, B. (2007), The physical community college library: A single institution study of the relationship between user satisfaction and library use, PhD Dissertation, New Mexico State University.
Manne, A. S. (1961), Capacity expansion and probabilistic growth, Econometrica, 29(4), pp. 632-649.
Marianov, Vladimir and Daniel Serra (2004). New trends in public facility location modeling, available at www.econ.upf.edu/docs/papers/downloads/755.pdf> (accessed on April 12, 2008).
Mobasheri, F., L. H. Orren, and F. P. Sioshansi. (1989), Scenario planning at Southern California Edison, Interfaces, 19(5), pp. 31-44.
National Library Board Singapore (2008), available at www.nlb.gov.sg> (accessed November 25, 2008).
Palmer, E. Susan (1981), The effect of distance on public library use: A literature survey, Library Research, 3. pp. 66-80
ReVelle and Eiselt (2005), Location analysis: A synthetis and survey, European Journal of Operational Research, 165. pp. 43-52
Scott, A. J. (1991), “Dynamic location-allocation systems: some basic planning strategies”, Environment and Planning, 3. pp. 73-82.
Sugiyono (2002), Method of Administration, 8th Edition. Bandung, Alfabeta Publisher. Sweeney, D. J. and R. L. Tatham (1976), An improved long-run model for multiple
warehouse location, Management Science, 22(7), pp. 748-758.
Truelove M. (1993), “Measurement of spatial equity”, Environment and Planning: Government and Policy, 11, pp. 19-34.
Welowsky, G. O. and W. G. Truscott (1976), The multiperiod location-allocation problem with relocation of facilities, Management Science, 22(1), pp. 57-65.