EPR investigation on spin flips satellite lines of trapped
hydrogen atoms in solids H
2Frida U. Ermawati
Physics Dept. Surabaya State University, Surabaya INDONESIA Email: [email protected]
Abstract
Electron paramagnetic resonance (EPR) spectra of H atoms, produced in γ-irradiated solid H2, were
studied at 4.2 K. Two main lines of the EPR spectra of H atoms that are separated by about 500 G accompanied two weak satellite lines. Both satellite lines and main lines decrease with the same decay rate. In the D2−H2 mixtures, the satellite-line intensity depends upon the number of matrix protons. The
spacing of the satellites from the main line is equal to that of the nuclear magnetic resonance (NMR) proton resonance frequency. It was concluded that the satellite lines were not ascribable to paired atoms but to spin flip lines due to an interaction of H atoms with matrix protons. The analysis of the spin flip lines and the main line suggests that H atoms in solid H2 are trapped in the substitutional site. Key words: spin flip, satellite lines, solid hydrogen, trapped hydrogen atoms, matrix protons,
substitutional sites.
1. Introduction
It is well-known that electron paramagnetic resonance (EPR) spectra of trapped hydrogen atoms, produced by the radiolysis of acid ice at low temperatures, show spin flip satellite lines. Knowledge on the trapping site of the H atoms was, long time ago, (see for example: Trammel,
et al. 1958; Kohnlein and Venable, 1967; Sprague, et al., 1973; Bowman, et al., 1975;
Bales and Lesin, 1976; Kevan, and Plonka, 1977; Ohno, 1978; Plonka and Bogus, 1980; Hase and Higashimura, 1986), obtained in terms of the analysis of the EPR spin flip satellite lines. The studies on EPR spin flip lines of trapped H atoms above, however, are limited only to a matrix of acid ice. In the present study, more than twenty years thereafter, the author has observed the EPR spin flip satellite lines of H atoms in solid hydrogen (H2) at 4.2 K. This
observation will give us new information on trapping sites of H atoms in solid H2.
Information of trapping sites of H atoms in solid H2, which reflect a distance between a H
atom and neighboring H2 molecules, is very
important for elucidating of the tunneling H2 + H
reactions. Further, since solid H2 is a
well-known quantum solid, H atoms in solid H2 can
be considered as quantum particles in a quantum solid. Thus, trapping of the H atoms in solid H2 invokes interesting problems in
low-temperature physics.
2. Experiment
More than 99.99 mol % pure of H2
(hydrogen) was used. Hydrogen was sealed in a sample tube and solidified by rapid cooling from room temperature to 4.2 K. The sample in a cryostat was then irradiated at 4.2 K with γ
-rays from a 137Cs source, available at Monash University. The intended irradiation dose was 1 kGy. Other samples, extracted from 99.5 mol % pure of D2, were also examined, namely, the
mixtures of a (1 mol %) D2-H2 and a D2-H2 (50
mol %). The two samples were γ-irradiated to 4 and 1 kGy, respectively.
When a sample is γ-irradiated at 4.2 K, H atoms are produced in significant amounts, both in the sample tube and the cryostat. EPR spectra of the H atoms in the sample tube and satellite lines of theEPR spectra of the H atoms in solid H2 overlap each other. In order to
suppress the formation of the H atoms in a sample tube, it is therefore, in this experiment, the sample tube and the cryostat were made of special fused silica ‘T2230’, obtained from the Toshiba Ceramic Co., which contains OH bonds at 5-ppm. The yield of H atoms in the radiolysis of silica T2230 was approximately 1/200 of that in silica Spectrosil. Thus, the author has succeeded in diminishing the H atoms yield due to the irradiated silica and obtained a clear EPR spectrum of H atoms produced in solid hydrogen.
3. Results and Discussion
The EPR spectrum of H atoms, produced by γ-radiolysis of solid H2, consists of the low-
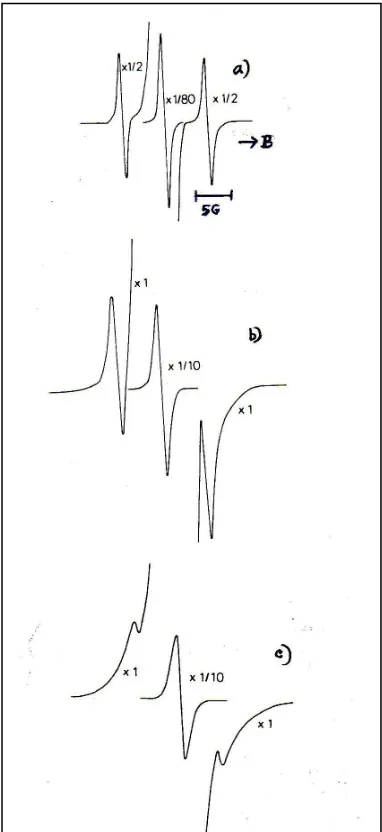
and high-field main spectra separated by about 500 G. Each main line accompanied by two satellite lines that were able to be observed at high-microwave-power levels above 0.4 µW. Figure 1 shows the low-field components of the EPR spectra of H atoms produced in γ -irradiated: (a) H2, D2−H2 (50 mol %) mixture,
and (c) D2−H2 (1 mol %) mixture matrices at 4.2
K. Since EPR spectrum of H atoms in solid hydrogen is very sharp, the spectrum can be observed clearly at a low microwave power of 0.001µW. The line shapes of the main and the satellite spectra of H atoms in solid H2 fitted to
Lorenztian rather than Gaussian shapes. Figure 2 shows the microwave power saturation behavior of trapped H atoms produced by γ-radiolysis of H2 at 4.2 K. The
main lines (Hmain), denoted by circles, begin to
saturate at a microwave power of about 0.005 µW, while the satellite lines (Hsatellite), denoted
by triangles, begin to saturate at a power of about 2 µW.
Further, when the sample of γ-irradiated solid H2 was illuminated with a tungsten lamp,
the amounts of H atoms decreased. This is probably due to a slight increase of the temperature of the sample by illumination. The decay of the main and satellite lines caused by the illumination and the intensity ratios of the satellite line to that of the main line are plotted in Figure 3.
Error!
Fig.1: Low-field component of EPR
spectra of H atoms, produced by γ -radiolysis of solid hydrogen at 4.2 K: (a) H atoms in the irradiated H2
measured at a µwave power level 1µW; (b) H atoms in the irradiated D2−H2 (50 mol %) mixture (the central
main peak and the satellite peaks were
measured at 0.001 and 1µW,
respectively); (c) H atoms in the irradiated D2−H2 (1 mol %) mixture (the
3.1 Identification of the satellite lines.
Toriyama et al., (1979) interpreted the
satellite structure of EPR spectra of H (or D) atoms found in the γ-irradiated solid CH4 (CD4)
in terms of paired radicals. In this work, there are two possibilities for interpretation of the satellite lines in Figure 1a: One is that the
satellite lines are due to paired H atoms, while the main line is due to isolated H atoms. The other is that the satellite lines are the spin-flip lines due to a dipole-dipole interaction of H atoms with matrix protons. The latter interpretation is more plausible for the satellite lines observed for H atoms in solid H2 by the
following reasons.
First, when the γ-irradiated solid H2 is
illuminated by a tungsten lamp, the amounts of H atoms decrease by a recombination reaction, caused probably by a slight increase of temperature. Figure 3 shows the amounts of the H atoms upon the illumination. Both satellite peaks and a main peak decrease with the same decay rate. If the main and satellite spectra are due to different H atoms, that is, isolated H atoms and paired H atoms, the decay rates of the two H atoms must be different upon illumination. This may result in a change of the Hsatellite/Hmain ratio during the decay of H atoms.
The constant ratio in Fig. 3 indicates that the EPR spectrum is due to the same kind of H atoms that accompanies spin-flip lines.
Second, the intensity of spin-flip lines
depends upon the number of matrix protons as given in Eq.1 (in the next subsection). The main and satellite lines of H atoms in the D2−H2 (50
mol%) mixture and the D2−H2 (1 mol %) mixture,
shown in parts b and c of Fig.1, do not show any microwave power saturation at the microwave power levels of 0.001 µW for Hmain and 1 µW for
Hsatellite. Thus, one can directly compare the
intensity of the satellite lines. It follows that the satellite lines appear clearly in the D2−H2 (50
mol %) mixture but that their intensity is very weak in the D2−H2 (1 mol %) mixture. The
remarkable dependence of the satellite-line intensity upon the number of matrix protons indicates that the satellite peaks are due to matrix proton spin-flip lines.
Third, if the satellite lines are due to the
spin flip of matrix protons, the separation between the main and satellite lines is approximately given by gNβNB where gN and βN
are nuclear g factor and magneton, respectively,
and B is the applied magnetic field. Thus,
separation between the main and satellite lines for H atoms in solid H2 is expected as about 5.0
G, while the separation for D atoms in solid D2 is
about 0.76 G. As shown in Fig.1a, an experimental value of the separation between the main and satellite lines for H atoms in solid H2 is about 5 G, which coincides with the
theoretical value (5.0 G). In the EPR spectra of D atoms in the γ-irradiated solid D2 at 4.2 K,
satellite lines could not be observed. Since the separation between the main and satellite lines for D atoms in solid D2 is expected as only 0.76
G, the main and satellite lines of D atoms may overlap each other, making observation of satellite lines impossible.
Fig.2: Microwave power saturation
behavior of H atoms produced by γ -radiolysis of H2 at 4.2 K: (О) main peak
(Hmain); (∆) satellite peak (Hsatellite).
Fig.3: Decay of H atoms caused by a tungsten (W) lamp illumination of γ -irradiated H2 at 4.2 K. The initial amounts
of a main peak (О) and a satellite peak
(□) are normalized to 1.0. ∆ is the ratio of
Fourth, spin-flip lines due to matrix protons
are caused by a spin-forbidden transition, while the main line is caused by the allowed transition. Thus, if the satellite lines are spin flip lines, the microwave saturation behavior of the satellite lines may be different from that of the main peaks. As shown in Fig.2, the satellite lines begin to saturate at 2 µW, while the main lines have already saturated above 0.005 µW. This different saturation behavior may be relevant to the different type of transitions between the satellite lines and the main lines.
Fifth, if paired atoms exist in the γ-irradiated
solid H2, EPR spectra of ∆Ms = ±2 transition
should be observed at a half-field resonance position. The ∆Ms = ±2 transition signals from
the paired atoms, however, could not be detected under the condition of high sensitivity of the spectrometer.
Therefore, it is concluded that the satellite lines shown in Fig.1 are the spin flip lines due to the interaction of H atoms with nearby matrix protons. Since EPR spin flip lines of trapped H atoms have been reported only in acid ice, the present observation of spin flip lines of H atoms in solid H2 is a new example in addition to the
acid ice matrix.
3.2 Trapping site of H atoms in solid H2.
Knowledge on the trapping site of the H atoms has been obtained previously in terms of the analyses of the EPR spin flip satellite lines (Trammel, et al., 1958; Bowman et al., 1975;
Bales and Lesin, 1976; Plonka and Bogus, 1980; Hase and Higashimura, 1986; Bales, et al., 1975). The analyses above can be classified
into three main types: (1) method of Trammel et al. (1958) in which the intensity ratio of the
satellite to the main line was used to estimate an average distance to the nearest-neighbor matrix protons once a number of them is assumed; (2) method of Bowman et al. (1975) in
which energy separation of the satellite from the main line was analyzed to determine an unique distance to the nearest-neighbor matrix protons; and (3) method of Bales et al.(1975 and 1976), in which the second and the first moment of the spin flip satellite with respect to the main line was analyzed by combining the other methods. This allowed one to independently determine the number of the nearest-neighbor protons and the distance to them.
Briefly, in both methods 2 and 3, the key quantity was energy deviation (d-N/2), where d
is the energy separation of the satellite from the main line and N/2 = gNβNB. Unfortunately, it is not easy to perform experiments at 4.2 K to get a desired value of (d-N/2), so that one cannot
ratio of the satellite line intensity (Is) to the main
line intensity (2Im), by the following relation given
by Trammel et al(1958), which expresses the linear relation between the peak intensities and roots of the microwave power (see Fig.2). The average distance (<r>n),
obtained from Eq.1 by use of the experimental ratio (Is/2Im), are 3.6-4.0 Å, if the effective
number of protons (n) is taken as 1 and 2.
The crystalline structure of solid H2 at 4.2 K
is a hexagonal closest packed (hcp) structure. If
it is assumed that H atoms are trapped in the crystal, the distance between the nearest protons and a trapped H atom can be calculated from the structure. The distances for three trapping sites are 3.4 Å for a substitutional site, 2.3 Å for an interstitial octahedral site, and 1.9 Å for an interstitial tetrahedral site. The effective distances (3.6-4.0 Å), obtained experimentally, are roughly similar to the distance (3.4 Å) for the substitutional. This work is the first study of trapping site of H atoms in solid hydrogen, and thus information on trapping sites of H atoms in solid hydrogen is too scanty to decide the precise structure of the trapping sites.
4. Conclusion
To end up, the author has pointed out several problems for elucidation of the trapping sites of H atoms in solid hydrogen. First, normal
H2 used here consists of 25 % para H2, whose
rotational quantum number is zero at 4.2 K, and 75 % ortho H2, whose rotational quantum
number is 1. When a H2 molecule orients its
molecular axis to a trapped H atom, the distance between the trapped H atom and the proton of the H2 molecule becomes the nearest. It is
tentatively assumed here that only one or two H2
molecules orient their molecular axes to the trapped H atom. The orientation of para H2 and
ortho H2 molecules near the trapping site may
be an important factor for analysis of EPR spin flip lines.
Second, solid hydrogen, a well-known
pushed away, resulting in the distortion of the lattice. The possibility of local distortion near the trapped H atom must be studied in the future.
Third, a H atom in a H2 molecule changes
its position by about 30% of its equilibrium atomic separation (0.74 Å) because of its high zero-point energy of vibration. The large variation of its position must be considered for analysis of EPR spin flip lines.
Fourth, it is necessary to determine independently the number and distance of adjacent protons by the methods 2 and 3, mentioned above.
Fifth, H atoms, produced by decomposition
of H2, may be trapped initially in both interstitial
and substantial sites. According to the previous studies (Miyazaki, et al., 1988 and Miyazaki, et al., 1984), H atoms migrate through solid
hydrogen by repetition of the tunneling reaction H2 + H → H + H2. A H atom, produced initially
by decomposition, reacts fast with a neighboring H2, molecule in a lattice by quantum mechanical
tunneling. Then, the tunneling reaction H2 + H → H + H2 leaves the product H atom in the
lattice site, which is a substitutional site. If the tunneling reaction H2 + H → H + H2 is repeated,
almost all of H atoms may be found in the substitutional site. It is an interesting problem to correlate the trapping site of H atoms with the tunneling reaction in the solid hydrogen.
5. Acknowledgement
The author thank to Prof. Emeritus J.R. Pilbrow and the group of Magnetic Resonance,
Monash University for fruitful discussion on the results.
6. References
Trammel, G.T.; Zeldes, H.; Livingston, R. Phys. Rev. 1958, 110, 630.
Kohnlein, W.; Venable, J.H. Nature, 1967, 215,
619.
Sprague, E.D.; Schulte-Frohlinde, D. J. Phys. Chem. 1973, 77, 1222.
Bowman, M.; Kevan, L.; Schwartz, R.N. Chem. Phys. Lett. 1975, 30, 208.
Bales, B.L.; Lesin, E.S. J. Chem. Phys. 1976,
65, 1299.
Kevan, L.; Plonka, A. J. Phys. Chem. 1977, 81,
963.
Ohno, K. Radiat. Phys. Chem. 1978, 12, 83.
Plonka, A.; Bogus, W. Radiat. Phys. Chem.
1980, 16, 365.
Hase, H.; Higashimura, T. Radiat. Phys. Chem.
1986, 27, 385.
Miyazaki, T.; Azuma, N.; Yoshida, S. and Fueki, K. Radiat. Phys. Chem. 1988, 32, 695.
Toriyama, K.; Iwasaki, M.; Nunome, K. J. Chem. Phys. 1979, 71, 1698.
Bales, B.L.; Bowman, M.K.; Kevan, L.; Schwartz, R.N. J. Chem. Phys. 1975, 63,
3008.