Study of Water Quality at West Sunter Reservoir, North Jakarta Based on Physical and Chemical Parameters Hakim, Iswanto, Lindu p-ISSN 2579-9150; e-ISSN 2579-9207, Volume 1, Number 1, pp 16 – 36, October 2017
STUDY OF WATER QUALITY AT WEST SUNTER RESERVOIR, NORTH
JAKARTA BASED ON PHYSICAL AND CHEMICAL PARAMETERS
Muthia Fitriana Hakim, Bambang Iswato, Muhammad Lindu*
Environmental Engineering, Faculty of Landscape Architecture and Environmental Engineering Universitas Trisakti, Jakarta, 11440, Indonesia
*Corresponding author: [email protected]
ABSTRACT
Aim: This study is to determine effect of contamination level of population settlement activity on water quality in the reservoir at west Sunter by measurements of reservoir water quality in the form of physical and chemical parameters including the identification of the kinetics of COD. Methodology and Result: This research was conducted in April to August 2016 with 11 sampling locations. Research indicated that the reservoir had experienced heavy pollution with DO value ranging between 1.05 mg/L-1.52 mg/L with a minimum quality standard of 3 mg/L, Ammonia 0.13 mg/L-0.38 mg/L with a quality standard of 0.02 mg/L, surfactant (1.74 mg/L-4.63 mg/L) quality standard of 0.2 mg/L and phosphate (0.8 mg/L-1:19 mg/L) to the quality standard of 1 mg/L. Reservoir also were polluted with heavy loads inclusion of organic content with COD values ranging between 112.58 mg/L - 196.39 mg/L. The source of pollution in the west Sunter reservoir was derived from domestic sewage. Based on the average constant value it takes 16.96 hours to reduce the COD from 120 mg/L to 40 mg/L. Natural Retention time at West Sunter Reservoir is 13.6 days. Conclusion, significance and impact study: Domestic waste has obviously contaminated West Sunter reservoir from its physically green color, high organic content with high COD values, low DO, high oil and fat content, and high phosphate levels. These polluted compounds must be removed before spreading to the next water body. If the reservoir is considered as a reactor site, then the reservoir must be able to remove the contaminants before disposal.
1.
INTRODUCTION
The research was conducted at West Sunter Reservoir located in Sunter, Sunter Jaya subdistrict,
Tanjung Priok sub district, North Jakarta, has an area of 18.85 Ha. The water volume on
reservoir in April was 1,244,000 m3, while the volume in May was 735,150 m3. The reservoir is
known having important functions including catchment areas, flood mitigation, irrigation,
recreation, reservoirs, fisheries, and supporting marine biodiversity. The water source of West
Sunter Reservoir came from drainage, residential and shopping complexes, while the outlet is
flowed to the Muara River. Varied activities at surrounding area such as shops, markets,
settlements, and schools contributed pollution into the reservoir. The implication of the activity
around the reservoir disrupted urban ecological balance in the form of green and foul-smelling
waters. Therefore, it was necessary to measure the water quality of the reservoir by using
physical and chemical parameters to determine the level of pollution from surrounding
activities to water quality at West Sunter Reservoir, North Jakarta. Municipal waste comprises of
domestic waste (households) with the addition of commercial waste but generally without
industrial hazardous waste and domestic sewage sludge. The domestic waste contained
inorganic materials such as plastic, paper, while organic waste was from food scraps, vegetables
and fruits (Bichi, 2013). Dissolved oxygen is an important parameter in the assessment of water
quality and biological processes commonly occur in water. The value of DO indicates the level of
pollution in the water body. DO presence improves acceptable water quality. The relative value
of DO for water quality standards is 5 mg/L (Alobaidy, 2010). While the value of COD for good
water quality of 26 mg/L (Naubi, 2016).
2.
RESEARCH METHODOLOGY
2.1
Sampling Method
The method applied in this research was the momentary method (Grab). Water sampling was
obtained from 11 (eleven) observation points conducted by using Water Sampler at depth ½ - ⅔
from water depth at observation point. Water samples from each observation point were then
kept in bottles and stored in the cooler box filled with ice cubes. It will inhibit the reaction rate
occurring in water samples due to the activity of microorganisms and chemical reactions that
Study of Water Quality at West Sunter Reservoir, North Jakarta Based on Physical and Chemical Parameters Hakim, Iswanto, Lindu p-ISSN 2579-9150; e-ISSN 2579-9207, Volume 1, Number 1, pp 16 – 36, October 2017
Subsequently the sample was then delivered Environmental Laboratory, Universitas Trisakti, for
measurement purpose.
2.2
Analysis Method
The data gathered was analyzed to study carefully the process of water quality change at West
Sunter Reservoir and compared to the Quality Standard Guidelines based on Indonesia
Government Regulation No. 82 Year 2001 class 3 on Water Quality Management and Water
Pollution Control to conclude the quality level of West Sunter Reservoir. The parameters and
methods used are listed on Table 1.
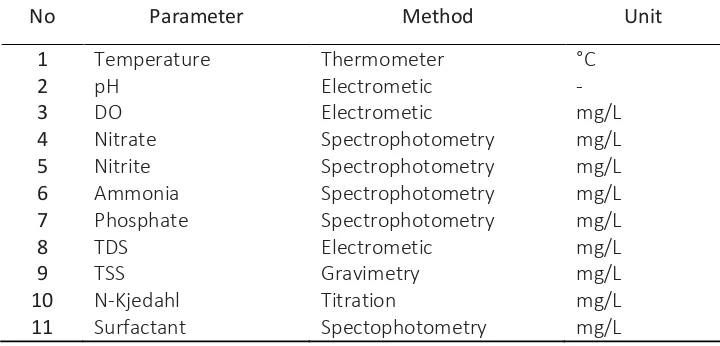
Table 1 Parameters and methods of measurement
No Parameter Method Unit
1 Temperature Thermometer °C
2 pH Electrometic -
3 DO Electrometic mg/L
4 Nitrate Spectrophotometry mg/L
5 Nitrite Spectrophotometry mg/L
6 Ammonia Spectrophotometry mg/L
7 Phosphate Spectrophotometry mg/L
8 TDS Electrometic mg/L
9 TSS Gravimetry mg/L
10 N-Kjedahl Titration mg/L
11 Surfactant Spectophotometry mg/L
3.
RESULTS AND DISCUSSION
3.1
Surface Water Quality of West Sunter Reservoir
The results of the surface water quality measurement of West Sunter Reservoir based on the
calculation and discussion of the parameters observed at each point as much as six times as
seen on Table 2. The following shows the surface quality of physical water and water chemistry
in the West Sunter reservoir. In general, the water surface condition of the West Sunter
Reservoir can be quite bad, as result described from the measurement of water quality
parameters points out most of the value exceeds the specified quality standard.
The existence of several parameters whose value above the quality standard caused by
3.1.1
Temperature
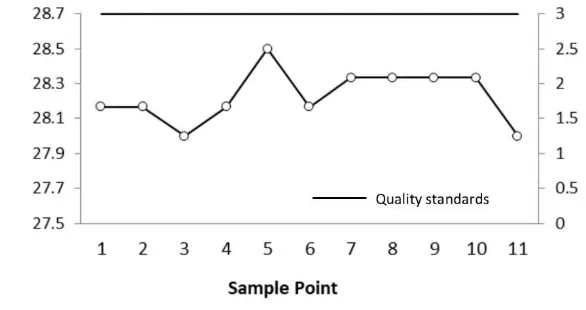
Figure 1 shows surface temperature. According to the observation results, the average
temperature obtained was relatively similar between 28°C - 28.5°C still within normal limits.
While the highest temperature was obtained at point 5, which was equal to 28.50 °C and the
lowest average temperature is at point 11.
Figure 1 Surface temperature of West Sunter reservoir
3.1.2
pH
Figure 2 shows the pH at the water level in West Sunter Reservoir is relatively not much
different at each point. The average pH concentration value was generated from sampling in
April-May, ranging from 7.17-7.46. The highest mean pH concentration value is at point 11
which is at the middle zone of the water and the lowest pH is at point 7 that is 7.17. These
polluted river flow figures still not endanger microorganisms that function in decomposing the
pollutant load to live. The water concentration pH of this West Sunter reservoir still meets the
Study of Water Quality at West Sunter Reservoir, North Jakarta Based on Physical and Chemical Parameters Hakim, Iswanto, Lindu p-ISSN 2579-9150; e-ISSN 2579-9207, Volume 1, Number 1, pp 16 – 36, October 2017
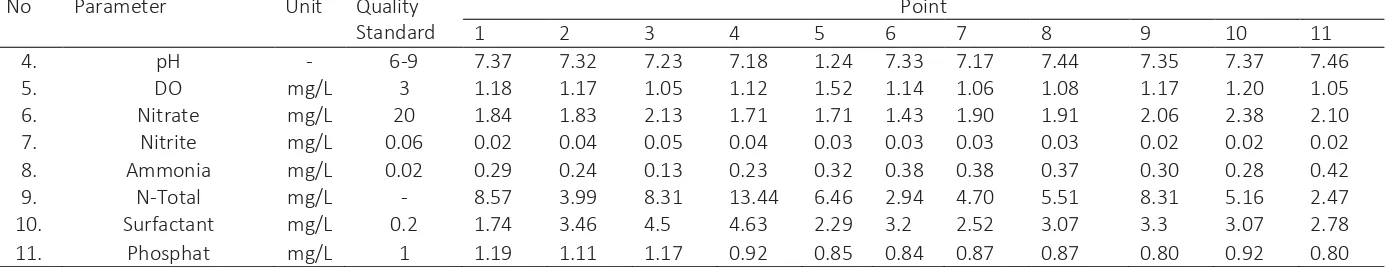
Table 2 Surface water quality of West Sunter reservoir
A.
Physical Parameter
No Parameter Unit Quality
Standard
Point
1 2 3 4 5 6 7 8 9 10 11
1. Temperature °C ± 3°C 28 28 28 28 28 28.1 28 28 28 28 28
2. TSS mg/L 400 75.17 36.50 39.33 42.50 51.67 58.67 37 58 105 36.67 89
3. TDS mg/L 1000 565.67 492.67 628.83 872.83 523.5 352 522.67 512.50 577.67 497.67 508.67
B.
Chemical Parameter
No Parameter Unit Quality
Standard
Point
1 2 3 4 5 6 7 8 9 10 11
4. pH - 6-9 7.37 7.32 7.23 7.18 1.24 7.33 7.17 7.44 7.35 7.37 7.46
5. DO mg/L 3 1.18 1.17 1.05 1.12 1.52 1.14 1.06 1.08 1.17 1.20 1.05
6. Nitrate mg/L 20 1.84 1.83 2.13 1.71 1.71 1.43 1.90 1.91 2.06 2.38 2.10
7. Nitrite mg/L 0.06 0.02 0.04 0.05 0.04 0.03 0.03 0.03 0.03 0.02 0.02 0.02
8. Ammonia mg/L 0.02 0.29 0.24 0.13 0.23 0.32 0.38 0.38 0.37 0.30 0.28 0.42
9. N-Total mg/L - 8.57 3.99 8.31 13.44 6.46 2.94 4.70 5.51 8.31 5.16 2.47
10. Surfactant mg/L 0.2 1.74 3.46 4.5 4.63 2.29 3.2 2.52 3.07 3.3 3.07 2.78
Figure 2 pH concentration of West Sunter Reservoir
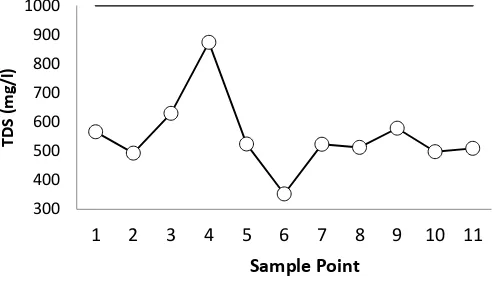
3.1.3
Total Disolved Solid (TDS)
The average TDS values gained from measurements across the sampling points in the West
Sunter Reservoir water range from 352.00 mg/L - 872.83 mg/L, taken from April to May, as can
be seen in Figure 3. The highest average TDS concentration was present at point 4 of 872.83
mg/L. High TDS levels was due to the dissociation of dissolved ions which could be derived from
the substantial water use from groundwater source containing high salinity, or other activities
that used high salt water in the area around the dam from a small industry, such as fermented
soy bean factory, milkfish ponds, which allegedly used water for the washing process. While the
lowest average TDS concentration was at point 6 of 352 mg/L.
Figure 3 TDS concentration of West Sunter Reservoir 5
Sample Point Max Line pH Min Line
Study of Water Quality at West Sunter Reservoir, North Jakarta Based on Physical and Chemical Parameters Hakim, Iswanto, Lindu p-ISSN 2579-9150; e-ISSN 2579-9207, Volume 1, Number 1, pp 16 – 36, October 2017
According to Paul (2012), TDS values are high due to salt water contamination and industrial
pollution. The content of TDS in West Sunter Reservoir was still below standard quality standard
of PP. 82 Year 2001 that is 1000 mg/L.
3.1.4
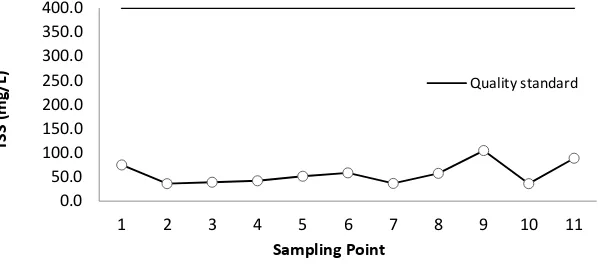
Total Suspended Solid (TSS)
The concentration of TSS in West Sunter Reservoir was very fluctuating, as shown in Figure 4.
The mean value of TSS range was from 36.6 mg/L - 105 mg/L. The highest value was 105 mg/L at
point 9 while the lowest value was at point 2 of 36.5 mg/L, acquired from an inlet zone that
came from settlements and mosques. TSS had a high organic contents, decay in the reservoir
can deplete dissolved oxygen in water and result in oxygen deprivation which potentially cause
deadly fish during low flow conditions (Bilotta, 2008).
Physical changes caused by TSS can reduce light penetration, temperature changes, and full
channel when solids reservoir settled, also can reduce the longevity of dams or reservoirs. The
low TSS value is estimated, since deposition has occurred at point 2 as well as the largest inlet
point, so it has a slow water velocity. Paul and Sen (2012) states that in waters with weak
currents, the particle precipitated to the bottom of the water is a small particle size. The high
concentrations of TSS at point 9 are thought to be caused by currents. In addition, land use
along the reservoir is a shrub. This type of land use allows the erosion of suspense-sized soil
particles to enter the reservoir and increases the concentration of suspended solids in the
reservoir waters. This is caused by the input of soil particles from the side of the eroded
reservoir, and the high reflection of solar radiation in the dry season. The increase in TSS
concentration indicates a decrease in water quality in West Sunter Reservoir. According to PP.
82 Year 2001 suspended solids content at West Sunter Reservoir is still below the established
Figure 4 TSS concentration of West Sunter reservoir
3.1.5
DO
As shown on Figure 5 the value of DO obtained from point 1 - point 11 is below the standard for
desirable waters, DO values range is from 1.05-1.52 mg/L. It suggests that the water is anoxic or
in other words the conditions under which the compounds will form are reduced and created
anoxic gases, such as sulfides. Starting from the inlet as well as in the middle of the reservoir, on
the edge and the whole point shows the value of DO nothing above 2 ppm, all conditions are
anaerobic. This is ascertained that fishes are normally difficult to live, because normally aquatic
animals can live on DO 5 ppm (Alobaidy, 2010). DO low condition probably caused by high
organic content so that the process of respiration faster than diffusion.
Based on observations, fish that could live in water with a small DO value condition, namely
catfish. DO levels at point 5 are high enough, the recovery is relatively better because of the
outlet position. Overall, the DO content in West Sunter Reservoir Waters is below the minimum
Study of Water Quality at West Sunter Reservoir, North Jakarta Based on Physical and Chemical Parameters Hakim, Iswanto, Lindu p-ISSN 2579-9150; e-ISSN 2579-9207, Volume 1, Number 1, pp 16 – 36, October 2017
Figure 5 DO concentration of West Sunter Reservoir
3.1.6
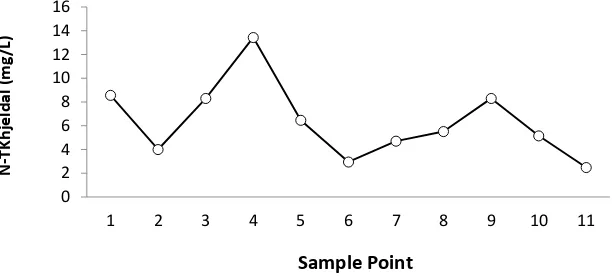
N-Khjeldal
The average N-Khjeldahl value range is from 2.47 mg/L-13.44 mg/L, as shown in Figure 6. Total
nitrogen khjeldahl is the content of organic N and ammonia in the reservoir.
Figure 6 N-Khjedahl concentration of West Sunter Reservoir
This parameter describes how much ammonia and N organic content. Wastewater analysis of
total nitrogen includes a variety of different nitrogen, namely ammonia, nitrite, and nitrate. The
relationships that arise between various forms of nitrogen mixture and the changes occurring in
nature are generally described by the nitrogen cycle. In most wastewater generated from
nitrogen, it is basically present in the form of organic or nitrogen proteins and ammonia. At the
same level, organic nitrogen is converted to ammonia nitrogen, under aerobic condition, the
3.1.7
Ammonia, Nitrite and Nitrate
Ammonia levels range is from 0.13 mg/L - 0.42 mg/L. The highest ammonia is present at
point 11 of 0.42 mg/L, which is the midpoint, whereas the lowest ammonia is at point 3 i.e.
0.13 mg/L, which is the inlet point derived from the slums and market. Then the nitrite level in
the reservoir range is from 0.02 mg/L - 0.05 mg/L. With the highest nitrite content of 0.05 mg/L
exists at point 3 which is the inlet point derived from slum and market settlements, and the
lowest nitrite is 0.02 mg/L at point 1 which is the inlet of the reservoir originating from
settlements and mosques, and at points 9, 10, and 11 midpoints. The highest nitrite content is
present at point 3 of 0.05 mg/L. Ammonia, Nitrite and Nitrate concentration can be seen in
Figure 7 and 8.
Figure 7 Ammonia and Nitrite concentration of West Sunter Reservoir
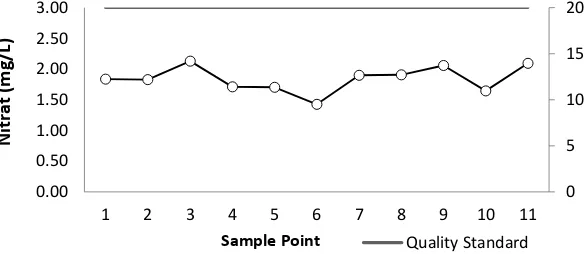
Figure 8 Nitrate concentration of West Sunter reservoir
The value of nitrite based on research (Fitra, 2008), states that the value of nitrite in Lake
Toba ranges from 0.02 mg/L - 0.05 mg/L. While the value of ammonia ranges from 0.09 - 1.63
mg/L. The study results indicate that the ammonia value obtained in the Western Sunter
Ammonia Nitrite Quality Standard Ammonia Quality Standard Nitrite
Study of Water Quality at West Sunter Reservoir, North Jakarta Based on Physical and Chemical Parameters Hakim, Iswanto, Lindu p-ISSN 2579-9150; e-ISSN 2579-9207, Volume 1, Number 1, pp 16 – 36, October 2017
reservoir is quite high, ranging from 0.13 mg/L - 0.42 mg/L, this is due to pollution from
domestic waste, such as waste water from the kitchen and toilet.
It can be seen also in Figure 8 that the nitrate concentration value ranges from 1.43-2.38
mg/L, with the highest nitrate present at point 10 which is 2.38 mg/L. While the lowest nitrate is
at point 6 of 1.43 mg/L which is inlet zone comes from housing and school. Nitrite and nitrate
concentrations that tend to fluctuate indicate a slow denitrification process in the waters of
West Sunter dam. Nitrite concentration values tend to be high, coupled with low nitrate
concentrations and high ammonia. This is allegedly caused by the on-going denitrification
process.
Overall, the nitrite and nitrate levels in the waters of West Sunter Reservoir are still below
the quality standard, while the ammonia content obtained is very high and exceeds the quality
standard set by PP. 82 of 2001 with nitrite content of 0.06 mg/L, nitrate of 20 mg/L, and 0.02
mg/L for ammonia levels.
3.1.8
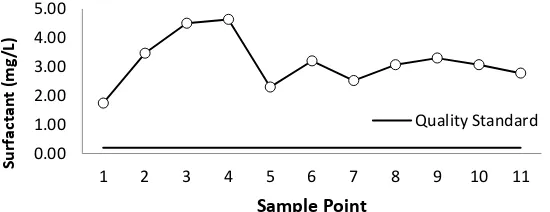
Phosphate and Surfactant as MBAS (Methylene Blue Active Substances)
Figure 9 and 10 shows measurement results of Phosphate and Surfactant concentration.
The results of the analysis of the average phosphate levels on sampling in April-May ranged
from 0.80 mg/L - 1.19 mg/L. Based on Figure 9, it can be seen at point 1, point 2, and point 3
which is the inlet point coming from settlement, market, and mosque. Phosphate levels tend to
highly fluctuate due to the use of detergents from household activities. The use of such
detergents will eventually accelerate increased phosphate concentration in river water resulting
in algae blooming and eutrophication (Karels, 2014). At point 5 - 11 which is the center of the
reservoir, phosphate levels are stable. According to Habib (2015), the phosphate criteria free
from eutrophication, between 0.01-0.03 mg L-1. Overall, the phosphate levels in this West
Sunter Reservoir do not conform to the quality standards established under PP. 82 Year 2001,
which is 1 mg/L.
It can be seen from this study; all sample points have a high concentration of surfactant.
Figure 10 describes the average surfactant content ranges from 1.74 mg/L - 4.63 mg/L. The
highest surfactants are at points 3 and 4 of 4.50 mg/L and 4.63 mg/L, which is an inlet zone
derived from slums, mosques, and markets that contributed to increased wastewater from their
household activities. Most detergents contain polyphosphate as a cleanser, which can easily
lead to eutrophication (Yudi, 2010).
Overall, the concentration of surfactant in West Sunter Reservoir is very high and above the
standard quality standard that has been established based on PP. 82 Year 2001 is 0.2 mg/L.
3.1.9
Change of DO in Waters
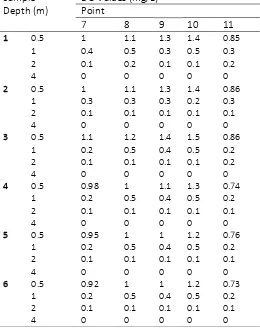
DO concentration changes in the West Sunter Reservoir found at midpoint of sampling can be
Study of Water Quality at West Sunter Reservoir, North Jakarta Based on Physical and Chemical Parameters Hakim, Iswanto, Lindu p-ISSN 2579-9150; e-ISSN 2579-9207, Volume 1, Number 1, pp 16 – 36, October 2017
Table 3 Concentration of DO at the central point of West Sunter reservoir
Sample
concentration value of 0.12 mg/L - 1.16 mg/L. Oxygen measurement level ranges from 0.5 m - 4
m depth and tends to decrease from 1.16 on the surface up to 0 at a depth of 4 m. As a result,
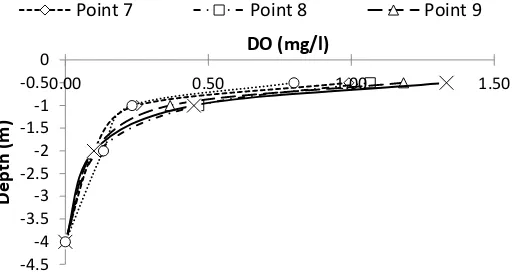
Figure 11 DO concentration of some depth based on time
Figure 12 DO concentration of some depth based on site
It can be seen also from Figure 12 the pattern on each sample point like previous Figure
which is taken in April - May, there is no significant difference and tends to decrease as well. At
point 7 and point 11 DO falls faster because of the organic content is getting higher, with an
average COD value at point 7 of 124.7 mg/L and at point 11 of 133 mg/L.
3.1.10
Oil and Grease
DO value on the surface is small, because oxygen on the surface is blocked by a water-oil
emulsion coating. The results of the analysis show that oil-water emulsions caused by oil
Study of Water Quality at West Sunter Reservoir, North Jakarta Based on Physical and Chemical Parameters Hakim, Iswanto, Lindu p-ISSN 2579-9150; e-ISSN 2579-9207, Volume 1, Number 1, pp 16 – 36, October 2017
Figure 13 Oil and grease of West Sunter Reservoir
The concentration of oil and grease in the waters of the west Sunter basin of 3 samples at
point 4, point 6 and point 11 with values at each point of 2.3 mg/L, 1.8 mg/L, 2.6 mg/L can be
found on Figure 13. It describes the presence of water-oil emulsions will affect anaerobic life in
the bottom of the waters that can determine the value of ammonia. Lacking oxygen supply
minimize nitrate value which in the end causes the rising of ammonia Value. Whatever prevents
O2 and sunlight (U.V) from entering the river fluids such as oil-water emulsion on the river’s
surface results in the absence of O2, anaerobic condition and no photosynthesis.
3.1.11
Alternative Water Quality Control of Reservoir
This research urges to manage or control the water quality of reservoir that has undergone a
process of damage, indicated by heavy pollution due to high organic content with an average
COD value of 112.58 mg/L - 196.39 mg/L, as well as low DO. Nearly all sampling points
throughout sampling during April-May points out none of the DOs meets the requirements for
aquatic life with DO above the minimum above 4 mg/L.
Domestic waste has obviously contaminated West Sunter reservoir from its physically green
color, high organic content with high COD values, low DO, high oil and fat content, and high
phosphate levels. These polluted compounds must be removed before spreading to the next
water body. If the reservoir is considered as a reactor site, then the reservoir must be able to
remove the contaminants before disposal. The way to eliminate it is firstly by determining how
long it takes to remove these pollutant compounds. Then followed by considering how much
pollutant exists and how long it takes to decompose its compounds to determine the speed of
the reaction. These steps have been made by increasing the oxygen content by supplying
4 6 11
Oil & Grease (mg/L) 2.3 1.8 2.6
oxygen and without providing oxygen. The determination of the rate of COD decreases with
time, the result is obtained as shown in Table 4 based on the sample from point 1 and 2 inlet.
It can be concluded as shown on Table 4, water which has been supplied oxygen by the
initial aeration process indicates the process of organic is declining, whereas without aeration it
does not occur.
Table 4 Initial and final concentrations at point 1 & point 2 with aeration
t (time) Point 1 Point 2
correlation of concentration to time, based on Table 5. The reaction speed follows the order of
zero with the average constant value of 4.71774 hours-1. The highest degradation rate or near
1 is at point 4 of 0.8361 mg/L-hour, indicating that organic compounds require faster time to
degrade. It happens because the waste at point 4 that comes from residential area flows
directly in the waste to the dam and still fresh. Since the reservoir is stagnant water, the
decomposition rate will occur more slowly. The existence of a strong wind and capable of
making waves in the waters can assist the degradation process. While most degradation rate is
the smallest in point 1 and point 6 there are still many organic compounds that are difficult to
degrade, that is 0.6703.
Table 5Degradation rate constants with orde 1 and orde 0
Study of Water Quality at West Sunter Reservoir, North Jakarta Based on Physical and Chemical Parameters Hakim, Iswanto, Lindu p-ISSN 2579-9150; e-ISSN 2579-9207, Volume 1, Number 1, pp 16 – 36, October 2017
3.1.12
Hydraulic Retention Time
The Retention time in the waters of the West Sunter Reservoir can be calculated using the batch
reactor formula because west Sunter reservoir is a semi continuous reservoir, where the water
is not flowing, and is channeled using the pump at its outlet. The calculation formula of
Retention time with batch reactor is as follows:
K = 4.7177
K = K average ± Ϭ
K = 4.7177 + 2.3472 = 7.0649
K = 4.7177 – 2.3472 = 2.3705
K value is 7.0649, 2.3705, dan 4.7177.
Retention time formula on batch reactor:
Calculation is as follows:
Co = 120 (Highest initial concentration)
Ct = 40 mg/l (quality standard)
Calculation of Natural Retention Time of West Sunter Reservoir in April:
Qpump = 9.230 m3/hour
Width = 18.85 Ha = 188.500 m
Volume = 1,244,000 m3
Pump operation = 3 hour/day
Pump amount = 1 pump
Q = 9,230 m3/hour x 3 hour/day = 27,690 m3/day
= 1,244,000𝑚3
27,690𝑑𝑎𝑦𝑚3 = 44.9 days = 45 days
Calculation of Natural Retention Time of West Sunter Reservoir in May:
Qpump = 9,230 m3/hours
Width = 18.85 Ha = 188.500 m
Depth = 3.9 m
Volume = 735,150 m3
Pump operation = 3 hour/day
Pump total = 2 pumps
Q = 9,230 m3/hour x 2 pump =18,460 m3/hour
Q = 18,460 m3/hour x 3 hour/day = 55,380 m3/day = 735,150 m3
55,380daym3 = 13.2 days
The calculation results of hydraulic Retention time of each value of K can be seen on Table 6.
Table 6 Hydraulic retention time simulation West Sunter reservoir
Co Ct Co-Ct td (K = 7.0649) td (K = 2.3705) td (K = 4.7177)
120 40 80 11.32 33.75 16.96
110 40 70 9.91 29.53 14.84
100 40 60 8.49 25.31 12.72
90 40 50 7.08 21.09 10.60
80 40 40 5.66 16.87 8.48
70 40 30 4.25 12.66 6.36
60 40 20 2.83 8.44 4.24
50 40 10 1.42 4.22 2.12
Study of Water Quality at West Sunter Reservoir, North Jakarta Based on Physical and Chemical Parameters Hakim, Iswanto, Lindu p-ISSN 2579-9150; e-ISSN 2579-9207, Volume 1, Number 1, pp 16 – 36, October 2017
Coagulation and Activated Carbon
This research not only implemented biological treatment which was done in the previous
experiments, but also conducted trials using coagulation process with the purpose to eliminate
surfactants levels in the reservoir. Coagulation treatment process was done in the following
way: this process was carried out using the sample water from 3 sampling points such as point
4, point 6 and point 11, with initial surfactant concentrations at each point of 6.95 mg/L, 3.26
mg/L and 4.11 mg/L. Coagulation by using PAC coagulant with concentration of 15 ppm in water
sample 200 ml followed by stirring at speed (150 rpm) for 10 minutes. Coagulation by adding
NaOH in the sample then heated. After that, stirring at high speed (150 rpm) for 10 minutes,
then adding PAG coagulant concentration of 15 ppm and stirring again at high speed for 15
minutes.
The alternative treatment applied by using activated carbon on 1000 ml of sample water,
then stirring at slow speed for 60 minutes. After that adding the PAC coagulant and stirring
again with high speed for 1 minute.
Table 7 Results of oil water emulsion processing with surfactants
Sample
surfactant removal results as well as still below the standard of the quality standard of PP. 82
Year 2001 that is equal to 0.2 mg/L. It can be concluded that trials to reduce the emulsion of
2001 is TDS ranged from 352 mg/L - 873 mg/L with standard quality of 1000 mg/L, TSS ranged
from 36.5 mg/L - 105 mg/L with standard quality of 400 mg/L, pH between 7.14 - 7.46 with
Quality standard 6-9. Nitrite value between 0.02 mg/L - 0.05 mg/L with a standard quality of
0.06 mg/L, while nitrate ranged from 1.43 mg/L - 2.38 mg/L with a standard quality of 20 mg/L.
Parameters that do not meet the standard quality standard set by PP. 82 of 2001, among
others, DO ranges from 1.05 mg/L - 1.52 mg/L, it indicates that there are no DO values above 2
ppm, all anaerobic. It is ascertained that fish is normally difficult to live, because normally
aquatic animals can live on DO 5 ppm. Ammonia ranges from 0.13 mg/L - 0.42 mg/L with a
standard quality of 0.02 mg/L, due to pollution from domestic waste. Water supplied with
oxygen by the initial aeration process identified the occurrence of COD decrease with time,
whereas without aeration there is no COD decrease with time. The order of the reaction follows
a zero order with an average value of 4.71774 hours-1. Based on the average constant value, it
takes 16.96 hours to reduce the COD from 120 mg/L to 40 mg/L. Natural retention time at West
Sunter Reservoir is 13.6 days.
5.
REFERENCES
Bichi, M H, and Amatobi, D A. 2013. Characterization of Household Solid Wastes Generated in Sabon-gari Area Kano in Northern Nigeria, American Journal of Research Communication. 1(4):165-171.
Alobaidy, A H M J, Abid, H S, Maulood, B K. 2010. Application of Water Quality Index for Assessment of Dokan Lake Ecosystem, Kurdistan Region, Iraq. Journal of Water Resource
and Protection. 2:792-798.
Naubi, I, Zardari, N H, and Shirazi, S M, Effectiveness of Water Quality Index for Monitoring Malaysian River Water Quality, 2016.
Pemerintah Republik Indonesia, 2001, Peraturan Pemerintah No. 82 Tahun 2001 Tentang Pengelolaan Kualitas Air dan Pengendalian Pencemaran Air, Jakarta.
Paul, M.K, Sen, S. 2012. The Occurrence of TDS and Conductivity of Domestic Water in Lumding Town of Nowgong District of Assam, N.E. India, Current World Environment, 7(2):251-258.
Bilotta, G S, Braizer, R E, Understanding the Influence of Suspended Solids on Water Quality and Aquatic Biota, 2008.
Study of Water Quality at West Sunter Reservoir, North Jakarta Based on Physical and Chemical Parameters Hakim, Iswanto, Lindu p-ISSN 2579-9150; e-ISSN 2579-9207, Volume 1, Number 1, pp 16 – 36, October 2017
Karels, J, and Petnkeu, S N. 2010. Determination of Phosphate, Nitrite, and Sulfate in the Red River by Ion Chromatography. Concordia College Journal of Analytical Chemistry. 1:24-28.
Habib, M A, Hoque, M A, Islam, M S, Islam, M M, Islam, M N. 2015. Phosphate Level in Some Selected Surface and Ground Water Bodies of Rajshahi City Corporation. 8(1).