INAFOR 11G-054
INTERNATIONAL CONFERENCE OF INDONESIAN FORESTRY RESEARCHERS (INAFOR)
Section G Forest Environment and Climate Change
Status of Soil Fertility at Sloping Land Cassava Cultivation in Protected
Area of Mount Muria, Central Java
Dona Octavia
Forestry Research Institute of Surakarta Jl. Ahmad Yani, Pabelan, Surakarta, 57102, INDONESIA
Paper prepared for
The First International Conference of Indonesian Forestry Researchers (INAFOR) Bogor, 5 – 7 December 2011
INAFOR SECRETARIAT
Sub Division of Dissemination, Publication and Library FORESTRY RESEARCH AND DEVELOPMENT AGENCY
480
Status of Soil Fertility at Sloping Land Cassava Cultivation in Protected
Area of Mount Muria, Central Java
Dona Octavia
Forestry Research Institute of Surakarta Jl. Ahmad Yani, Pabelan, Surakarta, 57102, INDONESIA
ABSTRACT
Inappropriate land utilization and management practices that do not consider the aspects of soil conservation will lead into land degradation. The degradation will have implications for increasing critical land inside and outside the forest area. This paper aims to analyze soil fertility at rehabilitation demonstration plots in the protected area of Mount Muria, which is sloping land for cultivation of cassava. Soil sampling conducted in 12 points to represent an area of 5 hectare demonstration plot. The results showed arrays of variation in soil texture that ranges from sandy loam to heavy clay. Soil was classified as slightly acid to acid (pH H2O) which has low organic matter content (< 2%). The soil has low cation exchange capacity and very low nitrogen availability. The land is basically no longer appropriate for cassava cultivation. Several efforts are needed to increase soil fertility and decrease erosion, including planting pioneer trees of legume as green manure as well as applying legumes cover crops and manure.
Keywords: Soil degradation, soil organic matter, land utilization 1. INTRODUCTION
Bare land with no trees and cover crops increase the chances of soil erosion which can ultimately reduce the soil fertility physically, chemically and also biologically. Inappropriate land utilization and management practices without considering the aspects of soil conservation will lead to land degradation. Soil erosion was allegedly increased the extent of degraded land. Critical land in the mountainous region is often found in areas where forests have been damaged, especially the steep sloping areas and poor of cover plant. It generally occurs due to landslides and erosion that result into peeling up of upper soil layers and often opened up the layers into a rocky form.
The farmers Mount Muria perceived that continuous decreased of cassava production in the area was obviousely as result of degraded land. Soil organic matter (SOM) is a main key to support plant growth. The low organic matter and other important nutrients on degraded land demanded vegetative rehabilitation efforts. This can be done particularly by ‗fertilizer tree system‘ through the planting of the legume tree including Falcataria moluccana , acting as a continuous green manure as well as planting leguminous cover crops and applying manure to improve soil fertility and reduce erosion. By knowing the status of soil fertility on a critical land, then the appropriate handling treatment to the requirements of land recovery can be pursued more thoroughly.
This paper aims to analyze soil fertility at the area of demonstration plots for rehabilitation in the protected area of Mount Muria. The plots are located at the sloping area and cultivated with . The cultivation will be used as an initial description for applying land recovery. 2. EXPERIMENTAL METHODS
481
altitude between 500-600 m above sea level. The everage monthly rainfall during the plant growth is 129 mm, which occurs primarily during November-Maret 2011. Mean temperature is 270C which ranges from 220C (minimum) to 360C (maximum). The average relative humidity varies between 63% and 80%.
The soils in the study area are classified as Latosols and Red Yellow Mediteran. Soil texture is dominated by clay that varies from sandy loam to heavy clay. This research applies four model plots of tree planting combination as a treatment including a control plot. The four models were: 1). Plot dominated by sengon (Falcataria moluccana), 2). Plot dominated by Jabon (Anthocepalus cadamba), 3). Plot dominated by combination of Sengon and Jabon, and 4) Plot control (no planting treatment). Soil sampling was conducted in 12 points of each model plot to represent an area of 5 hectare demonstration plot. The twelve soil samples were taken on a topsoil layer in 30 cm depth. It was conducted prior to do planting based on models that will be applied. Analysis of soil physical and chemical properties include soil texture, pH, organic matter content, carbon (C), nitrogen (N) total, Posphate (P) available, Potassium (K) available and Cation Exchange Capacity (CEC).
3. RESULTS AND DISCUSSION
The results (Table 1) showed variation on soild texture exists, from sandy loam to heavy clay. Soil is classified as slightly acid to acid (pH H2O) which has low organic matter content (mostly < 2%). The soil has low cation exchange capacity and very low nitrogen availability. K-available varies from ‗low to high‘, as well as P-K-available, that ranges from very low to very high. However, in general P available is very high (> 46 ppm).
Table 1. Status of Soil fertility at demonstration plots
Code pH pH C SOM N total P-available K-available CEC Soil Type
482
Although farmers have given fertilizer such as urea, NPK and others to stimulate the growth of cassava plants on their land, but they will not be able to increase land productivity. In order to solve the problem of degraded land fertility, it is necessary to improve organic matter of the soil and bring them back to the site. Soil organic carbon (SOC) is among an essential indicator for soil quality. Gong et al. (2009) in a research at China proved that C and N contents and also the total soil culturable microbial counts (including bacteria, fungi, and actinomycetes) were highest in the Organic Manure treatment, while the unfertilizer treatment showed the lowest value. Application of half organic manure with mineral fertilizer NPK significantly increased C and N contents in soil in comparison with application of mineral fertilizer alone. Many studies have shown that application of organic manure, either alone or in combination with mineral fertilizers, is more effective in increasing SOM and its fractions than mineral fertilizers alone (Gong et al., 2009).
The availability of K and P that have been indicated to be in a range from ‗low to high‘ and from very low to very high were due to application of manure by land owners. General understanding says manure contains both nutrients of macro and micro, and this may explain high contain of P component that reaches >46 ppm, or it is available at the point of T3 up to T9 or between 55 and 220 ppm.
3.1 Maintenance of Soil Organic Matter for Physical, Chemical and Biological Soil Fertility
The role of organic matter on physical soil fertility is to influence the formation of soil aggregates, which is important in the formation of soil structure in order to make it more crumbs. The role of organic matter on chemical soil fertility is to increase Cation Exchange Capacity, changes in soil structure, which was originally has strong and rough blocky structure into a more refined structure that make the soil easier to be cultivated. On the other hand, organic matter applied on sandy soil leads to changes in soil structure, which was originally has a single-grained structure into a blocky shape, thereby increasing the degree of structure and size of the aggregate (Scholes et al., 1994 in Atmojo, 2003). Furthermore, soil organic matter can alter soil structure, which was originally has no structure (solid) into crumbs (a better structure).
Organic matter may influence soil pH by increasing or decreasing soil acidity, depending on the maturity level of organic matter and the soil type. The role of organic matter on biological soil fertility is to increase the activity and populations of macro-and micro-organisms that play an important role in decomposition and mineralization of organic matter (Atmojo, 2003). This is because organic matter is a source of energy for them.
3.2 Organic Matter as A Source of Soil Nitrogen
483
In southern Africa, in response to the declining soil fertility and the negative effects that leads into food insecurity, fertilizer tree systems (FTS) were developed as technological innovation to help smallholder farmers to build soil organic matter and fertility in a sustainable manner (Ajayi et. al., 2011). Dropped leaf and twigs litter become the primary nitrogen cycle and other nutrients which are returned to the ground (Daniel et al., 1979).
3.3 Effect of Organic Matter on Soil pH
Table 1 shows the soil is generally clay-textured (loam to heavy clay) which has the level of soil acidity (pH H2O) slightly acid to acid. Conditions of pH KCl is lower than pH H2O, that indicates sufficient number of ions H+. The ion causes soil acidity that adsorbed in soil colloid layer. Soil colloid is generally in the form of clay (colloidal inorganic) and humus (organic colloids). Dropped litter, especially leaf litter of F. moluccana which is rapidly decomposed and applied manure can help to increase soil pH. In one research, Octavia (2010) proved that soil N total has increased 13 % after applying of 105 g leaf litter of F. moluccana on soil medium of regosols. This study found that the soil given litter has a higher pH (average pH value of 6.22) than that with no litter (an average pH value of 6.14).
Chintu et al. (2004) also proved that leaf litter of F. moluccana can increase soil inorganic N and reduces soil acidity needed by crops including grains. They found that leaves of F. moluccana caused a marked significant reduction in soil acidity within the first 20 days after amendment. The potential usefulness of organic matters to raise pH and hence ameliorate heavy metal toxicity in strongly weathered soils is quickly gaining recognition from several authors (Wong et al. 1998 in Chintu, 2004).
Applied manure was also able to reduce soil acidity. Octavia (2010) showed that soil acidity decreases (pH increases) compared to initial soil acidity before planting. The increase in soil pH, which was initially slightly acid to acid for all treatments that change into rather neutral (pH > 6), is likely to be caused by manure application. Manure from herbaceous livestock contains higher Ca2+, Mg2+ and K+ as grasses absorb more alkaline metal that will reduce soil acidity when it is decomposed. Atmojo (2003) suggested that the increase in soil pH will also occur if the organic matter has decomposed further (mature) because mineralized organic matter will release its minerals, in the form of base cations.
4. CONCLUSION
Low soil organic matter, soil organic carbon, cation exchange capacity and very low soil nitrogen are indicators for the poor soil quality that describes the low soil fertility on private land in protected areas of Mount Muria. Several efforts are needed to increase soil fertility and to decrease erosion including planting pioneer trees of legume as green manure as well as applying leguminous cover crops and manure.
REFERENCES
Ajayi, O C, F Place, F K Akinnifesi (2011): Agricultural success from Africa: the case of fertilizer tree systems in southern Africa (Malawi, Tanzania, Mozambique, Zambia and Zimbabwe). International Journal of Agricultural Sustainability 9(1):129p.
Atmojo, S W (2003): Peranan Bahan Organik Terhadap Kesuburan Tanah dan Upaya Pengelolaannya. Pidato Pengukuhan Guru Besar Ilmu Kesuburan Tanah Fakultas Pertanian. Universitas Sebelas Maret. Surakarta.
484
Daniel, T W, J A Helm and F Baker (1987): Prinsip-prinsip Silvikultur. (D. Marsono, Penterj). Gadjah Mada University Press. Yogyakarta.
Gong, W, X Yan, J Wang, T Hu and Y Gong (2009): Long-term manure and fertilizer effects on soil organic matter fractions and microbes under a wheat–maize cropping system in northern China. Geoderma149:318–319.
Octavia, D (2010): Kajian respon Padi Gogo (Oryza sativa L.) terhadap Perbedaan Intensitas Cahaya dan Masukan Serasah dengan Media Tanah Asal Hutan Rakyat Sengon. Thesis. Unpublished.
INAFOR 11G-055
INTERNATIONAL CONFERENCE OF INDONESIAN FORESTRY RESEARCHERS (INAFOR)
Section G Forest Environment and Climate Change
Species Richness and Composition of Vegetation in Logged Over Forest
PT. BFI SOTEK, East Kalimantan
Nurul Silva Lestari1 and Adi Susilo2
1Dipterocarps Research Center, Jl. AW. Syahrani No. 68, Samarinda, East Kalimantan 75119, INDONESIA Corresponding email: [email protected]
1The Center for Research and Development on Forest Conservation and Rehabilitation Jl. Gunung Batu 5, Bogor 16610, INDONESIA
Paper prepared for
The First International Conference of Indonesian Forestry Researchers (INAFOR) Bogor, 5 – 7 December 2011
INAFOR SECRETARIAT
Sub Division of Dissemination, Publication and Library FORESTRY RESEARCH AND DEVELOPMENT AGENCY
486
Species Richness and Composition of Vegetation in Logged Over Forest
PT. BFI SOTEK, East Kalimantan
Nurul Silva Lestari1 and Adi Susilo2
1Dipterocarps Research Center, Jl. AW. Syahrani No. 68, Samarinda, East Kalimantan 75119, INDONESIA Corresponding email: [email protected]
1The Center for Research and Development on Forest Conservation and Rehabilitation Jl. Gunung Batu 5, Bogor 16610, INDONESIA
ABSTRACT
Forest degradation due to timber harvesting generates ecological changing including biodiversity. This study investigated the impact of logging activities on species richness and composition of vegetation. Heavily degraded forest (recently logged, all commercial trees at dbh of >40 cm were cut), lightly degraded forest (old degraded forest, ready for the next cuting cycle), and nearby protected forest (as control) were sampled. Result showed that species richness in the heavily degraded forest is lowest in all size classes. The lightly degraded forest has the highest species richness in the seedlings, saplings and trees size classes. While the highest species richness of the poles was in the protected forest. Species density of saplings and trees were highest in the protected forest, seedlings were in the heavily degraded forest and poles were in the lightly degraded forest. Dipterocarps species as commercial timber has highest composition in the heavily degraded forest forest in seedlings and poles classes. Dipterocarps species composition of saplings was highest in the protected forest and trees were in the lightly degraded forest. The lightly degraded forest and protected forest have the most in common species. Vegetation assesment in logged over forest should be carried out periodically to verify the impact and determine the appropriate management intervention to support forest sustainability.
Keywords: Species richness, composition, vegetation, logged over forest 1. INTRODUCTION
Indonesia has extensive degraded lands arising from intensive exploitation of forest resources in recent decades (Kartawinata et al, 2001). In 1990, degraded forest due to timber harvesting covered 22.44 million ha. The acreage of logged over area grew into 29.29 million ha in 2000 and climbed up to 38.55 ha by 2005 (Ekadinata et al, 2011). Forest harvesting can be a major cause of anthropogenic disturbance for the forests. The most direct impacts of harvesting are clearly on the tree species being harvested. Harvesting may also impact on other species. If trees are felled, this can cause a significant damage to other trees and the understorey (Newton, 2007). Direct damage in logged forest depends on many factors, including, soil type and variety of techniques intended to reduce damage, but the most important variable is logging intensity. The damage that is caused by logging activities includes dead and injured remaining trees, large canopy opening that encourage the growth of climbers and pioneers, as well as increasing fire risk, and soil compaction, leading to decreased infiltration, increased erosion and slow regeneration (Corlett, 2009).
487
years after logging, or in old logged-over secondary forests without post-logging management, so the long term impacts of present-day logging practices are largely unknown (Bischoff et al., 2005).
Ecological aspect is one of the issue in sustainable forest management. Several institutions take biodiversity aspect as criteria on sustainable forest management implementation. According to ITTO (1998), this criterion relates to the conservation and maintenance of biological diversity, including ecosystem, species, and genetic diversity. Biological diversity can also be conserved in forests managed for other purposes, such as for production, through the application of appropriate management practices. Forest Stewardship Council (1998) principles and criteria (1998) mentions that Forest management shall conserve biological diversity and its associated values. Forest management should also include the research and data collection needed to monitor environmental and social impacts of harvesting. Meanwhile, Ministry of Forestry has been considering biodiversity as indicator to verify and asses the performance of sustainable forest management implementation in production forest.
Understanding the impact of logged over forest is important to determine the appropriate management for sustainable timber production in natural forest. This study investigates the logging impact on vegetation by assessing the differences of species richness and composition of vegetation between heavily degraded forest and lightly degraded forest comparing to protected forest.
2. METHODS 2.1 Study Site
Research was conducted at PT. BFI Sotek, East Kalimantan, geographically located between 116˚ 01‘ - 116˚ 45‘ E and 00˚ 42‘ - 01˚ 18‘ S. Administratively the area is situated in the three (3) districts namely Pasir (21%), Penajam Paser Utara (39%), and Kutai Barat District (40%).
Figure 1: Study site
The company has been operating since 1969 in a lowland forest dominated by Dipterocarps species. Research plots were laid in the forest areas that have been harvested. We also established plot in Mount Meratus protected forest adjacent to PT. BFI Sotek. The site has
488
mean monthly temperatures 26.4 - 27˚C and mean annual precipitation of 2.709 mm. The study site lies at 300-400 m above the sea level. Data were collected in June-July 2011.
2.2 Data Collection
Sampling was carried out in three forest types – heavily degraded forest, lightly degraded forest, and protected forest. These forest types are defined as:
- Heavily degraded forest – recently logged, all commercial trees of dbh > 40 cm were cut - Lightly degraded forest – Old degraded forest, ready for the next cutting cycle
- Protected forest - prohibited logged forest, as control
Vegetation data was collected using line transect. It measures 100x20 m laid purposively in the heavily degraded forest and protected forest due to the site condition in those forest types is not uniform. Meanwhile, the line transect were laid randomly in the lightly degraded forest. As many as 2 transect were made in each forest types. The transect was divided into five plots measuring 20x20 m. Inside these plots the sub plots of 2x2 m, 5x5 m and 10x10 m were made. Vegetation data was collected in the each size class. Data of seedlings (height < 2m) were taken at 2x2 m subplots, saplings (height >2m - dbh<10 cm) at 5x5 m subplots, poles (10 cm≤dbh<20cm) at 10x10 m subplots and the trees size class (dbh≥ 20 cm) were at 20x20 m plots. For each plots and subplots, we recorded name on the species, number of individuals, dbh and tree height (Soerianegara and Indrawan, 1998).
2.3 Data Analysis
Species richness for all size classes was analyzed using rarefaction. Rarefaction is a statistical method for estimating the number of species expected in a random sample of individuals taken from a collection. Rarefaction answers this question: if the sample had consisted of n individuals (n<N), what number of species (s) would likely have been seen? Note that if the total sample has S species and N individuals, the rarefied sample must always have n < N and s < S (Krebs, 2003). The calculation uses ecological method software developed by Krebs.
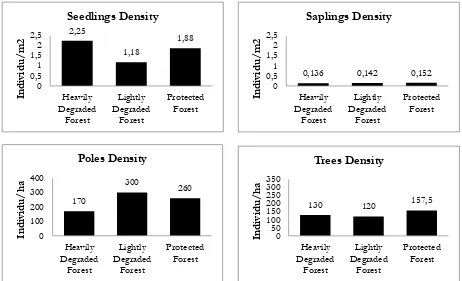
In order to determine species density for each size class, we devided number of individual recorded by sample area, resulting the number of individual/m2 (for seedlings and saplings) and the number of individual/ha (for poles and trees). The species were classified into two category – Dipterocarps species and non Dipterocarps species. Then we calculated the proportion of the individual number of Dipterocarps species and non Dipterocarps species against the total individual number recorded.
Similarity within species among all sampled sites were calculated by using the Morosita-Horn Index using EstimateS 750 software. This index is not strongly influenced by species richness and sample size (Maguran, 2003). The collected data were tested for significance and correlation with chi square and Pearson product-moment correlation test (Minitab 16).
3. RESULT AND DISCUSSION 3.1 Results
3.1.1 Species Richness
489
The analysis for saplings shows, Lightly degraded forest has the highest species richness as well (48 species) with 67 individual observed. The heavily degraded forest have the lowest species richness. There was no significant difference in species richness of the saplings (p= 0.303). Meanwhile in the poles size class, the species richness in all sites were almost similar (13 species) for 17 individual observed. The difference in species richness of poles was not significant between the sites (p= 0.984).The species richness of the trees was highest in the lightly degraded forest (38 species) and lowest in the heavily degraded forest for 52 individual observed. The species richness of the trees was not significantly different between all forest types (p= 0.676).
Figure 2: Species richness for each size of forest class 3.1.2 Species Density
490
Figure 3: Species density for each size of forest class
There was no significant relationship between individual number of seedlings and individual number of trees in the heavily degraded forest (r=-0.077, p=0.833), lightly degraded forest (r=0.227, p=0.336) and protected forest (r=0.207, p=0.567).
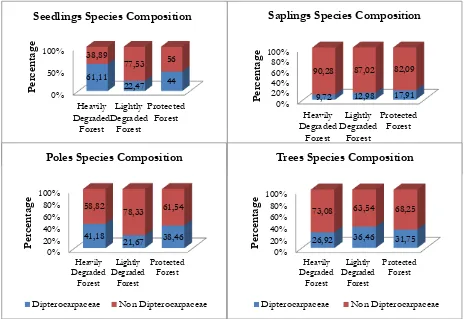
3.1.3 Species Composition
The compositions of the Dipterocarps and non Dipterocarps species are shown in Fig. 3. In the seedlings size class, heavily degraded forest has highest composition of Dipterocarps species (61.11 %) than another forest types. Dipterocaps species has the highest composition in the protected forest in the saplings class (17.91 %). The percentage of poles Dipterocarps was the highest in the heavily degraded forest (41.18 %). In contrast, it has the lowest percentage in the trees size class (26.92 %) while the highest one was in the lightly degraded forest (36.46 %).
491
Figure 4: Species composition for each size of forest class 3.1.4 Species Similarity
In the seedlings size class, heavily degraded forest and protected forest have the highest number of shared species (11 species). Morisita-Horn values showed that lightly degraded forest and heavily degraded forest have the highest similarity based on seedlings abundance (0.07) (Table 1). This means the number of individual of shared species in both location is more similar than the other sites. In protected forest and heavily degraded forest, although the number of shared species is high, the similarity index is low because the number of individuals for each species is different between the two sites.
Table 1. Species similarity of seedlings
First Site Second Site No. of species first site
Protected forest Heavily degraded
forest 30 28 11 0.026
The highest number of shared species for saplings was found in between the lightly degraded forest and protected forest (21 species). Morisita-Horn values also showed that both sites have the highest similarity based on sapling abundance (0.197).
492 Table 2. Species similarity of saplings
First Site Second Site No. of species first site lightly degraded forest and protected forest and heavily degraded forest. Meanwhile, Morisita-Horn values showed that protected forest and heavily degraded forest have the highest similarity, although only 1 shared species observed.
Table 3. Species similarity of poles
First Site Second Site No. of species first site
Protected forest Heavily degraded
forest 20 13 1 0.1
In the trees size class, lightly degraded forest and protected forest have the highest number of shared species (21 species). Both sites also have the highest Morosita-Horn index value (0.553).
Table 4. Species similarity of trees
First Site Second Site No. of species first site
Protected forest Heavily degraded
forest 41 31 6 0.143
3.2 Discussion
493
(Cannon et al., 1998). Species richness is also affected by several ecological factors, including climatic and edaphic. The relationship between those factors and species richness is beyond this study, and therefore their relationships need to be identified and isolated.
Surprisingly, seedlings density in the heavily degraded forest is higher than the other forest types. Nevertheless, the seedlings were not equitably distributed, but merely clustered in certain area. As the area has recently been logged in 2009, the present of seedlings were predicted to come from germination of those fruits and seeds of the fallen trees. In the trees class size, species density in the heavily degraded forest is higher than lightly degraded forest altough it has just been cut. It is perhaps due to lack of commercial species in the area, as a conseqences a lot of trees are still remaining in the heavily degraded forest. The remaining trees in the site dominated by pioneer and un-commercial species, such as Macaranga spp. and Artocarpus spp. Ecological aspect that has direct impact from the number of trees density is light availability which influence the growths of seedlings. In the lowland tropical forest, seedling densities are typically low, so competition between seedlings is much less important as a cause of mortality than competition between seedlings and canopy trees (Paine et al., 2008). However, result in this study suggested that there is no relationship between the number of seedlings and the number of trees. The growth of seedlings depends on species characteristics. Rapid growth characterizes light demanding species, while high survival is found in shade tolerant species (Corlett, 2009). Sapling growth rates also vary within a species, largely due to crown size and variation in exposure to light degree (King et al, 2005). It affects poles density in the lightly degraded forest to become the highest although saplings density is lower than protected forest.
Species classification consisting of Dipterocarps species and non Dipterocarps species is based on the fact that Dipteropcarps is a pre dominant family in Bornean lowland forest. Beside its ecological role, Dipterocarps species are also major commercial timber in Indonesia, so the species is the main target of timber extraction. In the seedlings size class, dipterocarps species in the heavily degraded forest have the highest composition than the other forest types. However, it is dominated only by one species. From 55 individuals of Dipterocarps species found, 38 individuals is Shorea potoensis. The rest are Shorea leavis, Shorea faguetiana, Dryobalanops lanceolata, Hopea dryobalanoides, and Hopea mengarawan. These may show the area has a high potential number of commercial trees in the future. On contrary, the composition of Dipterocarps species in the heavily degraded forest is the lowest in comparison with the other sites in trees size class. It is affected by recent logging activities that harvested the commercial ones.
In the saplings size, composition of Dipterocarps species is under 20%, and the rest of size classes were up to 20%. It is unclear whether it was caused by logging activities or other factors. Dipterocarp species composition of trees in the lightly degraded forest is quite high (36,46%). It indicates that Dipterocarps species may grow well in the logged over forest. Analysing clear changes in floristic composition in tropical rain forest is difficult because majority of the species in any area represented by only a few trees. Study conducted in Peninsular Malaysia found that there were no distinct changes in species composition and the number of Dipterocarps species before and after logging (Ho et al., 2004). In Vietnam species composition of secondary forest post logged 12 years contain 15% of Dipterocarps (Tran et al., 2005). A long term research with more sample sizes in every size class of vegetation is needed to find out changes in species composition.
494
highest similarity. Both of these sites probably have the same environmental condition that support the similar species to grow.
According to ITTO (1998), forest management unit have to provide management guidelines to protect biological diversity, by keeping undisturbed separately from each production area, and maintain natural regeneration to survive. Natural regeneration is verified by capability of forest stands after timber harvesting to regenerate by natural means in acceptable timeframes. A good data series collected from pre harvest forest should be possessed by forest management unit. It could be used as baseline data to formulate forest management plan. Management interventions could give positive contribution to the conservation of biological diversity. Post harvesting assessment is needed to be conducted periodically by forest management unit to monitor and evaluate the changes of biological diversity. Not only the vegetation, ecological aspects including edaphic and climatic factors have to be assessed as well because it relates each other. It takes a long term observation with well trained botanist and ecologist. Therefore, collaboration between forest management unit and research institution is required.
ACKNOWLEDGEMENT
We gratefully acknowledges Pak Samsul for his helps in tree identification. We also thank contribution from field assistants Iwan Setiawan Tumakaka, Julak and La Bedi. This work was supported by DIPA 2011.
REFERENCES
Bischoff, W, Newberry, D A and Lingenfelder, M (2005): Secondary Succession and Dipterocarps Recruitment in Bornean Rain Forest after Logging. Forest Ecology and Management, 218:174-192.
Cannon, C H, D R Peart and M Leighton (1998): Tree Species Diversity in Commercially Logged Bornean Rainforest. Science Magazine Vol. 281.
Corlett, R T (2009): The Ecology of Tropical East Asia. Oxford University Press.
Ekadinata, A, A Widayati , S Dewi, S Rahman and Van Noordwijk (2011): Indonesia‘s Land-use and Land Cover Changes and Their Trajectories (1990, 2000, and 2005). ALLREDDI Brief 01. World Agroforestry Centre. ICRAF, Sea Regional Office.6p.
Forest Stewardship Council (1996): FSC Principles and Criteria for Forest Stewardship.
Ho, W S, W Ratnam, S M Noor and M M Clyde (2004): The Effects of Timing and Method of Logging on Forest Structure in Peninsular Malaysia. Journal of Forest Ecology and Management, 203:209-228.
International Tropical Timber Organization (1998): Criteria and Indicators for Sustainable Forest Management of Natural Tropical Forests. ITTO Policy Development Series No.7.
Kartawinata, K (2001): An Overview of Post-Extraction Secondary Forests in Indonesia. Journal of Tropical Forest Science 13(4): 621–638.
King, D A, Davies, S J, Supardi, M N N and Tan, S (2005): Tree Growth is Related to Light Interception and Wood Density in Two Mixed Dipterocarp Forests of Malaysia. Functional Ecology 19:445-453.
Krebs, C J (2003): Programs for Ecological Methodology. 2nd Edition.
495
Newton, A C (2007): Forest Ecology and Conservation, A Handbook of Techniques. Oxford University Press.
Paine, C E, Harms, K E, Schnitzer, S A and Carson, W P (2008): Weak Competition Among Tropical Tree Seedlings: Implication For Species Coexistence. Biotropica 40: 432-440.
Parotta, J A, J K Francis and O H Knowles (2002): Harvesting Intensity Affects Forest Structure and Composition in an Upland Amazonian Forest. Journal of Forest Ecology and Management 169:243-255.
Soerianegara, I and A Indrawan (1998): Ekologi Hutan Indonesia. Laboratorium Ekologi Hutan. Fakultas Kehutanan. Institut Pertanian Bogor.
Steinitz, O, J Heller, A Tsoar, D Rotem and R Kadmon (2006): Environment, dispersal and patterns of Species Similarity. Journal of Biogeography 33(6):1044-1054.
INAFOR 11G-056
INTERNATIONAL CONFERENCE OF INDONESIAN FORESTRY RESEARCHERS (INAFOR)
Section G Forest Environment and Climate Change
Livelihood Strategies of The People to Climate Change
(Case Study in Gunungkidul District)
Silvi Nur Oktalina and Wiyono T Putro
Vocational School, Gadjah Mada University Sekip Unit I, Yogyakarta 55281, INDONESIA
Paper prepared for
The First International Conference of Indonesian Forestry Researchers (INAFOR) Bogor, 5 – 7 December 2011
INAFOR SECRETARIAT
Sub Division of Dissemination, Publication and Library FORESTRY RESEARCH AND DEVELOPMENT AGENCY
497
Livelihood Strategies of The People to Climate Change
(Case Study in Gunungkidul District)
Silvi Nur Oktalina and Wiyono T Putro Vocational School, Gadjah Mada University Sekip Unit I, Yogyakarta 55281, INDONESIA
ABSTRACT
Climate change has become a global discourse that will affect the socio-economic conditions of society. Communities especially those living in rural areas and surrounding forests is highly dependent on natural conditions that exist in the vicinity. If the natural conditions change then the livelihood of society will also be affected. But in fact people have resilience in facing the pressures from outside. Community resilience in the face of these changes is influenced by several variables, such as social network and community livelihood. This paper will further discuss livelihood strategy of the community in facing climate change based on capital assets consisting of human capital, natural capital, physical capital, social capital and financial capital. The discussion in this paper will take a case study in 2 villages namely Pacarejo village as a representation of the southern district of Gunungkidul or often known as the Pengunungan Seribu, and Nglanggeran village as a representation of the northern district of Gunung Kidul or often known as Pegunungan Batur Agung. The method on this research is survey using questionnaires, indepth interviews and focus group discussion. Livelihood strategies used by communities in the face of climate change among others in Pacarejo and Nglanggeran Villages are changes the pattern of crop sequence. Society no longer plant palawija in their dry land but for one full year to plant rice because of the availability of abundant water. Communities who plant palawija on the condition of abundant water, the production results to be much reduced. In general, society does not exist at this time to plant crops. In addition, because of climate change that is marked by high rainfall in the district of Gunungkidul, the agricultural calendar that has been used as a guide for farmers to make planting activities have started to be abandoned. Nowadays people pay more attention to the signs of nature. Although, according to the agricultural calendar is not time planting season but if there is rain, the community began to plant.
Keywords: Livelihood strategies, climate change, capital asset, Gunungkidul 1. INTRODUCTION
498
This can only be achieved through learning by doing, by testing the boundaries of current project and by trying to understand how they can be reinterpreted to include even greater variations in climate (Blanco, 2006)
Communities especially who is living in rural areas and surrounding forests is highly dependent on natural conditions that exist in the vicinity. If the natural conditions change then the livelihood of society will also be affected. But in fact people have resilience in facing the pressures from outside. Community resilience in the face of these changes is influenced by several variables, such as social network and community livelihood. How people will behave in the face of change will be influenced by their livelihood. Wierssum (2002) defines livelihood as a series of activities, assets and processes together that will determine the quality of life of every individual and family within certain community. Livelihood society consists of a number of activities and assets of the community as well as the process through which the running activity and take advantage of such access. The livelihoods framework helps to organize the various factors which constrain or provide opportunities and to show how these relate to each other (DFID, 1999).
Livelihood asset generally consist of five kinds of capital such as human capital, natural capital, financial capital, physical capital and social capital. Those five kinds of capitals are complement. For each other example investment in human resources alone is not sufficient to sustain livelihoods. While natural resources based economic opportunities not only increase the economic well being of the local community but also increase opportunity to access on resource, management capacity and a kind of social bond with natural ownership (WWF Nepal).
Figure 1: Livelihood Framework
The objective of this research is to identify livelihood strategies of the people to climate change by identify households asset of livelihood activities. This paper will discuss how the community strategy in facing climate change based on livelihoods. The livelihood framework based on the capital assets, i.e. human capital, natural capital, physical capital, social capital and financial capital.
2. METHODOLOGY
This research was conducted in two villages sampleg in the area of Gunungkidul District. Gunungkidul District is a district that is sensitive to climate change because of frequent droughts and landslides in this area. Villages are chosen as samples in this study is Pacarejo village located in the southern area of Gunung Kidul district who called pegunungan seribu with the dominance of
499
kart. While the second village is located in the northern part of Gunungkidul district which is represent pegunungan batur agung. This landscapes condition is based on Physiographic conditions of each region. Data were collected in a survey using questionnaires, in depth interviews using the interview guide and focus group discussion. The numbers of respondents in this survey are 30 respondents. Data analysis of capital asset and livelihood strategy was done descriptively and quantitatively by using the average value, and the tendency of the condition being studied.
3. RESULTS AND DISCUSSION 3.1 Human Capital
Tere are three indicators used to measure human captital, namely the level of education, employment and training. These indicators being assessed in relation with the involvelment of community in the activities concerned. In term of education level of respondent in Pacarejo village about 17% do not completed of elementary school, 50% graduated from elementary school and 33% graduate from junior high school. While the average education level of respondents in Nglanggeran village is better than Pacarejo village with only 3% who do not complete elementary school, 52% graduated from elementary school, 21% graduated from junior high school and 24% graduated from senior high. This conditionshows that the level of education in Nglanggeran village higher than Pacarejo village. Based on the respondent‘s occupation, 100% of respondents in the village Pacarejo as farmers, while in Nglanggeran village respondents work more variety, i.e 88% farmers, 9% as laborers and 3% as traders. This shows that job option in Nglanggeran is more than Pacarejo village. Capacity building of community with training was also more widely practiced in Nglanggeran village than in Pacarejo village. Approximately 70% of respondents in Nglanggeran village have attended various training with an average participation of as many as 2 times. While in Pacarejo village it is only 22% who had followed the training. But from 2009 the Pacarejo village received permission to participation in the smallhoder forest plantation (HTR) program, from Gunungkidul district so that potential future development of human resources is very widely open.
3.2 Natural Capital
Natural capital consist of land and produce, water and aquatic resources, trees and forest products, wildlife, wild foods and fibers, biodiversity and environment services (Serrat, 2008). Pacarejo village is dominated by dry land which covers 33% of the total area. Dry land is planted in intercropping between forest trees and agricultural crops. Plants that dominate agriculture in the village Pacarejo are corn, soybean, peanut, rice and cassava. Productivity of each type of crops is 4.5 tons/ha for corn, soybean 1.3 ton/ha of peanuts 1.9 tons/ha, paddy fields 5.4 tons/ha and cassava 14 ton/ha. Dominant trees in the area are teak and mahogany. Productivity of teak being reported is 12.2 m³/year while mahogany 2.2 m³/year. In addition to timber, fodder was reported to have productivity of 393 tons/ha. Pacarejo Village has two lakes, i.e. Jonge and Serpeng, three rivers and 12 embung. These lake, river and embung as sources of clean water is used daily by people for everyday life as well as being exploited for tourism.
500 3.3 Financial Capital
The assets such as currency in hand, the balances of existing bank accounts, and negotiable instruments such as stocks or bonds do meet the criteria for financial capital. Financial capital is what allows all these productive activities to get going, in a money economy, in advance of the returns that will flow from them (Goodwin, 2003). Sources of income in both Pacarejo and Nglanggeran village generally divided into four, namely 1). Land-based income, 2) income derived from livestock, 3) income derived from employment services and 4) income from other family income. Comparison of income sources from the two villages are presented in Table 1. Table 1. Source of income
Source. Analyzing primary data, 2010
Land-based income is income derived from rice paddies, fields, yards and particularly in Pacarejo that include income from cultivating state forest land. Land-based income in the village Pacarejo consists of paddy fields with a contribution of 46%, 5% home garden, dry land 26% and 23% state forest.
Figure 2. Land Base Income Figure 3. Non Land Base Income
While in Nglanggeran village income from paddy fields only 2% much lower that home garden (34%) and dry land (64%). Based on the results of interviews on average income Pacarejo village is IDR 9 million per family per year while the expenditure was IDR 10 million so that the public still cannot meet all needs. While in Nglangggeran village average annual income is IDR 30 million per household and the average consumption per family per year is IDR 13 million so that people can still be able save of IDR 17 million/year, although savings are not always in the form of money but it can be in the form of food and forest products.
3.4 Physical Capital
501
Pacarejo village consists of 30 mosque and 2 churches. Infrastructures for sport consist of five pieces football field, seven badminton courts and 12 volleyball courts. To support public health, there are unit for health centers and 1 clinic with 28 Posyandu. Educational infrastructure consists of 2 elementary school, and 9 units of kindergarten schools.
Transportation infrastructure in Nglanggeran village consists of 9 km of village roads, and 1.5 km sub regency roads and 2 km of bridge. Those facilities and infrastructure will facilitate the mobility of public transport to and out of the village. To serve the community in Nglanggeran village was supported by 7 units of mosque and 1 church. While the sports facilities consist of a football field 2, 1 of badminton courts and volleyball court 1 unit. The infrastructure of public health in Nglanggeran consists of 1 Puskemas and 5 units‘ posyandu. The education facilities in Nglanggeran village include 3 units of elementary school and 2 units‘ kindergarten. For further education community go to the city or district because good of accessibility that has been pretty good.
3.5 Social Capital
Social capital is a concept that include such as network and connections (patronage, neighborhoods, kinship), relation of trust and mutual understanding and support, formal and informal groups, shared values and behaviors, common rules and sanctions, collective representation, mechanisms for participation in decision making and leadership (Serrat, 2008). The social capitals in Nglanggeran village devide into formal dan informal groups. Formal groups in Nglanggeran village are village consultative institution, centre of rural forestry extention, farmer group, Youth group, village tourism institution and woman institution. While informal groups in Nglanggeran village are traditional forum includes ―mertidesa‖ and forum of land and forest conservation. The forum formed by the community and established by the head of village through the head village decree.
The head village of Nglaageran issued several the head village decreeincludes the commitee to manage Sultan Ground in Nglanggeran village, the commitee to manage ancient Nglaggeran volcano, the board of tourism village, the regulation to protect wild plant and animals and the verificationof wood origin commitee. There are unwritten rule that must be obeyed by the citizens of the community in Nglanggeran village, among others, wedding ceremonies, the bridegroom should be planting the seeds of coconut, if the farmer want to cut trees they must plant seedling and fines for those who damage trees in the sultan ground.
Social capital of the communities in Pacarejo village is not neatly structured like in Nglanggeran village. Formal institution in Pacarejo village include the Village Consultative Board, woman group institution, youth group, Farmers Group in every sub village, farmer groups of community Plantation Forest. In the village, there are some rules that apply to the entire village community, among other regulations concerning trees border in the village roads, greenery around the lake and for the wood that grows on the edge of the road and lake. However, various regulations have not been formalized in a written rule or in formal decision or decree of the head village, so it is difficult to apply sanction for any violation that happens.
3.6 Livelihood Startegies to Climate Change
502
Figure 4. The Livelihood Strategies
Agricultural products has been used to meet the daily needs, while to meet greater need people sell their livestocks and when confronted with a great need people use sources of wood cut from the dry land and community forest. This suggests trees whether coming from owned fields and forests are considered as the savings that will be used if people in a great need. In the face of climate change in livelihood strategy for the community include:
1. People in Nglanggeran villages and Pacarejo make changes of crop pattern sequence. Society no longer plant palawija in the dry land but for one full year to plant rice because of the availability of abundant water. Community plant palawija on the condition of abundant water, the production results to be much reduced. In general, society does not exist at this time to plant palawija
2. Because of the climate change that is characterized by high rainfall in the Gunung Kidul regency, the agricultural calendar that has been used as a guide farmers to make planting activities have started to be abandoned. Nowadays people pay more attention to the signs of nature. Although, according to the agricultural calendar is not time for planting but if there is rain, the community began to plant.
The strategy of community to face climate change has not been done by all of society, most people especially the older generation still use a variety of traditions that had been done while the young generation start to adopt climate change. The impact of this on cropping pattern and different choice of crop species invites high crop pest attacks.
4. CONCLUSION
1. Capital asset of the society are human capital : more than 50% of the people graduate from elementary school so they can read and write, 88% people are farmers and most people had attended the training; financial capital : diversification of income sources of the community, both on land and in services, the lending and savings among the people; Natural capital: dominated by dry land, productive farmland and so can produce agricultural products, there are sources of clean water for daily use for the community; Physical capital: village roads, sub regency roads, regency road and bridges, available infrastructure for education, health and religious advice; Social capital: formal and informal institution in the village, village regulation, head village decree, neighborhoods and kinship.
2. To meet the daily needs, community using the results of the agricultural, to meet the greater need they sell livestock and when a great need to use sources of wood cut from the dry land and forest people had. This suggests that trees in the village are considered as the savings. 3. Livelihood strategies used by communities in the face of climate change among others in the
village Pacarejo and Nglanggeran are communities to change the pattern of crop sequence. Society no longer plant palawija in their dry land but for one full year to plant rice because of the availability of abundant water. Communities who plant palawija on the condition of abundant water, the production results to be much reduced. In general, society does not
Agriculture livestock
trees
503
exist at this time to plant crops. In addition, because of climate change that is marked by high rainfall in the district of Gunung Kidul, the agricultural calendar that has been used as guidance for farmers to make planting activities have started to be abandoned. Nowadays people pay more attention to the signs of nature. Although, according to the agricultural calendar is not time planting season but if there is rain, the community began to plant. REFERENCES
Anonymous (2010a): Profil Desa Nglanggeran. Departemen Dalam Negeri Direktoral Jenderal Pemberdayaan Masyarakat dan Desa
Anonymous (2010b): Profil Desa Pacarejo. Departemen Dalam Negeri Direktoral Jenderal Pemberdayaan Masyarakat dan Desa
Blanco, A V R (2006): Local Initiatives and Adaptation to Climate Change. Blackwell Publishing. USA
Chambers, R and G R Conway (1991): Sustainable Rural Livelihoods: Practical Concepts for 21st Century. Institute of Development Studies. University of Sussex; Brighton
Elasha, B O, H Ahmed and S Zakeildin (2005): Sustainable Livelihood Approach for Assessing Community Resilience to Climate Change: Case Studies from Sudan
Folke, C (2006): Resilience: The Emergence of a Perspective for Socio-Ecological System Analyses. Global Environmental Change. Elsevier
Goodwin, N R (2003): Five Kinds of Capital: Useful Concepts for Sustainable Development. Global Developtment and Environment Institute. USA
Knutsson, P (2006): The Sustainble Livelihoods Approach: A Framework for Knowledge Integration Assessment. Human Ecology Section. School of Global Studies Goteborg University
Milestad, R (2003): Building Farm Resilience: Chlange and Prospect for Organic Farming. Doctoral Thesis. Swedish University of Agricultural Science. Upsala
Nelson, D R, W N Adger and K Brown (2007): Adaptation to Environmental Change: Contributions of a Resilience Framework. The Annual Review of Environment and Resources.
Olaniyan, D A and T Okemakinde (2008):. Human Capital Theory; Implications for Educational Development. European Journal of Scientific Research
INAFOR 11G-057
INTERNATIONAL CONFERENCE OF INDONESIAN FORESTRY RESEARCHERS (INAFOR)
Section G Forest Environment and Climate Change
Application of IPCC Guidelines in Meru Betiri National Park for
Estimating Reference Level (RL)
I Wayan Susi Dharmawan1, Virni Budi Arifanti2 and Ari Wibowo2
1The Center for Research and Development on Forest Conservation and Rehabilitation Jl. Gunung Batu 5, Bogor 16610, INDONESIA
2The Center for Research and Development on Climate Change and Forest Policy Jl. Gunung Batu 5, Bogor 16610, INDONESIA
Paper prepared for
The First International Conference of Indonesian Forestry Researchers (INAFOR) Bogor, 5 – 7 December 2011
INAFOR SECRETARIAT
Sub Division of Dissemination, Publication and Library FORESTRY RESEARCH AND DEVELOPMENT AGENCY
505
Application of IPCC Guidelines in Meru Betiri National Park for
Estimating Reference Level (RL)
I Wayan Susi Dharmawan1, Virni Budi Arifanti2 and Ari Wibowo2 1The Center for Research and Development on Forest Conservation and Rehabilitation
Jl. Gunung Batu 5, Bogor 16610, INDONESIA
2The Center for Research and Development on Climate Change and Forest Policy Jl. Gunung Batu 5, Bogor 16610, INDONESIA
ABSTRACT
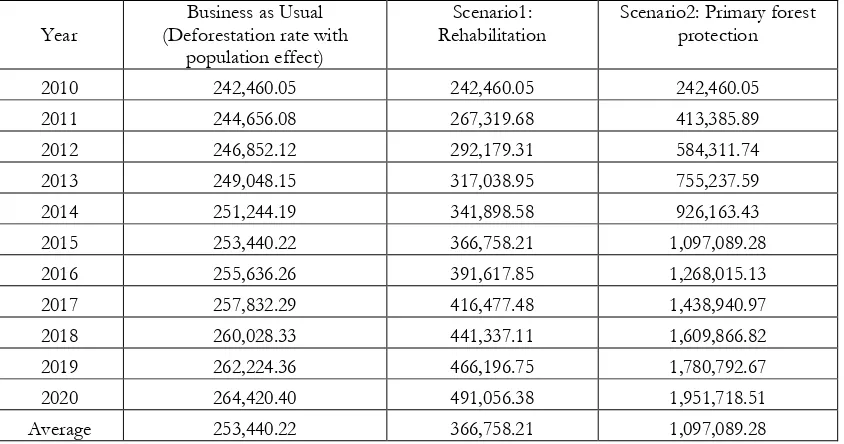
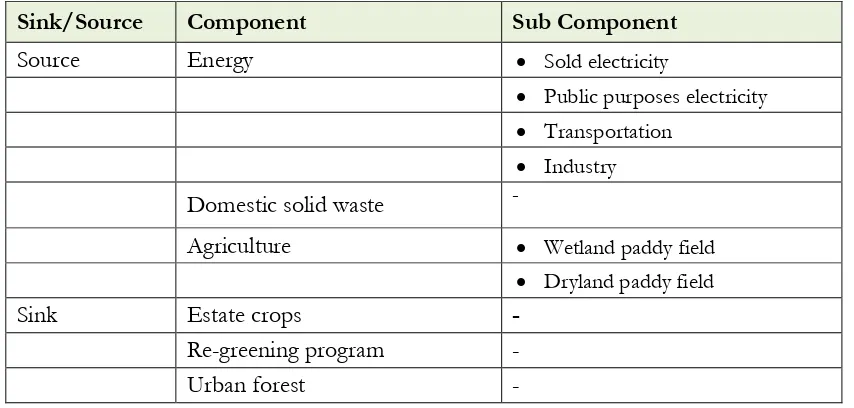
Meru Betiri National Park with ± 58,000 ha as ITTO project for DA REDD would provide information required by international standard related to credible, measurable, reportable and verifiable (MRV) system for monitoring emission reductions from deforestation and forest degradation and enhancement of forest carbon stocks. Setting reference level or baseline for GHG emissions is among the more challenging issues in implementing REDD+ projects. Reference level was set based on estimation of carbon stock from ground measurement through establishment of 40 permanent sample plots and remote sensing data to analyse land cover change. Carbon stock in MBNP varied from 28.7 to 166.63 ton C/ha with the highest carbon stock in secondary forest. Estimation of emission was carried out using IPCC Guideline 2006. The analysis showed that there was sequestration or no emission during the period of analysis in 1997-2010. The sequestration during 1997-2001 was 211,715.56 ton CO2 eq/year, in 1997 and 242,460.05 in 2010 with annual average of 226,158.75 ton CO2 eq/year. Sequestration in MBNP during the period of 1997-2010 was mainly contributed from low deforestation rate and even there was land changes from other land to forest land due to activities in rehabilitation zone. Meanwhile, from the official report, there were small figures of logging and fires as sources of emission. Reference level as Business As Usual (BAU) for emission up to the year 2020 was estimated based on average emission from 1997-2010. Regression analysis was performed to identify the relationship, however there was no model fit for the existing data. Therefore, scenario of emission from MBNP in the future was made based on anticipated deforestation and population growth. Based on forecasting analysis in BAU, CO2 sequestration will increase during 2010-2020 from 242,460.05 ton CO2 eq in 2010, to 264,420.40 ton CO2 eq in 2020, with an average of 253,440.22 ton CO2 eq/year. These preliminary results showed that carbon emissions in Betiri Meru National Park were negative or sequestration, due to small rate of deforestation and vegetation growth. Therefore, for national park as conservation area, REDD+ should be focussed on maintaining conservation or biodiversity and improvement of community awareness and welfare. Voluntary standard of Community and Climate Biodiversity (CCB) is available for REDD+ project focussing on biodiversity and social safeguards. Information on important flora and fauna as biodiverity in MBNP is also included.
Keywords: Reference level, biodiversity, MBNP, REDD+ conservation 1. INTRODUCTION
506
therefore forest can also contribute to global community through its role in reducing GHGs emissions.
International scheme is being developed to include REDD (Reducing Emission from Deforestation and Degradation) as carbon related mechanism to deal with global warming. REDD is basically the activities to reduce emission through avoidance of forest fire, illegal logging, forest conversion (convert forest area to non-forest area) and other activities that cause deforestation and degradation. The idea is enhancing forest carbon stocks through conservation of the existing forests. Undisturbed conservation forests store significant carbon, and therefore avoiding emission to the atmosphere, meanwhile, illegal logging, disturbance and forest encroachment increase carbon emission to the atmosphere.
Meru Betiri National Park (MBNP) located in southern part of East Java is one the National Parks which has been selected as the project site for ITTO activities since 2010. The total area of the Park is ± 58,000 ha consisting of various vegetation types from mountainous to coastal areas. MBNP is rich in biological diversity and community living surrounding the forest which give both positive and negative effects to the sustainability of the forest. MBNP as ITTO project for DA REDD+ would provide information required by international standard related to credibility, measureabilitye, reportability and veriability verifiable (MRV) of thesystem for monitoring emission reductions from deforestation and forest degradation and enhancement of forest carbon stocks.
For REDD+ project, setting reference level or baseline for GHG emissions is an important step and among the more challenging issues in implementing REDD+ projects. The objective of this study are to analyse land use, land cover change and the association carbon stock change to establish project reference level as baseline for REDD+ in MBNP. Baseline of reference level was set based on estimation of carbon stock changes and emission from ground measurement through establishment of 40 permanent sample plots and land cover change based on remote sensing data analysis.
2. METHODOLOGY 2.1 Study Site
Meru Betiri National Park (MBNP) was established through the enactment of Ministerial Decree No. 277/Kpts-VI/1997. Based on this decree, the area of MBNP covered about 58,000 ha, and is located in Jember and Banyuwangi District, East Java Province. Within the area, nucleus zone is the largest proportion of the MBNP (48.13%), followed by forest zone (39%), rehabilitation zone (6.94%), intensive use and buffer zone (5.94%) (Figure 1).
Each zone has its characteristics and function. Based on Ministerial Decree No. 56/2006, nucleus zone is a pristine and dense forest, characterised by indigenous flora and fauna. Forest zone is a buffer for nucleus zone, and situated between nucleus zone and utilization zone. Rehabilitation zone is a degraded area that needs to be rehabilitated. Buffer zone is an area managed specially for accomodating protection and conservation of natureal park, including ecotourism. Utilization zone is utilized for ecotourism and other environmental services purposes.
507
tigris sondaica) which is now a highly endangered and protected species. Annual rainfall in Meru Betiri National Park as 2,500 – 3,000 mm/year, topography is very steep and soil type is ultisol.
Figure 1: Zonation map of MBNP 1999 2.2. Methods
2.2.1 Remote Sensing Analysis
The methods used for monitoring of forest cover change using satellite remote sensing can be divided into several steps as follows: (i) Pre-processing including geometric correction, image classification, ground truthing and re-classification, and (ii) generation of land change matrix. Satellite imageries used are as follows:
(i) Landsat TM 5 for acquisition for year 1997 and 2001, (ii) Landsat ETM 7 for acquisition year 2005, 2007, 2010, (iii) ALOS PALSAR for 2007, 2008 and 2009.
Instrument used for conducting data analysis is a unit of computer equipment with software Erdas Imagine 9.1, Er Mapper 7.0, ArcView 3.2. A handheld GPS is used for ground truthing activities in the study site.
2.2.2. Estimation of Carbon Stock
508
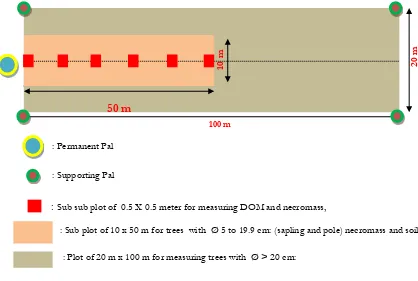
Figure 2: PSP design for measurement of carbon pools in Meru Betiri National Park Total 40 PSPs were established and carbon stock was measured according to IPCC GL 2006, consisting of five carbon pools namely above ground biomass, below ground biomass, necromass, litter and soil.
Above Ground Biomass (AGB) Measurement
Above Ground Biomass is measured for living trees and understorey. AGB of living trees is measured with non-destructive method and applies allometric equation to obtain biomass. The allometric equations for biomass usually consist of information wood-specific gravity (in g/cm³). The choice of the best predictive allometric equations (models) in estimating AGB is developed by Chave et al. (2005) on the basis of climate and forest stand types. Below ground biomass was not conducted in this research. Converting biomass to carbon was used : biomass value x 0.47. Woody Necromass Measurement
Within the plot, all woody debris and trunks (unburned part), dead standing trees, dead trees on the ground and stumps are sampled. Their height (length) and diameter are recorded, as well as notes identifying the type of wood for estimating specific density.
Litter (Non Woody Necromass) Measurement
Litter consists of leaves and small branches above the ground as non woody necromass. Litter samples are collected from the same quadrants of 0.50 m x 0.50 m (0.25 m2) as used for under storey sample.
Soil Samples
Soil organic carbon determined through samples collected from the default depth prescribed by the IPCC (2006). Soil samples are taken from three layers (depth), 0-10 cm, 10-20 cm dan 20-30 cm at six points on each plot. Soil samples are analyzed in the laboratory as composite samples to identify chemical properties such as pH and C content.
: Supporting Pal 50 m
100 m
10
m
20
m
50 m
: Permanent Pal
: Sub sub plot of 0.5 X 0.5 meter for measuring DOM and necromass,
: Sub plot of 10 x 50 m for trees with Ø 5 to 19.9 cm: (sapling and pole) necromass and soil
509 2.2.3. Estimation of Baseline/Reference Level
Meridian (2011a) defines REL/RL as the business as usual (BAU) developed by taking into account historic emissions and removals adjusted based on national circumstances to improve accuracy. Hence, REL/RL provide the benchmark based on which greenhouse gas (GHG) emission reductions and removals can be measured to assess progress in reducing forest-related emissions, and also serve as basis for results-based or performance-based incentive systems for developing countries (Meridian, 2011b). Reference levels serve as baseline for purposes of estimating reductions in emission. They depict a business as usual (BAU) emissions, that is, expected emission if no REDD intervention is implemented. Hence, it provides some benchmark for determining or estimating reductions in emissions resulting from REDD+ intervention. Reference levels are important because they are needed as basis for determining eligibility for bilateral or international results-based or performance-based support, and as benchmark for actual calculation of the amount of support on the basis of verified emissions. Baseline has been established based on historical data of emission from 1997 to 2010. Regression analysis was made to make prediction up to the year 2020. Average emission was also used to estimate future prediction. Moreover, estimation of future prediction of emission also considers population growth and deforestation rate. The following steps and assumption are made to establish reference level:
Preparation of land cover change matrix (LCM) for the period of 1997-2010 into six land categories namely: forest land, crop land, grass land, wet land, settlement and other land
Estimation of annual rate of forest conversion to other land uses for the period of 1997-2010 that was 32,05 ha
Collection of data for forest disturbance caused by illegal logging, forest fire and land encroachment (MBNP, 1998-2008).
Emission from mineral soil due to land cover changes was not taken into account
Above ground biomass of each forest type was estimated using allometric equation. Mean annual biomass increment was based on data in IPCC Guideline 2006.
All data are used to calculate emission using worksheet of IPCC Guideline 2006.
Regression analysis of linier relationship was applied using population number as data and deforestation rate in 1997-2010 to estimate emission/sequestration until 2020.
Scenarios of emission reduction were made based on rehabilitation activity and protection of primary forest.
Interpolation of emission/sequestration data of CO2 from 1997-2010 was made to estimate emission/sequestration of CO2 from 2010 until 2020.
Calculation of emission reduction/increasing the sequestration of CO2 was made from rehabilitation activity and protection of primary forest.
3. RESULT AND DISCUSSION 3.1 Land Cover Change
510
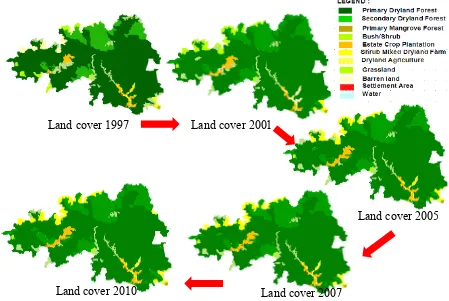
had an impact to landcoverage, where forest trees are planted intercropped with dryland agriculture vegetation. Landsat 2010 also showed that the area is currently dominated with shrub mixed and dryland agriculture vegetation (Arifanti et al., 2010).
Figure 3: MBNP landcover classification from Landsat 1997, 2001, 2005, 2007 and 2010 Table 1. Landcover classification of MBNP
LAND COVER 1997 2001 2005 2007 2010
Ha % Ha % Ha % Ha % Ha %
Water 52 0 52 0 52 0 52 0 52 0
Bush/Shrub 2,654 5 1,965 4 1,932 4 1,814 3 1,814 3 Primary dryland forest 40,309 74 39,460 72 39,218 72 38,537 71 37,965 70 Secondary dryland forest 7,413 14 8,810 16 9,181 17 9,788 18 10,315 19
Mangrove forest 71 0 102 0 102 0 101 0 101 0
Settlement 28 0 28 0 28 0 33 0 38 0
Plantation 1,058 2 1,186 2 1,425 3 1,394 3 1,373 3
Dryland agriculture 0 0 75 0 633 1 872 2 685 1
Shrub mixed dryland agriculture 507 1 265 0 1,749 3 1,812 3 2,060 4
Grassland 1,084 2 2,144 4 242 0 153 0 153 0
Barren land 1,385 3 474 1 0 0 6 0 6 0
Total Area (ha) 54,562 100 54,562 100 54,562 100 54,562 100 54,562 100
Landuse change matrix (LCM) is generated based on 6 land categories of IPCC GL 2006. The adjustment made in LCM is conducted by classifying each land category of IPCC GL 2006 into sub categories of classification following the classification made by DG Forest Planology (2006) as follows: the Primary dryland forest, Secondary dryland forest and Mangrove forest are
Land cover 1997
Land cover 2005 Land cover 2001