M
any businesses today are pursuing a growth strategy. Typically, small- to medium-sized enterprises must fund growth internally, which, in turn, is a function of the company’s ability to generate positive cash flows. A domestic electronic consumer products manufacturer, referred to in this article as XYZ, was experiencing cash-flow difficulties and unprofitable growth, so it responded by imple-menting a simple activity-based costing (ABC) system. This cost system redesign allowed XYZ to estimate return on sales (ROS) and return on investment (ROI) results for both product lines and customers. In short, the ABC system provided the owners with strategiesfor pursuing profitable growth.
We will look at how ABC improved XYZ’s pricing and product decisions and spurred business process improvements, all of which allowed the company to become more competitive. To help accountants and managers who otherwise might hesitate to engage in a cost-system redesign project, we also discuss ABC implementation issues likely faced by small- to medium-sized manufacturers.
BA C K G R O U N D
Founded in 1999, XYZ Corporation caught the Internet wave squarely by offering domestically produced, value-based consumer electronics products directly to
Cost-System Redesign
at a Medium-Sized
Company: Getting the
Right Numbers to Drive
Improvements in
Business Performance
A
CTIVITY-
BASED COSTING ALLOWED A MANUFACTURER TO MAKE BUSINESS PROCESSCHANGES THAT HELPED IMPROVE CASH FLOW
,
PRODUCT AND CHANNEL PROFITABILITY,
AND THE COMPANY
’
S COMPETITIVE POSITION.
the end user through the company’s website. The com-pany separates its products into six families:
◆ Product family A consists of purchased accessories.
◆ Product family T items have textured finishes and
can be purchased locally in small-lot quantities. All other finish types must be purchased in ocean-container quantities.
◆ Product family V comprises items with a vinyl finish.
◆ Product family W includes premium
wood-finished items.
◆ Product family U is uniquely designed and
exclu-sively manufactured items.
◆ Product family S items represent complete
assem-blies, which XYZ purchases from foreign manufacturers.
Annual sales for all products amount to approximate-ly $9 million. Currentapproximate-ly, the company ships all orders from a single U.S. manufacturing facility. XYZ sells products directly to domestic customers, but foreign customers purchase items through an exclusive dealer network. The company has three owners and 16 employees, most of whom work at home in various parts of the country.
Since XYZ’s founding, the company’s competitive advantage has been low overhead costs and high cus-tomer service—a combination that equates to high val-ue in the customer’s mind. XYZ’s primary competitors include low-cost Internet direct distributors that pur-chase complete products from foreign manufacturers and high-end product manufacturers that distribute merchandise via specialty retail shops. Technical inno-vations and new product offerings principally fuel growth in the industry in which XYZ competes.
During each of its first five years, the company expe-rienced significant sales growth. The first three years saw 40% sales volume and revenue growth per year fol-lowed by 20% growth in each of the next two years. Sales volume and total revenues are still increasing, although cash flow is becoming a problem for the com-pany. Shrinking dividend payouts and slowing payment cycles to suppliers suggested that the proverbial “edge of the cliff” for this company was fast approaching!1
Growth in sales revenues is a desired outcome for
most businesses, as it is with XYZ, but growth in sales without sufficient cash to fuel expansion may actually be counterproductive. This could occur, for example, when growth is fueled by new product offerings that do not recover their full costs. In short, cash flow and working capital, not sales revenue or sales volume, are the lifeblood of a business.2
Continued success for XYZ was therefore being jeopardized by the lack of sufficient cash flow. Under-standably, the owners wanted to know the causes of the deteriorating situation, so they put together a cross-functional team consisting of the chief financial officer, plant manager,3and director of engineering to
investi-gate the situation. After considerable deliberations, the team identified the following problem areas:
◆ Poor inventory management,
◆ Lack of control of overhead (i.e., manufacturing support) costs, and
◆ Inefficient business processes (for example, disorganized inventory information).
PR O B L E M SP E C I F I C AT I O N— A DE E P E R LO O K
For virtually any manufacturer, proper inventory man-agement ensures the availability of the right items at the right time and in the right place. This, in turn, sup-ports organizational objectives of customer service, pro-ductivity, profit, and return on investment (ROI). There are, however, both out-of-pocket and opportunity costs associated with inventory holdings. For example, inven-tory ties up capital, uses storage space, requires han-dling, deteriorates, becomes obsolete, incurs property taxes, requires insurance, and sometimes is lost or stolen.4For XYZ, increased inventory holdings to
accommodate anticipated sales increases were straining cash flow. Further, inventory levels increased at XYZ when the company was pursuing a growth strategy of product-line diversity. Realized sales increases, how-ever, were not sufficient to offset the increased invest-ment in inventory for the company, which, consequent-ly, was robbing the company of much-needed liquid assets.
to that of many start-up manufacturers. Batch quantities for the company were initially small, labor content was high, and overhead was relatively low. As the company matured and sales increased, labor content decreased because of greater returns to scale, learning-curve effects, and investments in an improved infrastructure.5
With increases in sales volume and a changing sales mix that XYZ was experiencing, support costs were escalat-ing. Capacity-related costs as well were increasing dis-proportionably to increases in sales. Indirect labor costs, capital expenditures (e.g., tooling costs), and factory overhead costs were all increasing faster than sales rev-enue. XYZ had always excelled at delivering and sup-porting a superior product. As such, cost control was never an area of focus for the company, but now it was becoming a strategic issue. In short, support costs for XYZ were escalating rapidly, overrunning profits and draining cash.
Increased inventory holdings and excessive overhead spending combined to reduce the company’s net cash flow. Determining which inventory items to reduce and which overhead costs to focus on, however, was unclear to the owner-managers. The necessary cost-control tools and supporting business processes were not in place at XYZ to guide these decisions, so the cross-functional team ultimately decided to critically examine the com-pany’s accounting system.
CO S T-S Y S T E M RE F I N E M E N T
XYZ had been using a traditional cost system that was fairly rudimentary. In fact, the view of the owners was that the cost system was necessary only for compiling data for income-tax purposes and periodically for preparing financial reports (e.g., to support a bank loan request). As a result, the company had done no budget-ing or forecastbudget-ing to track and control costs. Thus, XYZ’s existing cost system could not capture the under-lying economics of the company’s production function and, therefore, could not assist the company in respond-ing to the deterioratrespond-ing situation in which it found itself. The plant manager had just completed an MBA course in management accounting and was intrigued by the prospect of introducing a rudimentary activity-based costing system at XYZ. This was the primary pro-posal that the three-person team dealt with over an
ensuing six-month period.
Companies use ABC systems to improve product and/or customer costing principally because such sys-tems provide better (i.e., more accurate) estimates of the resource demands (or resource consumption) of an organization’s outputs, its customers, and its distribution channels. The plant manager at XYZ thought that use-ful insights for improving cash flow and profitability might be possible if the company had a better handle on the resource demands of its various product offerings and distribution choices. Such insights, the team hoped, would enable the company to respond to the strategic challenges it was facing.
Further, the plant manager read an article in the Fall 2005 issue of Management Accounting Quarterly, “Product Line and Customer ROI: The Next Generation of ABC,” which introduced him to using ABC data to evaluate product- and customer-level ROI.6The article
asserts that ABC concepts can be extended to encom-pass the allocation of assets to activities. Just as resources under ABC are assigned to activities (e.g., production setups) for costing purposes, assets can simi-larly be assigned to activities. Once the level of assets associated with a given activity is determined, it is pos-sible to assign assets to customers and products in the same fashion that ABC assigns costs to products and customers. Thus, the plant manager at XYZ wondered whether the company could use a simple ABC system to guide strategic decisions such as those related to product mix, product selling price, overhead cost con-trol, and business process improvement.
A B C EL E M E N T S
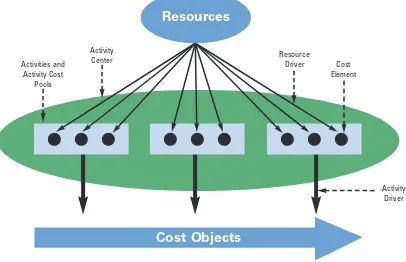
Figure 1 illustrates the general elements of an ABC sys-tem: resources, activities, resource drivers, cost objects, and activity cost drivers. Resources are devoted to the performance of activities; they are the sources of cost.7
marketing, accounting, customer service, engineering, assembly, and plant management were designated as resources for the ABC model. Resources that are not functional areas at XYZ include facilities and materials.
Activities are units of work performed by the organi-zation’s resources. Typical activities ABC captures include things such as creating a customer order, pro-cessing returns, creating invoices, and handling materi-als. In an ABC system, activities typically are organized in a master list called an Activity Dictionary. Table 1 is a portion of the Activity Dictionary XYZ developed. This example includes the major activities performed by the customer-service resource and the corresponding level hierarchy for each identified activity. The cost-level hierarchy is a framework for classifying activities according to the level at which costs are incurred. Unit-level, batch-Unit-level, product sustaining, and business sus-taining are activity levels in conventional ABC
implementations.
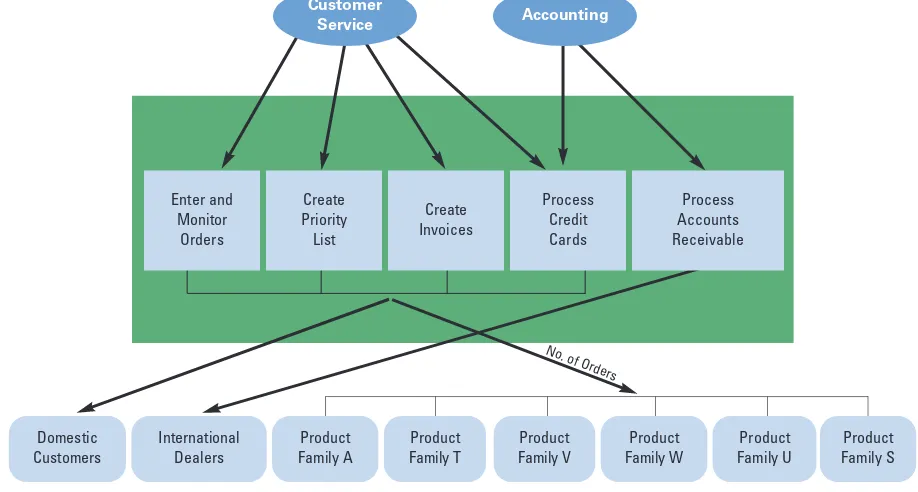
Related activities are grouped in activity cost centers, which at XYZ include order processing, inventory, ware-housing, engineering and marketing, assembly, cus-tomer service, and accounting. These activity centers parallel XYZ’s organization chart. The activity cost cen-ter’s purpose is to organize activities in a meaningful way and, ultimately, to facilitate business process improvements and strategic cost management. For instance, the order-processing activity cost center in Figure 2 groups activities specific to the customer order-entry process at XYZ.
Resource driversassign costs from descriptive accounts contained in an organization’s existing cost system to activities. Resource drivers link resources and activities and are chosen to approximate the resources activities use. For example, in Figure 2, cus-tomer service and accounting resource costs are traced
Resources
Activities and Activity Cost
Pools
Activity
Center Resource
Driver Cost Element
Source: Peter B.B. Turney, Common cents: how to succeed with activity-based costing and activity-based management, rev. ed., McGraw-Hill, New York, N.Y., 2005, p. 95.
Activity Driver
Cost Objects
to five order-processing activities. Most resource driver amounts are based on estimates of the effort expended on each activity. XYZ used interviews and question-naires to generate these estimates. Other resources, such as materials, are assigned to activities using more exact information. Pinpoint accuracy is not required for
ABC systems, particularly for initial system develop-ment and for a small- to medium-sized company such as XYZ.
The cost objectis the final point to which costs are assigned and is the reason work is performed. For example, it can be a product, a service, a customer or
Figure 2:
ORDER-PROCESSING ACTIVITY COST CENTER AT XYZ
Accounting Customer
Service
Domestic Customers
International Dealers
Product Family V
Product Family W
Product Family U
No. of Orders
Enter and Monitor Orders
Process Accounts Receivable
Product Family A
Product Family S Process
Credit Cards
Activity Resource Cost Hierarchy
Advertise Products Customer Service Product Sustaining Ship Product Customer Service Unit Level Answer Product Information Question Customer Service Product Sustaining Support Post Sales Customer Service Product Sustaining Process Warranty Claims Customer Service Unit Level
Maintain Shopping Cart Customer Service Business Sustaining Enter and Monitor Orders Customer Service Unit Level
Create Priority List Customer Service Batch Level Create Invoices Customer Service Unit Level Process Credit Cards Customer Service Unit Level
Table 1:
EXCERPT FROM XYZ’S ACTIVITY DICTIONARY
Product Family T Create
Priority List
customer group, or a distribution channel. Cost objects can also vary in detail depending on the ABC system’s purpose and the organization’s nature. For XYZ’s initial ABC model, the cost objects consist of the aforemen-tioned six product families and two distribution chan-nels. The product families and distribution channels are distinct because of differences in resource
requirements.
Activity cost driversassign the costs of activities to cost objects by measuring the level of activity consumption by each cost object. In conventional ABC systems, there are three basic types of activity drivers.8
Transac-tiondrivers count the frequency of an activity and are the least expensive cost driver. Transaction drivers, however, may be the least accurate drivers because they assume the same quantity of resources is required every time an activity is performed. For example, the activity “number of admissions” is a possible transaction driver for all hospital-related support costs associated with the admissions/discharge process. Each admission/discharge
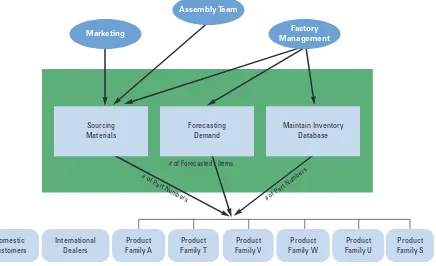
is counted as a single activity, and this information is readily obtainable from admission records. Figure 3 shows the inventory-management cost center for XYZ. All activity drivers in Figure 3 are transaction activity drivers.
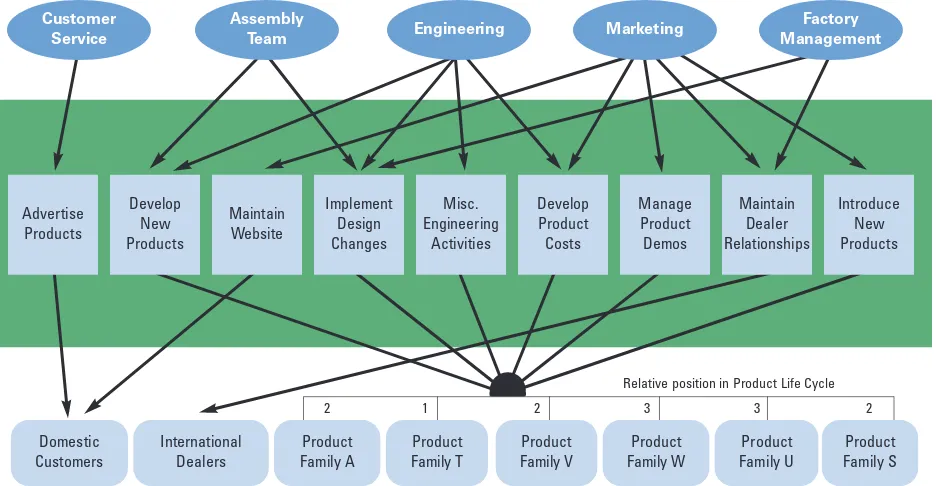
Durationdrivers represent the amount of activity per-formed. Duration drivers are used in an ABC system when significant variation exists in the amount of activi-ty required for different outputs. For example, in a hos-pital setting a logical duration driver for routine care (“room and board”) costs would be number of patient-days; in a manufacturing setting, a duration driver regarding setup activity would be number of setup hours. Figure 4 contains a representation of the market-ing and engineermarket-ing cost center for XYZ in which a duration driver was used in a unique way. To assign engineering and marketing activity costs at XYZ, the product family’s position in the product life cycle was used. The product life cycle was split into four stages: introduction, growth, maturity, and decline. Each
prod-Figure 3:
INVENTORY-MANAGEMENT COST CENTER
Domestic Customers
International Dealers
Product Family T
Product Family V
Product Family W
Product Family U
# of Part Numbers
# of Forecasted Items
Product Family A
Product Family S
Marketing
Assembly Team
Factory Management
Maintain Inventory Database Forecasting
Demand Sourcing
Materials
uct family was allotted the appropriate numerical value based on its stage in the product life cycle. Subsequent-ly, engineering and marketing costs were assigned to product families based on their comparative product life-cycle position. The product life-cycle duration dri-ver was used because a transaction dridri-ver or traditional duration driver for marketing and engineering, such as number of engineering change notices, was not avail-able. Going forward, XYZ will need to determine if the additional accuracy that comes from using a transaction driver such as number of engineering change notices is worth the additional information-collection costs that would be involved.
Intensitydrivers charge directly for the resources used each time an activity is performed and are generally the most accurate activity cost drivers. They also are the most expensive to implement. In a manufacturing set-ting, an intensity driver for setup activity might be direct-cost tracing for labor. For XYZ, engineering activ-ity costs (see Figure 4) could be assigned more
accu-rately if logs were used to track an individual’s time worked on each product family (A, T, W, etc.).
BE N E F I T S F R O M T H E IN I T I A L A B C IM P L E M E N TAT I O N
Although still in its nascent stage, the ABC system at XYZ has yielded a number of financial and process-related benefits.
Financial (Profit-Loss) Effects
The company used initial ABC data to construct a pro formaprofit and loss (P&L) statement by product fami-ly and distribution channel (see Table 2). The ABC model was used to assign revenue, manufacturing costs, and operating expenses across product families. Prior to the ABC system, XYZ was unable to generate financial information to this level of detail. Based on the infor-mation in Table 2, several recommendations emerged for improving cash flow and for maximizing ROI across cost objects.
Figure 4:
ENGINEERING AND MARKETING ACTIVITY COST CENTER
Domestic
Relative position in Product Life Cycle
Use of Common Components:A recently released study concludes that automakers can increase profitabil-ity by using common components across platforms.9
The study reports that Toyota saves an estimated $1,000 per vehicle over five years by using common components. The decision team at XYZ reviewed prod-uct configurations and estimated that the company could reduce inventory investments by approximately $132,000 by emphasizing a common-component strate-gy in product family T, product family V, and the for-eign distribution channel. For example, product fami-lies T and V use unique electrical components that can
be replaced by electrical components used by other product families. In addition, most foreign dealers require their electrical components to accept 220v pow-er input. These components can be eliminated by adding a voltage selection switch to the domestic 110v electrical component equivalent. Table 3 shows the expected results of the proposed changes. With the ABC model, XYZ is able to reveal the positive financial effects of using common components.
Product-Mix Decisions:When products and customers
are served from the same constrained asset, which for XYZ is dollars of working capital, it is necessary to
Product Family Distribution Channel
A T V W U S Direct Dealers
Sales $23,901 $100,435 $138,557 $136,094 $117,560 $60,762 $462,108 $115,201 COGS $24,181 $66,256 $81,347 $72,798 $62,765 $30,618 $261,265 $76,670 Gross Profit ($281) $34,179 $57,210 $63,295 $54,794 $30,145 $200,842 $38,530 Operating Expenses $5,676 $18,375 $31,056 $21,370 $16,729 $17,415 $100,808 $10,338 Operating Income ($5,956) $15,803 $26,155 $41,926 $38,065 $12,730 $100,034 $28,192 Return on Sales (ROS) (24.92%) 15.74% 18.88% 30.81% 32.38% 20.95% 21.65% 24.47% Total Inventory $27,540 $106,266 $186,440 $229,380 $92,091 $121,242 $568,488 $194,471 Return on Inventory (21.63%) 14.87% 14.03% 18.28% 41.33% 10.50% 17.60% 14.50%
Table 2:
PROFIT AND LOSS (P&L) STATEMENT BY PRODUCT
FAMILY AND DISTRIBUTION CHANEL
BEFORE ABC: AFTER ABC:
Cost Objects Cost Objects
(T) (V) (F) (T) (V) (F)
Textured Vinyl Dealers Textured Vinyl Dealers
Total Income $100,435 $138,557 $115,201 Total Income $100,435 $138,557 $115,201 Net Operating Income $15,803 $26,155 $28,192 Net Operating Income $15,257 $24,255 $28,192 Return on Sales 15.74% 18.88% 24.47% Return on Sales 15.19% 17.51% 24.47% Total Inventory $106,266 $186,440 $194,471 Total Inventory $65,266 $163,440 $126,753 Return on Inventory 14.87% 14.03% 14.50% Return on Inventory 23.38% 14.84% 22.24%
Table 3:
PROJECTED PROFIT AND LOSS (P&L) STATEMENTS
determine the appropriate product mix that will maxi-mize profits subject to the constraint. Based on its review of profitability figures for all product families and products (see Table 2), the decision team recom-mended eliminating some product options. That is, from a profitability perspective, sometimes “less is more.” Conventional accounting systems can obscure the cost of product-line complexity and product proliferation—costs that ABC systems attempt to uncover.
For product family W, the walnut-finished products were eliminated because of weak sales globally. That recommendation was easy to explain because walnut-finished products made up only 2% of the wood-finished products sold while accounting for an estimat-ed 10% of the inventory investment in the product family. The other product-mix recommendation of eliminating off-color finishes from product family V was more difficult to justify. For product family V, off-color products account for 20% of sales. On the surface, it’s hard to walk away from that amount of sales until you realize that, because of minimum-order quantity requirements from the supplier, one-third (i.e., $40,000) of the company’s inventory investment in the product family is tied up in off-color products. Table 4 shows the estimated financial effect of eliminating off-color inventory at XYZ.10The lesson here is straightforward:
With cash-flow constraints, it may be necessary to
elimi-nate products that sell and that have good profit mar-gins but that tie up too much cash in inventory. This insight is a direct result of the estimated cost data pro-vided by the new ABC system.
The last recommendation from the team was surpris-ing. Product family U comprises the first products designed and manufactured by XYZ. Products in this line are unique in the marketplace but are “long in the tooth.” Because product family U’s sales were shrinking in comparison to total sales, it was assumed that these products were at the end of their life cycle. On the con-trary, based on ABC data, product family U had the highest ROS and ROI. It was, in effect, XYZ’s cash cow. As such, the team recommended that XYZ do every-thing possible to increase sales, including expanding markets, reintroducing products with improved aesthet-ics, and initiating a complete redesign of the product line. Increasing sales in product family U would not decrease absolute inventory levels, but it would increase overall ROS and ROI.
Because of the cash-flow issues, the decision team’s main focus was reducing inventory to increase cash flow and product-level ROI. Recommendations focusing on using common components and eliminating poor-performing products account for an estimated inventory reduction of $172,000. Other recommendations, includ-ing renegotiatinclud-ing minimum-order quantities on pur-chased components, accounted for an additional
esti-BEFORE ABC: AFTER ABC:
Cost Objects Cost Objects
(V) (W) (S) (V) (W) (S)
Vinyl Wood Purch. Vinyl Wood Purch.
Comp. Comp.
Total Income $138,557 $136,094 $60,762 Total Income $138,557 $136,094 $60,762 Net Operating Income $26,155 $41,926 $12,730 Net Operating Income $26,155 $41,926 $12,730 Return on Sales 18.88% 30.81% 20.95% Return on Sales 18.88% 30.81% 20.95% Total Inventory $186,440 $229,380 $121,242 Total Inventory $168,440 $212,380 $81,242 Return on Inventory 14.03% 18.28% 10.50% Return on Inventory 15.53% 19.74% 15.67%
Table 4:
PROJECTED PROFIT AND LOSS (P&L) STATEMENTS
mated inventory reduction of $35,000. The expected result of all recommendations combined is an estimated inventory reduction of $207,000 and a 37% increase in overall ROI.
Process-Related Improvements
As illustrated previously, organizations typically imple-ment ABC-type systems to realize improved financial performance (based on improved pricing decisions, bet-ter product-mix decisions, improved cost control, etc.). ABC implementations, however, can provide additional benefits in the form of improved business processes. In the case of XYZ, process improvements in the account-ing and inventory control systems were attributed to the ABC implementation.
The starting point for establishing the flow of costs in an ABC system is the general ledger.11As noted earlier,
the general ledger at XYZ was reconfigured to accom-modate the ABC implementation. Redundant and relat-ed accounts (e.g., various factory overhead accounts) were combined to reduce the number of required calcu-lations, and singular income and cost-of-goods-sold accounts were disaggregated by product-family level. For example, the overall sales revenue account associat-ed with the old accounting system was split into multi-ple sales revenue accounts, one for each product family. Similarly, selected expense accounts (e.g., fringe bene-fits) were subdivided to obtain resource costs easily.12
All these changes represented improvements to the company’s accounting system and were related directly to the ABC implementation.
Another significant process change attributed to the ABC implementation was the institution of spending budgets. An ABC system is able to attribute costs to specific products or product families, but spending bud-gets are better equipped to manage costs. XYZ had been aware of the need to implement spending con-trols, but it lacked motivation. With a better under-standing of ROS and ROI because of the ABC imple-mentation, XYZ was now in a position to employ spending budgets to improve profitability.
The time and effort required to create the ABC mod-el made it evident that considerable changes to the management information system (MIS) at XYZ would be required to make the costing process efficient and
accurate. Problems with the existing MIS came primari-ly from information silos that existed throughout the company, making information gathering difficult.13
Sales revenues, manufacturing costs, and operating expenses were all maintained in separate systems. No cost information could be shared or reconciled electronically.
To eliminate the information silos and implement the new costing system effectively, the inventory con-trol and order-shipping processes at XYZ were incorpo-rated into the existing accounting information system. All inventory control functions are now performed in QuickBooks Enterprise Solutions.14This integration
process allows revenue information and manufacturing costs to be related to shipments, which extends the ABC information related to product families and distri-bution channels. In addition, all costing information now resides in one database.
LE S S O N S LE A R N E D
“Work is infinite; time is finite. Therefore, you must manage your time, not your work.”15Managing time for
an ABC implementation means managing the access, flow, and level of information. In this section, we offer some recommendations based on the ABC implementa-tion experience at XYZ.
When possible, reorganize the general ledger and income statement to accommodate ABC. The reorgani-zation of the financial information allows easy accessi-bility to data. Integrating vital information systems con-trols the flow of information and automates many of the required calculations needed to develop the ABC mod-el, thereby reducing the amount of time required to generate cost data. In addition, system integration improves data accuracy and the ability to replicate the information-generation process. Finally, when imple-menting an ABC model, it is important to embrace the concept of “good enough” when determining the required fineness of the data and for getting the ABC project off the ground. As General George S. Patton said, “A good plan, violently executed now, is better than a perfect plan next week.”
factors, including corporate culture, available informa-tion systems, and current financial performance, have a bearing on the ability of the ABC model to influence the organization’s decision-making process. XYZ’s decision-making process had been primarily subjective in nature, with little financial analysis. Thus, consider-able time was required to educate the decision team and board members on ABC, P&L statements, and ROI. Inefficient business processes at XYZ, information silos, and lack of information were obstacles that had to be overcome as part of the ABC model-creation process.
Finally, the most important lesson was that signifi-cant change does not occur without crisis. Or as Louis V. Gerstner, former chairman of IBM, put it: “No orga-nization is going to change in a fundamental way unless it believes there’s real pain staying the way we are.” XYZ was open to the recommendations from the deci-sion team because the company found itself in the midst of a crisis. Developing solutions before problems reach crisis proportions is most prudent, although the message may not be fully received.
BE N E F I T S O F CO S T-S Y S T E M RE D E S I G N
ABC systems are not meant solely for large companies. Small- to medium-sized companies, such as XYZ, can benefit from data provided by an ABC model. In the present case, the ABC information motivated business process changes (e.g., in accounting), reduced product complexity for several product lines (e.g., moving to the use of common components), and influenced changes in the company’s product mix (e.g., by highlighting underperforming products). Collectively, these changes helped improve cash flow, product and channel prof-itability, and the organization’s competitive position. ■
Gregory P. Bedenis, CPIM, is an MBA candidate in the Williams College of Business Administration at Youngstown State University in Youngstown, Ohio. You can reach Gregory at (330) 856-3231 or [email protected].
David E. Stout, Ph.D., is the Andrews Chair in Accounting in the Williamson College of Business Administration at Youngstown State University in Youngstown, Ohio. You can reach David at (330) 941-3509 or [email protected].
EN D N O T E S
1 Dividend payouts are made to the owners and select employ-ees on a quarterly basis.
2 Suzanne Caplan, Streetwise Finance & Accounting: How to Keep Your Books and Manage Your Finances without an MBA, CPA, or Ph.D., Adams Media Corporation, Avon, Mass., 2000. 3 One of the coauthors of this article.
4 Lee J. Krajewski, Operations Management: Strategy and Analysis, 6th ed., Pearson Education, Inc., Upper Saddle River, N.J., 2002.
5 Thus, the start-up of XYZ was probably similar to that of Apple Computer or Dell: Assembly began in someone’s garage, one product at a time, progressing to a multi-stage factory producing batches of products.
6 Kevin Devine, Tom Lammert, and Priscilla O’Clock, “Product Line and Customer ROI: The Next Generation of ABC,”
Management Accounting Quarterly, Fall 2005, pp. 1-11. 7 Peter B. B. Turney, Common cents: how to succeed with
activity-based costing and activity-activity-based management, rev. ed., McGraw-Hill, New York, N.Y., 2005, p. 94.
8 Anthony A. Atkinson, Robert S. Kaplan, and S. Mark Young,
Management Accounting, 4th ed., Prentice Hall, Upper Saddle River, N.J., 2004.
9 http://oesa.org/publications/articledetail.php?articleId=5142 (accessed September 13, 2007).
10 XYZ believed that few to no sales would be lost by eliminating off colors because competitors do not offer multiple color choices in this product category.
11 Turney, op. cit., pp. 268-269. 12 Ibid., pp. 270-271.
13 An “information silo” is a management system incapable of reciprocal operation with other, related management systems. For instance, order information, initially captured in the Inter-net shopping cart, must be rekeyed into the inventory control system to determine the build schedule for the assembly department.
14 Accounting software for small businesses from Intuit. 15 Kenneth Atchity, A Writer’s Time: Making the Time to Write, rev.