S H O R T R E P O R T
Open Access
Perceived usefulness of a distributed
community-based syndromic surveillance system: a pilot
qualitative evaluation study
Blaine Reeder
1*, Debra Revere
2, Donald R Olson
3and William B Lober
1,2,4Abstract
Background:We conducted a pilot utility evaluation and information needs assessment of the Distribute Project at the 2010 Washington State Public Health Association (WSPHA) Joint Conference. Distribute is a distributed community-based syndromic surveillance system and network for detection of influenza-like illness (ILI). Using qualitative methods, we assessed the perceived usefulness of the Distribute system and explored areas for improvement. Nine state and local public health professionals participated in a focus group (n = 6) and in semi-structured interviews (n = 3). Field notes were taken, summarized and analyzed.
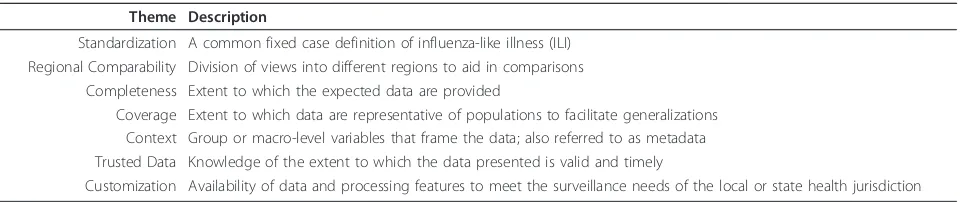
Findings:Several emergent themes that contribute to the perceived usefulness of system data and the Distribute system were identified: 1)Standardization:a common ILI syndrome definition; 2)Regional Comparability:views that support county-by-county comparisons of syndromic surveillance data; 3)Completeness:complete data for all expected data at a given time;4) Coverage:data coverage of all jurisdictions in WA state; 5)Context: metadata incorporated into the views to provide context for graphed data; 6)Trusted Data: verification that information is valid and timely; and 7)Customization:the ability to customize views as necessary. As a result of the focus group, a new county level health jurisdiction expressed interest in contributing data to the Distribute system.
Conclusion:The resulting themes from this study can be used to guide future information design efforts for the Distribute system and other syndromic surveillance systems. In addition, this study demonstrates the benefits of conducting a low cost, qualitative evaluation at a professional conference.
Introduction
Distribute is a community-based, population-level public health information system for syndromic influenza-like illness (ILI) surveillance that displays aggregated, de-identified, public health surveillance data collected from emergency departments (EDs) by state and local health jurisdictions [1]. Distribute was first organized by the International Society for Disease Surveillance (ISDS) in 2006 as a proof of concept. With support from the Mar-kle Foundation and the United States Centers for Dis-ease Control and Prevention (CDC), Distribute grew from participation by 8 state and large metropolitan health jurisdictions, representing summarized data on 10% of all US emergency department (ED) visits, to a
nation-wide system that currently receives data from 43 health jurisdictions that represents over 50% of the US population and summarizes more than 35% of all ED visits nationwide. Distribute currently has participation from all ten Health and Human Services (HHS) surveil-lance regions, includes data from over one million ED visits each week, and displays updated visualizations of ILI trends in the US on Public and Restricted access web sites.
Distribute serves as an example of a new paradigm in the collection and sharing of public health surveillance data [2]. The roots of automated syndromic surveillance systems began just prior to the 2001 Anthrax attacks [3] with systems which automatically classify clinic visits and other data according to loose “syndromic” criteria and present graphic and statistical views of summarized data based on counts of those visits, and their numbers in proportion to population and denominators derived * Correspondence: [email protected]
1
Biobehavioral Nursing and Health Systems School of Nursing, Box 359442 University of Washington, Seattle, WA 98195, USA
Full list of author information is available at the end of the article
from utilization of health care services. The literature describes both the early experience and growth of these systems [4] and their evolving design and implementation [5]. With the development of health information exchanges (HIEs), and of methods for the structuring of, and access to, regional data across multiple health care systems, public health gained access to larger sources of both visit level and summarized“syndromic”data [6]. In part, Distribute developed as a way for health depart-ments to share and compare these summarized, syndro-mic data, regardless of whether those data were obtained from integration of data from individual providers or hospitals, or from a single large hospital network or HIE.
In the early development of the Distribute project, the apparent benefits of mandated standards for syndrome definitions were weighed against two often overlooked issues: barriers to entry and ability to compare data across jurisdictions. The need to adopt a mandated stan-dard prior to joining the network created a potential technical barrier that could delay or prevent interested jurisdictions from participating. In addition, although mandated standard syndrome definitions could improve data comparison on average across the whole network, there was concern on the part of project participants that this practice might decrease accuracy and utility locally. That is, a local definition of a syndrome might best reflect local variations in coding or clinical practice that were reflected in the data, and might most accu-rately reflect the underlying disease being tracked. To address these issues, the Distribute project adopted the use of two separate syndromes: 1) a more narrow and specific definition, following a traditional clinical defini-tion of ILI, and 2) another more sensitive definidefini-tion, as a broad febrile, respiratory and influenza-like syndrome [7]. In a preliminary comparison, two Distribute partici-pating sites shared local coding of their narrow and broad ILI syndrome definitions and applied each other’s definitions to their own local data. The pilot findings suggested that data using locally applied syndromes were better correlated with population-level viral sur-veillance data [8,9].
Utility and Usability
Utility and usability issues are related and often difficult to separate in the evaluation of information systems [10,11]. Utility, or perceived usefulness, refers to the extent to which an information system or its output provides benefit or value [10-12]. Usability, or perceived ease of use, refers to the degree of effort required to use an information system or its output [10-12]. Many inter-national standards for system design conflate usability and utility, incorporating aspects of utility and usability in a single definition [13]. Because this project is not an interaction study, we focus on the utility, or perceived
usefulness, of the Distribute system and its data outputs while acknowledging that usability contributes to utility.
Current initiatives of the Distribute project place a high priority on improving the utility and usability of the information system and extending functionality to support public health decision-making and practice. Qualitative methods are important in the evaluation of health information systems [14-16]. It is important to engage practitioners in a discussion of their needs and proposed system features to mitigate common infor-matics risk factors for failed system adoption [17-19]. Following the idea that “the simplest way to assess use-fulness is to ask those involved in public health prac-tice”[20], we engaged epidemiologists and other public health practitioners in a pilot study to collect quality improvement feedback for the Distribute system. This pilot study was undertaken to inform the design of a larger quality improvement investigation by including participants who were current members of the Distri-bute community of practice and those interested in learning more about the Distribute system.
System Description
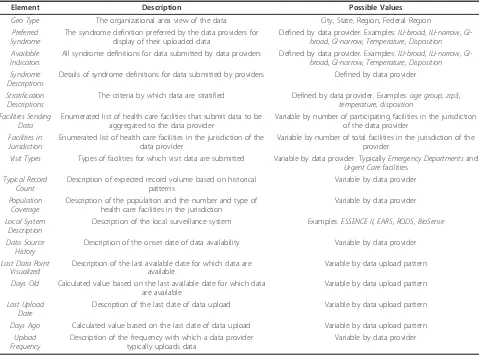
The objective of Distribute is to collect, analyze, and dis-play ILI surveillance data from across the United States. Another objective is to provide ways to compare the pro-gression of outbreaks of infectious disease between regions, and to enhance communication between health jurisdictions. Distribute displays summary level data from state and local health department ED surveillance sys-tems in two views: Public and Restricted. The Public site provides public access graphs of weekly trends in ratios of ILI syndromes to all ED visits. The restricted site requires secure authentication for access and provides greater granularity in the time series data, primary counts as well as ratios, multiple syndromes, information about data upload history and transmission details, data timeli-ness, detailed visualizations based on user-specified queries and metadata that includes background informa-tion about each data provider and details of syndrome definitions. This secure view of information about all data-providing jurisdictions is available to each partici-pating data provider on the restricted site. Distribute data providers upload data from existing surveillance systems, such as ESSENCE [21], EARS [22], RODS [23]and Bio-Sense [24], at local and state health jurisdictions along with provider-specified syndrome definitions. Table 1 shows selected metadata elements available to data provi-ders with restricted site access.
Methods Setting
Health on October 11-12, 2010 in Yakima, WA USA. The conference is an annual meeting of public health practitioners that includes participants from the Washington State Department of Health and local health jurisdictions in the State of Washington. The study protocol received approval from the University of Washington Institutional Review Board.
Participants
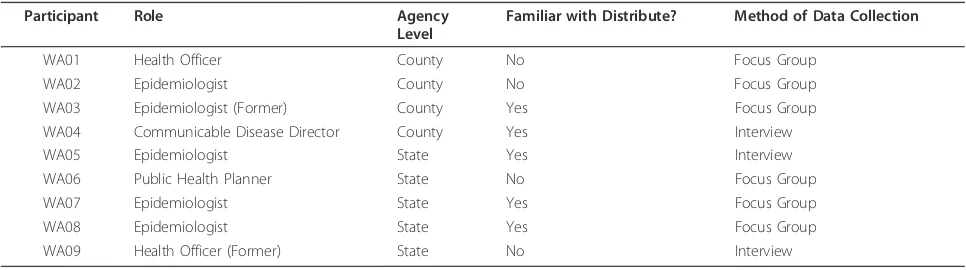
A total of nine public health practitioners participated, representing state- (n = 5) and county- (n = 4) level
public health organizations. Six participants attended a focus group and three participants engaged in brief interviews. Seven participants were current epidemiolo-gists, health officers or other public health practitioners while two participants were former epidemiologists or health officers. Regarding prior use and/or familiarity with Distribute, four participants had never seen or used Distribute and of the five who were familiar with Distri-bute, only two participants had access to the Restricted site. All participants were familiar with how surveillance data are used for public health purposes. Table 2 shows
a breakdown of study participants by role and data col-lection method.
Data Collection
We employed qualitative methods [25-27] to capture participants’perceived usefulness of data, data visualiza-tions and features of the Distribute system and solicit quality improvement feedback from participants: 1) a focus group discussion of the Distribute system during a scheduled presentation and 2) three brief, semi-struc-tured interviews with conference attendees who fit the profile of the target user group. Following a brief project background, participants were shown different views of graphed data for US Department of Human and Health Services (HHS) Regions from the Public site and Restricted site comparisons of graphed data from data providers in the Pacific Northwest for periods of time covering the 2009-2010 H1N1 and influenza seasonal time periods back to March 2009. Participants were asked to respond about perceived usefulness of views of graphed data and to discuss how they use surveillance data in their work. Focus group and interview Table 1 Selected metadata elements from the Restricted site of the Distribute system
Element Description Possible Values
Geo Type The organizational area view of the data City, State, Region, Federal Region
Preferred Syndrome
The syndrome definition preferred by the data providers for display of their uploaded data
Defined by data provider. Examples:ILI-broad, ILI-narrow, GI-broad, GI-narrow, Temperature, Disposition Available
Indicators
All syndrome definitions for data submitted by data providers Defined by data provider. Examples:ILI-broad, ILI-narrow, GI-broad, GI-narrow, Temperature, Disposition Syndrome
Descriptions
Details of syndrome definitions for data submitted by providers Defined by data provider
Stratification Descriptions
The criteria by which data are stratified Defined by data provider. Examples:age group, zip3, temperature, disposition
Facilities Sending Data
Enumerated list of health care facilities that submit data to be aggregated to the data provider
Variable by number of participating facilities in the jurisdiction of the data provider
Facilities in Jurisdiction
Enumerated list of health care facilities in the jurisdiction of the data provider
Variable by number of total facilities in the jurisdiction of the provider
Visit Types Types of facilities for which visit data are submitted Variable by data provider. TypicallyEmergency Departmentsand
Urgent Carefacilities
Typical Record Count
Description of expected record volume based on historical patterns
Variable by data provider
Population Coverage
Description of the population and the number and type of health care facilities in the jurisdiction
Variable by data provider
Local System Description
Description of the local surveillance system Examples:ESSENCE II, EARS, RODS, BioSense
Data Source History
Description of the onset date of data availability Variable by data provider
Last Data Point Visualized
Description of the last available date for which data are available
Variable by data upload pattern
Days Old Calculated value based on the last available date for which data are available
Variable by data upload pattern
Last Upload Date
Description of the last date of data upload Variable by data upload pattern
Days Ago Calculated value based on the last date of data upload Variable by data upload pattern
Upload Frequency
Description of the frequency with which a data provider typically uploads data
participants were asked the same types of questions. Those familiar with Distribute were asked questions about their perceptions of the system. Table 3 shows the types of questions asked of participants.
Figure 1 shows a comparison graph used during data collection. The data-providing jurisdictions in the graph are de-identified for publication. The graph shows ILI visit time-series ratios of syndromic ED surveillance data during March 2009 through April 2010 from two Northwest US jurisdictions (Sites A and B) participating in Distribute. The ratios presented are ILI syndrome vis-its over total visvis-its using syndrome definitions that are jurisdiction-specific and not standardized. While the absolute ILI levels are not directly comparable, the tim-ing and relative magnitude show ILI trends representtim-ing the emergence and early spring wave of the influenza A/ H1N1 pandemic and its autumn 2009 return.
Data Analysis
Notes taken by Distribute team members during the focus group and interviews were summarized and ana-lyzed to identify patterns and themes [28,29]. Study notes were stripped of identifying information before analysis. Conference attendees were referred to by role and an assigned study code. Specific data extracted from
study notes pertained to opinions of conference atten-dees about usefulness, suggested features and other recommendations for improvement of the Distribute system. Themes were identified from focus group and interview notes by grouping similar responses and creat-ing names and descriptions of the groupcreat-ings [26,28].
Results
Overall, participants were engaged and positive about Distribute as a community-based network and syndro-mic surveillance system. Data analysis resulted in the emergent themes, which are displayed in Table 4 along with brief descriptions of each theme.
With regard to standardization, participants recog-nized a need for a common influenza-like illness (ILI) syndrome definition in order to make comparisons between data sets more meaningful and relevant. For regional comparability, participants wanted to see views of different regions to aid in comparisons. In particular, they expressed a desire for views that support county-by-county comparisons of syndromic surveillance data, separate regional views of Western Washington and Idaho and views by preparedness regions as an alterna-tive if representaalterna-tive views of HHS Regions were unavailable.
The completeness theme is described by participant desire for completeness in the data sets submitted from each data provider. Coverage refers to participant desire to know that data are representative of a given tion in order to generalize findings across the popula-tion. In particular, participants expressed a need for data coverage of all Washington State. Participants noted that during the second wave of H1N1, the eastern side of the state, which includes one-third of the population, initi-ally saw two-thirds of all cases (consistent with the graph of data for Eastern Washington in Distribute). One participant noted minimal use of Distribute due to lack of close neighbors for comparison. Context refers to the expressed need for metadata incorporated into views to facilitating understanding of graphed data. Table 2 Study participants by role, agency level, familiarity with Distribute and method of data collection
Participant Role Agency
Level
Familiar with Distribute? Method of Data Collection
WA01 Health Officer County No Focus Group
WA02 Epidemiologist County No Focus Group
WA03 Epidemiologist (Former) County Yes Focus Group
WA04 Communicable Disease Director County Yes Interview
WA05 Epidemiologist State Yes Interview
WA06 Public Health Planner State No Focus Group
WA07 Epidemiologist State Yes Focus Group
WA08 Epidemiologist State Yes Focus Group
WA09 Health Officer (Former) State No Interview
Table 3 Types of questions asked of focus group and interview participants
•What does this graph tell you?
•What might be missing from this graph?
•Would graphed data like these have been useful during the 2009-2010 influenza A/H1N1 season?
•Would graphed data like these be useful during seasonal influenza time periods?
•Is this a good way to display the data?
•How might this graph be more useful?
•What do you like about Distribute?
•How useful is Distribute?
Participants suggested inclusion of the number of hospi-tals, emergency departments, patients, data providers and denominators for the total number of ED visits as contextual information in the graphed data views.
Participants expressed a need for trusted data, that is, confidence that data are valid and timely. They wanted to know that data were verified through defined quality assurance processes that are conducted on a regular basis. Participants reported that these data are useful for consistent events such as seasonal influenza and local data could be used to declare a local epidemic. Consis-tent, reliable data were cited as more useful to stand-down from an emergency than to issue an initial alert; participants hypothesized that during H1N1 the data in Distribute might have been more useful after confirma-tion of an actual event occurrence. Customizaconfirma-tion of available data and data processing capabilities to meet the surveillance needs of each local and state health jur-isdiction was requested by participants. The ability to overlay graphs with other graphs and create labels on request was envisioned as a useful feature.
Participants acknowledged the value of the Public site as a tool to view national trends. One participant cited the need for a surveillance system with a low-impact training cost that anyone can use and that is largely
automated to minimize maintenance. Requests for addi-tional data viewed as overlays to graphs included: meta-data already available elsewhere in the system, county school absenteeism rates and state view that included data from all clinics in the Group Health Cooperative health care system. An additional result of the focus group was the expressed desire to participate as a data contributor by one participant from a county-level health jurisdiction.
Limitations
The limitations of this pilot study include its restricted time frame for data collection and the regional popula-tion from which the sample is drawn.
Conclusion
Our results suggest themes that can be used to guide future evaluation and design iterations to improve sup-port for public health surveillance. These results are important for improvements to syndromic surveillance of influenza-like-illness in the Distribute system but can also help improve syndromic surveillance efforts overall, regardless of the disease or surveillance system. For example, gastrointestinal (GI) indicators are currently
being piloted in the Distribute system as a
Figure 1De-identified jurisdiction comparison showing the emergence and return of pandemic A/H1N1 influenza, March 2009-April 2010.
Table 4 Themes that contribute to information system and data usefulness
Theme Description
Standardization A common fixed case definition of influenza-like illness (ILI) Regional Comparability Division of views into different regions to aid in comparisons
Completeness Extent to which the expected data are provided
Coverage Extent to which data are representative of populations to facilitate generalizations Context Group or macro-level variables that frame the data; also referred to as metadata Trusted Data Knowledge of the extent to which the data presented is valid and timely
demonstration of system extensibility for surveillance of other diseases. Themes from this qualitative evaluation study can inform GI syndromic surveillance efforts as they are expanded within Distribute or any other sur-veillance system. These themes should be further explored by including public health practitioners in information design efforts. In addition, this study demonstrates that the application of qualitative methods in an “evaluation of opportunity” at a public health practice gathering can be a simple way to solicit feed-back for the improvement of a working public health information system. Lastly, we found that efforts of this type can be useful in recruiting new users to participate in the system and expand the community of practice.
The community-based approach employed in the Dis-tribute project focuses on data use and has resulted in convergence toward a recognized need for a common influenza-like illness (ILI) syndrome definition to com-pare data sets across jurisdictions among the Distribute community of practice. The findings of this pilot study are consistent with this trend. However, to maintain local utility of data, existing data providers need not, and should not, abandon prior syndrome definitions, but rather should submit an additional common defini-tion while continuing to send data aggregated by exist-ing syndrome definitions that have local meanexist-ing.
Syndromic surveillance data, if available, are used by public health practitioners as early indicators of influenza outbreaks within their own jurisdictions and adjacent health jurisdictions. These data are used in conjunction with other data sources, such as laboratory results, to tri-angulate disease prevalence. To aid decision-making for interventions that help contain outbreaks, improved data access and visualizations for syndromic surveillance data are needed. The context of how data are used for indivi-dual tasks is important [30,31] and data quality cannot be assessed independent of the people who use them [32]. Information systems are part of the contexts of use for data; the utility and usability of these systems are factors in the utility and usability of data [13,33,34]. Three con-texts of use for syndromic surveillance information systems routine, anticipated threat and present threat -have been recognized as key inputs to tasks for analysis and characterization of syndromic surveillance data for decision-making [35]. In addition, our pilot results indi-cate contextual information - metadata related to hospitals, patients, data providers, ED visit counts, etc. -provides meaning of syndromic surveillance data to epidemiologists.
To better understand contexts of information system and data use, future efforts should identify the specific ways in which epidemiologists and others use metadata to discern meaning from data, the best ways to include annotations in data visualizations and different ways to
display information for population health surveillance. Interviews with a larger number of participants will help refine the specific meanings of our themes, gauge reac-tions to anticipated results from common ILI syndrome definition efforts and explore specific needs around regionalization and other identified themes. Future work to engage a more geographically diverse population of participants will help validate these results outside the pilot region of Washington State. This future work will be informed by pilot results in two related areas: 1) usability studies to improve the design of Distribute as an information resource that an epidemiologist might check before making a phone call to a colleague in a dif-ferent jurisdiction or region and 2) utility studies to assess the value of Distribute to participants, their orga-nizations and community population health outcomes.
Acknowledgements
The authors gratefully acknowledge the International Society for Disease Surveillance as the financial sponsor of this study and the Markle Foundation and CDC for supporting the Distribute project. We thank Rebecca Hills, PhD (Cand.), MSPH for her contributions during the study and Laura Streichert, PhD, MPH and Janet Baseman, PhD, MPH for their comments on drafts of the manuscript. We also thank the two reviewers of this manuscript for their helpful suggestions. This study would not have been possible without the public health professionals who donated their time to share information about their work and participation of the Distribute community of practice.
Author details
1Biobehavioral Nursing and Health Systems School of Nursing, Box 359442
University of Washington, Seattle, WA 98195, USA.2Department of Health Services School of Public Health, Box 354943 University of Washington, Seattle, WA 98195, USA.3International Society for Disease Surveillance 26 Lincoln Street, 3 Brighton, MA 02135, USA.4Medical Education and
Biomedical Informatics School of Medicine, Box 357240 University of Washington, Seattle, WA 98195, USA.
Authors’contributions
BR conceived of and implemented the study design with DR, acted as investigator/observer, collected and analyzed data and authored the overall manuscript. DR conceived of and implemented the study design with BR, authored the protocol, acted as investigator, collected and analyzed data and authored the overall manuscript. DRO contributed expertise and manuscript content related to the Distribute project and common ILI definitions. WBL contributed expertise and manuscript content about informatics and syndromic surveillance. All authors read and approved the final manuscript.
Competing interests
All authors declare financial support from the International Society of Disease Surveillance. The authors declare that they have no other competing interests.
Received: 18 February 2011 Accepted: 14 June 2011 Published: 14 June 2011
References
1. Olson DR, Paladini M, Buehler J, Mostashari F:Review of the ISDS Distributed Surveillance Taskforce for Real-time Influenza Burden Tracking & Evaluation (DiSTRIBuTE) Project 2007/08 Influenza Season Proof-of-concept Phase.Advances in Disease Surveillance2008,5:185. 2. Diamond CC, Mostashari F, Shirky C:Collecting And Sharing Data For
Population Health: A New Paradigm.Health affairs2009,28:454. 3. Lober WB, Karras BT, Wagner MM, Overhage JM, Davidson AJ, Fraser H,
detection: information system-based surveillance.J Am Med Inform Assoc
2002,9:105-115.
4. Mandl KD, Overhage JM, Wagner MM, Lober WB, Sebastiani P, Mostashari F, Pavlin JA, Gesteland PH, Treadwell T, Koski E,et al:The Practice of Informatics - Review Paper - Implementing Syndromic Surveillance: A Practical Guide Informed by the Early Experience.Journal of the American Medical Informatics Association: JAMIA2004,11:141.
5. Lober WB, Trigg L, Karras B:Information system architectures for syndromic surveillance.MMWR Morb Mortal Wkly Rep2004,
53(Suppl):203-208.
6. Hills RA, Lober WB, Painter IS, Workshop:Biosurveillance, Case Reporting, and Decision Support: Public Health Interactions with a Health Information Exchange.2008.
7. Olson DR, Heffernan RT, Paladini M, Konty K, Weiss D, Mostashari F:
Monitoring the Impact of Influenza by Age: Emergency Department Fever and Respiratory Complaint Surveillance in New York City.PLoS Med2007,4:e247.
8. Pendarvis J, L. ME, Paladini M, Gunn J, Olson DR:Age Specific Correlations between Influenza Laboratory Data and Influenza-like Syndrome Definitions in Boston and New York City.Advances in Disease Surveillance
2008,5:53.
9. Paladini M, Pendarvis J, Murray EL, Gunn J, Olson DR:A Comparison of Locally Developed Influenza-like Syndrome Definitions Using Electronic Emergency Department Data in Boston and New York City.Advances in Disease Surveillance2008,5:50.
10. Grudin J:Utility and usability: research issues and development contexts. Interacting with Computers1992,4:209-217.
11. McLaughlin J, Skinner D:Developing Usability and Utility: A Comparative Study of the Users of New IT.Technology Analysis & Strategic Management
2000,12:413-423, Routledge; 413-423.
12. Davis FD:Perceived Usefulness, Perceived Ease of Use, and User Acceptance of Information Technology.MIS Quarterly1989,13.
13. Bevan N:International standards for HCI and usability.International Journal of Human-Computer Studies2001,55:533-552.
14. Ash JS, Guappone KP:Qualitative evaluation of health information exchange efforts.Journal of Biomedical Informatics2007,40:S33-S39. 15. Rose AF, Schnipper JL, Park ER, Poon EG, Li Q, Middleton B:Using
qualitative studies to improve the usability of an EMR.Journal of Biomedical Informatics2005,38:51-60.
16. Hill HK, Stewart DC, Ash JS:Health Information Technology Systems profoundly impact users: a case study in a dental school.Journal of dental education2009,74:434-445.
17. Wells S, Bullen C:A near miss: the importance of context in a public health informatics project in a New Zealand case study.Journal of the American Medical Informatics Association: JAMIA2008,15.
18. Littlejohns P, Wyatt JC, Garvican L:Evaluating computerised health information systems: hard lessons still to be learnt.BMJ2003,
326:860-863.
19. Heeks R:Health information systems: Failure, success and improvisation. International journal of medical informatics2006,75:125.
20. Thacker SB, Parrish RG, Trowbridge FL:A method for evaluating systems of epidemiological surveillance.World health statistics quarterly Rapport trimestriel de statistiques sanitaires mondiales1988,41:11-18.
21. Lombardo J, Burkom H, Elbert E, Magruder S, Lewis SH, Loschen W, Sari J, Sniegoski C, Wojcik R, Pavlin J:A systems overview of the Electronic Surveillance System for the Early Notification of Community-Based Epidemics (ESSENCE II).Journal of urban health: bulletin of the New York Academy of Medicine2003,80:32-42.
22. Hutwagner L, Thompson W, Seeman GM, Treadwell T:The Bioterrorism Preparedness and Response Early Aberration Reporting System (EARS). Journal of Urban Health: Bulletin of the New York Academy of Medicine2003,
80:89-96.
23. Tsui FC, Espino JU, Dato VM, Gesteland PH, Hutman J, Wagner MM:
Technical description of RODS: a real-time public health surveillance system.Journal of the American Medical Informatics Association2003,
10:399-408.
24. Bradley CA, Rolka H, Walker D, Loonsk J:BioSense: Implementation of a National Early Event Detection and Situational Awareness System.IMMW MMWR Morbidity & Mortality Weekly Report2005, 11-19.
25. Blomberg J, Giacomi J, Mosher A, Swenton-Wall P:Ethnographic Field Methods and Their Relation to Design.InParticipatory design: principles
and practices.Edited by: Schuler D, Namioka A. Hillsdale, N.J.: L. Erlbaum Associates; 1993:123-155.
26. Krueger RA, Casey MA:Focus groups: a practical guide for applied research
Thousand Oaks, Calif.: Sage Publications; 2000.
27. Ulin PR, Robinson ET, Tolley EE:Qualitative methods in public health: a field guide for applied researchSan Francisco, CA: Jossey-Bass; 2005.
28. Boyatzis RE:Transforming qualitative information: thematic analysis and code developmentThousand Oaks, CA: Sage Publications; 1998.
29. Miles MB, Huberman AM:Qualitative data analysis: an expanded sourcebook
Thousand Oaks: Sage Publications; 1994.
30. Wang RY, Strong DM:Beyond Accuracy: What Data Quality Means to Data Consumers.Journal of management information systems: JMIS1996,
12:5.
31. Bevan N:Quality in use: Meeting user needs for quality.JSS Journal of Systems & Software1999,49:89-96.
32. Strong DM, Lee YW, Wang RY:Data Quality in Context.Communications of the ACM1997,40:103.
33. Orr K:Data quality and systems theory.Commun ACM1998,41:66-71. 34. Boddy D, King G, Clark JS, Heaney D, Mair F:The influence of context and
process when implementing e-health.BMC Medical Informatics & Decision Making2009,9:1-9, BioMed Central; 1-9.
35. International Society for Disease Surveillance (ISDS) Meaningful Use Workgroup:Final Recommendation: Core Processes and EHR Requirements for Public Health Syndromic Surveillance.2010.
doi:10.1186/1756-0500-4-187
Cite this article as:Reederet al.:Perceived usefulness of a distributed community-based syndromic surveillance system: a pilot qualitative evaluation study.BMC Research Notes20114:187.
Submit your next manuscript to BioMed Central and take full advantage of:
• Convenient online submission
• Thorough peer review
• No space constraints or color figure charges
• Immediate publication on acceptance
• Inclusion in PubMed, CAS, Scopus and Google Scholar
• Research which is freely available for redistribution