LAND USE/COVER CHANGE AND VULNERABILITY EVALUATION IN OLOMOUC,
CZECH REPUBLIC
M. S. Boori1,2*, V. Vozenilek1, K. Choudhary1
1
Palacky University Olomouc, 17. listopadu 50, 771 46 Olomouc, Czech Republic. [email protected],[email protected] 2
Dept. of Environmental Science and Civil Engineering, JECRC University, Jaipur – Rajasthan, India. [email protected]
Commission VI, WG VI/4
KEY WORDS: Remote Sensing, GIS, Spatial Principal Component Analysis (SPCA), Environment Vulnerability
ABSTRACT:
This research work analyse environmental vulnerability evaluation from 1991 to 2013 in Olomouc, Czech Republic. Remote sensing (RS) and geographical information system (GIS) technology were used to develop an environmental numerical model for vulnerability evaluation based on spatial principle component analysis (SPCA) method. Land use/cover changes shows that 16.69% agriculture, 54.33% forest and 21.98% other areas (settlement, pasture and water-body) were stable in all three decade. Approximately 30% of the study area maintained as a same land cove type from 1991 to 2013. Based on environmental numerical modal an environmental vulnerability index (EVI) for the year of 1991, 2001 and 2013 of the study area were calculated. This numerical model has five thematic layers including height, slope, aspect, vegetation and land use/cover maps. The whole area vulnerability is classified into four classes: slight, light, medial and heavy level based on cluster principle. Results show that environmental vulnerability integrated index (EVSI) was continuously decreased from 2.11 to 2.01 from the year 1991 to 2013. The distribution of environmental vulnerability is vertical and present heavy in low elevation and slight in high elevation. The overall vulnerability of the study area is light level and the main driving forces are socio-economic activities.
* Corresponding author. This is useful to know for communication with the appropriate person in cases with more than one author.
1. INTRODUCTION
Environmental vulnerability evaluation is characterizing the vulnerability and resilience of socio-ecological systems exposed to environmental hazards. Previous research developed many methods such as fuzzy evaluation method (IPCC, 2001; Boori & Vozenilek, 2014; Adriaenssens et al., 2004) the gray evaluation method (Boori & Vozenilek, 2014; Enea & Salemi, 2001) along with the artificial neural-network evaluation method (Boori & Ferraro, 2013) and the landscape evaluation method (Hao & Zhou, 2002; Boori & Amaro, 2011; Fazey et al., 2010). These methods are based on quantitative analysis and their variables are not easy to acquired or operated in the model. However, advancement in remote sensing, GIS and numerical modelling techniques is a powerful tool for environmental vulnerability assessment (Boori & Vozenilek, 2014).
Since last three decades in Olomouc from 1991 to 2013, land cover has transformed dramatically due to socio-economic activities and extraction of natural resources (Antonio et al., 2003). Unlimited or unwanted exploitation of natural resources reduces their sustainability limit and this has become a cause of serious concern for the government and the people of Czech Republic. Recently land use/cover studies have attracted wide variety of researcher, ranging from those who are modelling the spatial and temporal patterns of land conversion, to those who try to understand the causes and consequences of land use changes (Boori & Ferraro, 2012; Kangas et al., 2000; Boori et al., 2012).
Remote sensing, GIS and numerical modelling techniques played a great role in extraction and preparation of the environmental vulnerability evaluation attributes (Burgi et al., 2004). The major objective of this study is to evaluate the
environmental vulnerability in a typical mountainous region characterized by apparent vertical-belt features. Both natural and human induced attributes were considered (Boori & Amaro, 2011). The land use and vegetation cover maps were derived from landsat TM and ETM+ data with a resolution of 25-30m through classification and interpretation of the land cover features (Irwin & Geoghegan, 2001). Terrain characteristics namely slope; elevation and aspects were derived from Digital Elevation Model (DEM). The specific objectives of this study were to (i) measure the quality and quantity of LUCC; (ii) evaluate the vulnerability of environment during three intermediary periods from 1991 to 2013; (iii) elucidate changing trends of vulnerability in terms of location, intensity and the nature of the threats; (iv) an environmental numerical evaluation model was set up supported by GIS; (v) the spatial principal component analysis (SPCA) was developed to build an environmental vulnerability index (EVI) model and the computed result is classified using the cluster principle; (vi) the spatial distribution and its change of environmental vulnerability were analysed and driving forcing for change are discussed. (vii) the regionalization is worked out as the basis for environmental rebuilding planning (Boori & Amaro, 2011).
2. MATERIALS AND METHODS 2.1 Study area
The study area cover Olomouc Region, which is located in north-eastern Czech Republic between 49°45´ N, and 17°15´ E (Fig. 1). The border between the Olomouc region and Poland in the north is 104 km long. The other neighbours are the Moravskoslezský Region in the east, the Zlín Region and the Jihomoravský Region in the south and the Pardubický Region in the west. The geographical layout of the region is rather ISPRS Annals of the Photogrammetry, Remote Sensing and Spatial Information Sciences, Volume II-8, 2014
unusual. There are lowlands at the Polish borders, followed by the Jeseníky mountain range with Praded (map) as highest mountain (1.492 m above sea level), while the southern part (again) comprises lowlands – the flat and fertile land of Haná. This region is one of the most fertile areas of the Czech Republic. Its elevation is 219 m (719 ft) and total area is 103.36 km2. Its total population is 101,003 with 987/km2 density.
Figure 1. Study area: Jeseniky mountain region, Olomouc.
This region is characterised by coniferous forest (Pinus sylvestris L.and Picea abies L. Karst.) and large aapa mires. Deciduous trees mainly Betula spp. occur to a lesser extent and located in the northern boreal vegetation zone. Highest fells and alpine vegetation are found in the north-western part of the study region in the Jeseniky mountain area. A large number of lichen pastures with forest are located in the eastern and north-eastern mountainous part of the Olomouc region. The most important late winter pastures with arboreal lichens are located in the western, central and southern parts of the Olomouc Region (Bao & Wang, 2000). Summer and autumn pasture with vegetation are consisting in mires, lake and riversides. Moist forest and fresh forest are present in the north-eastern, south-western, eastern and western parts of the Olomouc Region (Boori & Amaro, 2010).
2.2 Data
NASA Landsate TM and ETM+ data (1991, 2001 & 2013) were used for vulnerability evolution. ArcGIS 10.1 software was used for all image preparation, spatial analysis and mapping. The data of land use and vegetation is derived from landsat data by user-computer interactive interpreting method. Elevation and slope maps were generated from DEM. Topographic database provides the most accurate and uniform information for map products, which covering the entire country, so geographic corrections were performed on the base of topographic sheets and then registered (UTM WGS84) all images. 26 ground control points (GCPs) were used for registration. All GCPs were dispersed throughout the scene, yielding a RMS error of less than 0.5 pixels. The photographs were acquired with a frame camera that was designed to support mapping, charting and geodesy in addition to two high-resolution cameras. The ground-truth data required for visual interpretation and accuracy assessment of IRS images was collected from the field in April, 2014. Socio-economic information and natural resource use pattern of the local communities was generated using questionnaire method.
2.3 Land use/cover analysis
The terrain complexity complicates the interpretation of spectral signatures in land use/cover mapping and changes. Which were
influenced by elevation, aspect, and slope; this could lead to similar objects showing different reflectance and/or the different objects presenting the same reflectance, especially in dark shadow areas (Parinet et al., 2004). So in visual image interpretation techniques, it’s used a combination of subjective and objective methods. Ground truth information was used in doubtful areas during image interpretation. The hydrological DEM was generated from contour and drainage layers in ArcInfo using topogrid tool. Slope and aspects were derived from the DEM and then changes were studied along all the topographic parameters using matrix functions (Boori et al., 2014).
Class Area % Area % Area % Area Diff. % Diff. Area Diff. % Diff. Area Diff. % Diff. Water 209.85 10.49 243.77 12.19 298.85 14.94 33.92 1.70 55.08 2.75 89.00 4.45 Forest 804.02 40.20 581.49 29.07 715.61 35.78 -222.53 -11.13 134.12 6.71 -88.42 -4.42 Settlement 29.87 1.49 26.42 1.32 43.55 2.18 -3.45 -0.17 17.13 0.86 13.68 0.69 Pasture 213.03 10.65 301.75 15.09 160.09 8.00 88.72 4.44 -141.66 -7.08 -52.94 -2.64 Agriculture 743.23 37.16 846.57 42.33 781.90 39.09 103.34 5.17 -64.67 -3.23 38.67 1.93 Total 2000.00 100.00 2000.00 100.00 2000.00 100.00 Land use/cover changes
1991-2001 2001-2013 1991-2013 1991 2001 2013
Table 1. Land cover areas (km2) changes for 1991, 2001 and 2013.
1999 2001
2013
land use/cover
Agriculture Cultivated Agriculture Uncultivated Pasture
Settlements Forest Water Body
Figure 2. Land Cover change for 1991, 2001 and 2013.
Agriculture and forested land makes up the largest percent of the study area with 35%, 40%, area in 1991 and vice versa in 2013 (Table 1). Forest makes up the largest land-cover, and occurs predominantly in the more upland areas with greater relief (fig. 2). Forest area was decrease (222.53 km2) slightly during the first half of the study period but then increase (35.78 km2) during the second half of the study. Water makes up less than 15% of the upland landscape for all years of the study. Table 1 provides the areas of each class. The total area of the study was 2000 km2. From 1991 to 2001, there has been a net decrease of forest is 11.13%. But in 2001 to 2013, 6.71% forest ISPRS Annals of the Photogrammetry, Remote Sensing and Spatial Information Sciences, Volume II-8, 2014
area was added. Pasture and agriculture was added 4.44% and 5.17% respectively from 1991 to 2001 but both area reduce (7.08% and 3.23% respectively) from 2001 to 2013. From 1991 to 2013 forest and pasture area was reduces (4.42% and 2.64% respectively). Where agriculture and settlements increased 1.93% and 0.69% from 1991 to 2013, here total water body area was highest increased around 4.50% from 1991 to 2013 (fig. 2). These changes show governmental protection of forest area in between 2001 to 2013. Table 1 show that no change in number of settlements from 1991 to 2001 but for next decay settlements and water body area was increased.
2.4 Evaluation principle and factors
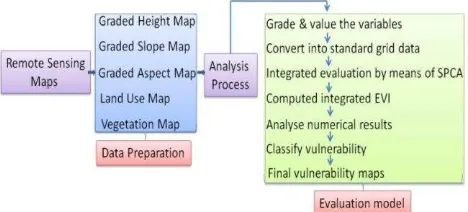
For environmental vulnerability assessment, there is a need to determine the factors which pose negative impact on ecosystem and make sensitive the system. Following thematic layers were used for environmental vulnerability analysis: slope, aspects, height, vegetation and land use/cover maps. The whole vulnerability analysis work grouped in two parts first data preparation and second evaluation model. In first part: standardised maps were reclassified and recorded in raster maps. The principal component analysis (PCA) method, which using coefficients of linear correlation were used for the possibility weight of contributed factors (Wotling et al., 2000; Boori & Vozenilek, 2014; Li et al., 2005). This study has developed an environmental vulnerability evaluation (EVE) model by spatial principal component analysis (SPCA) method, which is a modified PCA approach, whose schematic representation is shown in Fig. 3.
Figure 3. Schematic representation of numerical model of environmental vulnerability evaluation by means of spatial principal component analysis.
The processes of environmental vulnerability evaluation by SPCA method are explained as follows: (1) to standardize primary data; (2) to establish a covariance matrix R of each variable; (3) to compute an eigenvalue λi of matrix R and its corresponding eigenvectors αi; (4) to group αi by linear combination and put out m principal components. According to the cumulative contribution of principal components, the number of components was affirmed 6 and SPCA was accomplished. Then, an evaluation function (Boori, 2010) was setup for computing an integrated evaluation index on the basis of selected components shown as below:
(1)
Where, Yi is no. i principal component, and αi is its corresponding contribution.
According to each component’s weight and generated stack, the algebra computation is worked out and evaluation indexes are put out pointing the situation of regional environmental
vulnerability, defined in this paper as environmental vulnerability index (EVI). The higher the EVI value, the more vulnerable environment is.
Selected principal components
I II III IV V VI
1991
Eigenvalue 366.8 23.7 10.3 1.06 0.62 .05 Percent of Eigen 81.10 5.90 2.56 0.26 0.15 0.01 Accumulative of
Eigen Values
81.10 87.0 89.5 90.8 93.9 95.0
2001
Eigenvalue 824.0 100 24.9 9.55 2.64 .95 Percent of Eigen 85.63 10.4 2.59 0.99 0.27 0.09 Accumulative of
Eigen Values
85.63 86.0 88.6 91.6 94.9 95.1
2013
Eigenvalue 720.0 76.4 20.8 5.43 1.80 .80 Percent of Eigen 80.60 8.40 2.57 0.81 0.20 0.05 Accumulative of
Eigen Values
80.60 86.4 89.0 91.7 93.9 95.5
Table 2. the results of spatial principal component analysis in the study
Derived from Table 2 and formula (1), the linear formulas for computing EVI is created as follows:
In the formula, EVI is environmental vulnerability index, A1– A6 are six principal components sorted out from five initial spatial variables in 1991. Similarly, B1–B6 are principal components in 2001 and C1–C6 are the ones in 2013. The cumulative contribution of the six components is 95% (1991a), 95.10% (2001b) and 95.56% (2013c), respectively. Each of them lays in 95%, which accord with the convention of choosing factors by PCA method with a high reliability. However, there is still an information loss of about 5% when the number of selected components reaches six, which shows that the initial factors have relatively independent function on evaluation.
2.5 Vulnerable gradation using cluster principle
Evaluation level
Num
ber EVI Feature description Slight
vulnerability I > 1.5
Relatively stable ecosystem and anti-interference ability, healthy dense vegetation and low altitude
Light
vulnerability II 1.5-2
Relatively unstable ecosystem and poor anti anti-interference ability complex vegetation distribution
Medial
vulnerability III 2-2.5
Unstable ecosystem, medial human interference, dominated by alpine shrub grass
Heavy
vulnerability IV 2.5 <
Extremely unstable ecosystem, high socio-economic activities, degraded forest
Table 3. The result of environmental vulnerability classification in the Olomouc region.
The EVI obtained by integrated vulnerability index calculation was a continuous value. To quantify the environmental vulnerability, the value was classified using the cluster principle and four classes were identified: Slight, light, Medial and Heavy vulnerability (Table 3).
2.6 Vulnerability change trend
The change trend of environmental vulnerability was analysed based on two approaches. First is qualitative approach, in that vulnerability values were divided qualitatively into grades: 1.Slight, 2.light, 3.Medial and 4.Heavy vulnerability. The analysis of vulnerability change trends for different years based on the grades of vulnerability was based on the area and area percent, occupied by each vulnerability grade. Secondly a quantitative approach in that the application of the weighted are sum of vulnerability values. The value obtained by calculating the total integrated environmental vulnerability index (EVSI) for each year using the function given by (Luers, 2005; Boori & Amaro, 2010) as shown in eq. 3.
(3)
In this formula, n is the number of valuation grade, EVSIj the EVSI in unit j, Ai the occupied area of grade i in analysis unit j, Sj the area of analysis unit j, and Pi is the graded value of grade i.
In general, the whole change trend can be worked out from change of EVSI value. This paper analyses the change trend through comparing the EVSI value of each period and the distribution of each level.
3. RESULT AND DISCUSSION
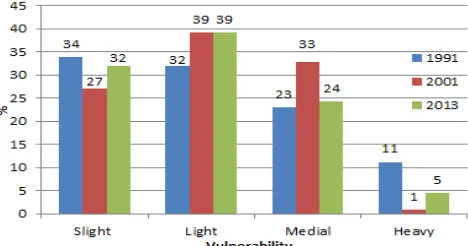
Table 3 presents characteristic of environmental vulnerability level and EVI. Stability is the main parameter for environmental vulnerability levels. The calculated values of EVSI of the study area for each year and percentage area of each vulnerability levels are presented in Table 4. Change trends show that EVSI decrease continuously from 2.11 to 2.01 from the year of 1991 to 2013. Results show that: (a) during 1991 and 2001, slight and heavy vulnerability levels had decreased by 33.83% to 27.16% and 11.20% to 0.85% respectively. Where light and medial vulnerability increased 31.95% to 39.20% and 23.02% to 32.79% respectively. (b) During 2001 to 2013, slight and heavy vulnerability increased by 27.16% to 32.04% and 0.85% to 4.55% respectively. However, in the same period light and moderate vulnerability were decrease from 39.20% to 39.15% and 32.79% to 24.26% respectively. Medial environmental vulnerability was shown in entire three decade period.
Vulnerability
Area % EVSI Area % EVSI Area % EVSI
Slight 676.69 33.83 543.15 27.16 640.86 32.04
Light 638.96 31.95 784.07 39.20 782.96 39.15
Medial 460.37 23.02 655.75 32.79 485.26 24.26
Heavy 223.98 11.20 17.03 0.85 90.92 4.55
Total 2000.00 100.00 2000.00 100.00 2000.00 100.00
1991 2001 2013
2.11 2.07 2.01
Table 4. Computed results from formula 3 and percentage area of each vulnerability level.
3.1 Vulnerability grade
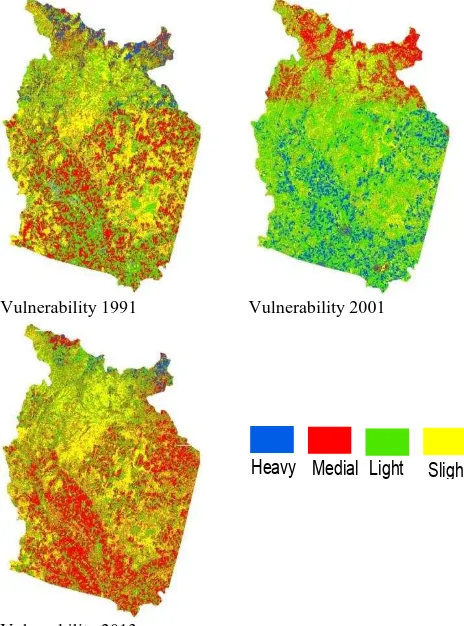
Vulnerability evaluation showed in figure 4 and 5 for the year 1991, 2001 and 2013. The general environmental vulnerability trend shown in table 4 that the situation in 2013 with an EVSI 2.01 is better than 2001 with an 2.07 and latter is better than 1991 with an 2.11. The high value of EVSI means more serious situation. It show that the light vulnerable zone lies within average-value range with the largest area proportion accounting for 31.95%, the medial vulnerable zone account for 23.02%, the slight vulnerable zone account for 33.83%, and the heavy vulnerable zone accounts for 11.20%. The profile of index shows an asymmetry normal distribution and the centre of profile lean to “medial” level in 1991, shown in Fig. 4. In 2001 slight, light, medial and heavy vulnerability was 27.16%, 39.20%, 32.79% and 0.85% respectively. And in 2013 slight, light, medial and heavy vulnerability was 32.04%, 39.15%, 24.26% and 4.55% respectively.
Vulnerability 1991 Vulnerability 2001
Vulnerability 2013
Heavy Medial Light Slight
Figure 4. Environmental vulnerability maps of the study area.
Landscape stability of the study area was observed to be very dynamic. The area is under the influence of different land use activities namely agriculture, infrastructure development, mining and industry. Based on the influences of these activities, the size of the area characterized by each degree of vulnerability in each year has also been changing in a floating pattern. There is neither continuous increase nor decrease of a particular vulnerability grades. Through the visual interpretation of fig.4 above, the heavy vulnerability grade seem to extend outwards all directions from the center.
3.2 Geographical distribution of vulnerability
Figure 5 shows that heavy environmental vulnerability was very high in 1991 but it was very less in 2001 due to protection of forest and then again little bit increase in 2013. Heavy ISPRS Annals of the Photogrammetry, Remote Sensing and Spatial Information Sciences, Volume II-8, 2014
vulnerability is present in areas, which is related to socio-economic activities. Slight and light environmental vulnerability is present in stable forest or low human impact areas. Percentage levels for slight and light increased, while it decreased for moderate and heavy levels as the altitude increased. Environmental vulnerability related to slope at low to moderate levels was found to be confined between 20° to 50°. However, heavy vulnerability level was recorded in a steepest slope situation. Slight and light vulnerability levels concentrated in north, north-east, north-west and west aspects. While medial and heavy vulnerability levels concentrated in south, southeast, south-west and west aspects. The maximum values of medial and heavy vulnerabilities were recorded in south-west and central part of study area.
The EVSI apparently presented distinct geographical distribution. The study area characterized by typical mountainous area showed landforms rising and falling violently. Mountain spread, slope direction and degree, and vertical changing climate cause great difference in natural resources and consequently on the human activities (Luers, 2005; Boori & Amaro, 2010). In lower altitude environmental vulnerability is high due to more socio-economic activities and human interferences such as regular constructions of roads and settlements, extensions of agriculture area and forest encroachment or degradation. But in high altitude vulnerability is low due to less socio-economic activities and human interferences as environmental conditions for human activities were not favorable. The greater environmental vulnerability threats at steep and very steep slopes resulted from serious soil erosion, low soil moisture, high landslide possibility and poor soil fertility problems. The overall study area environmental vulnerability is light with an around 40%, based on natural factors. The study area is characterized by typical middle-high mountainous area with landforms rising and falling violently. The highest elevation is 1500m. This mountain region have pumped storage hydro power plant. It has the largest reverse hydraulic turbine in Europe – 325 MW, it is the power plant with the highest gradient in the Czech Republic – 510.7m and has the highest installed output among the hydro power plants in the Czech Republic – 2*325 MW. It shows that the results strictly represent regional feature.
Figure 5. Environmental vulnerability maps of the study area.
Last three decades environmental vulnerability trends are changes and basically based on forest damage or encroachments. Few other factors are also important such as landforms, water heat condition and soil types (Thieler et al., 1999; Boori et al., 2010). These factors directly related to socio-economic activities, resulting the increase pressure of human on land, which lead to rapid changes of land use. Thus, the coverage of land is cutting down, and soil erosion is intensified
eventually, resulting in a further degradation of eco-environment (Lozoya et al., 2011; Boori & Vozenilek, 2014).
4. CONCLUSIONS
This research show environmental vulnerability in a mountain area and evaluates the situation with the support of remote sensing and GIS. SPCA method was used for weights and membership of all factors. It finds that over all study area environmental vulnerability is light level and its distribution is vertical and horizontal nature. As EVSI reduced from 1991 to 2013 so it`s assume that vulnerability is reducing due to governmental policies and protection. The main cause of environmental vulnerability is socio-economic activities. The results indicate it is urgent that, besides the improvement and reinforcement of compensation mechanism construction, the work of eco-environmental recovering and rebuilding should be carried out according to regionalization. Results also indicate that RS, GIS and SPCA approach are good in mountain region for environmental vulnerability evaluation. They also facilitated the derivation and application of the numeric environmental vulnerability evaluation. These findings provide quantitative basis and support for forest policy, management issues and institutional analyses in planning and management of the mountain regions.
REFERENCES
Adriaenssens, V., De Baets, B., et al., 2004. Fuzzy rule-based models for decision support in ecosystem management. Sci. Total Environ. 319, pp. 1–12.
Antonio, G.S., Juan Alfonso, B., Jos´eManuel, N., 2003. Assessing landscape values: a proposal for a multidimensional conceptual model. Ecol. Model. 168, pp. 319–341.
Bao, W. & C.H.M. Wang., 2000. Degradation mechanism of mountain ecosystem at the dry valley in the upper reaches of Minjian.
Boori, M.S, 2010. Coastal vulnerability, adaptation and risk assessment due to environmental change in Apodi-Mossoro estuary, Northeast Brazil. International Journal of Geomatics and Geosciences (IJGGS), Vol. 1(3), pp. 620–638.
Boori, M.S., & Amaro, V.E., 2010. Detecting and understanding drivers of natural and eco-environmental vulnerability due to hydro geophysical parameters, ecosystem and land use change through multispectral satellite data sets in Apodi estuarine, Northeast Brazil. International Journal of Environmental Sciences (IJES), Vol. 1(4), pp. 543–557.
Boori, M.S., & Amaro, V.E., 2010. Land use change detection for environmental management: using multi-temporal, satellite data in Apodi Valley of northeastern Brazil. Applied GIS International Journal, Vol. 6(2), pp. 1-15.
Boori, M.S., & Amaro, V.E., 2011. A remote sensing and GIS based approach for climate change and adaptation due to sea-level rise and hazards in Apodi-Mossoro estuary, Northeast Brazil. International Journal of Plant, Animal and Environmental Sciences (IJPAES), Vol. 1(1), pp. 14–25.
Boori, M.S., & Amaro, V.E., 2011. A remote sensing approach for vulnerability and environmental change in Apodi valley region, Northeast Brazil. International journal of ISPRS Annals of the Photogrammetry, Remote Sensing and Spatial Information Sciences, Volume II-8, 2014
Environmental, Earth Science and Engineering, Vol. 5(2), pp. 01-11.
Boori, M.S., & Amaro, V.E., 2011. Natural and eco-environmental vulnerability assessment through multi-temporal satellite data sets in Apodi valley region, Northeast Brazil. Journal of Geography and Regional Planning (JGRP), Vol. 4(4); pp. 216–230.
Boori, M.S., & Ferraro, R.R., 2012. Northern Hemisphere snow variation with season and elevation using GIS and AMSR-E data. Journal of Earth Science and Climate Change (JESCC). Vol. S12: 001, Special Issue 2012: pp. 01–06, Doi:10.4172/2157-7617.S12-001
Boori, M.S., & Ferraro, R.R., 2013. Microwave polarization and gradient ratio (MPGR) for global land surface phenology. Journal of Geology and Geosciences (JGG), Vol. 2(2), pp. 01– 10, Doi:10.4172/2329-6755.1000114
Boori, M.S., & Vozenilek, V., 2014. A remote sensing and GIS based approach for vulnerability, exposer and landscape trajectories in Olomouc, Czech Republic. Global journal of Researches in Engineering: E Civil and Structural Engineering. Vol. 14(4), pp. 06-32.
Boori, M.S., & Vozenilek, V., 2014. Land use/cover, vulnerability index and exposer intensity. Journal of Environments. Vol. 1(1), pp. 01–07.
Boori, M.S., Amaro, V.E., & Targino, A., 2012. Coastal risk assessment and adaptation of the impact of sea-level rise, climate change and hazards: A RS and GIS based approach in Apodi-Mossoro estuary, Northeast Brazil. International Journal of Geomatics and Geosciences (IJGGS), Vol. 2(3), pp.815–832.
Boori, M.S., Amaro, V.E., & Vital, H. (2010), Coastal ecological sensitivity and risk assessment: A case study of sea level change in Apodi River (Atlantic Ocean), Northeast Brazil. International journal of Environmental, Earth Science and Engineering, Vol. 4(11), pp. 44-53.
Boori, M.S., Vozenilek, V. & Balzter, H., 2014. Assessing land cover change trajectories in Olomouc, Czech Republic. International journal of Environmental, Ecology, Geological and Mining Engineering, Vol. 8(8), pp. 540-546.
Boori, M.S., & Vozenilek, V., 2014. Land use/cover, vulnerability index and exposer intensity. Journal of Environments. Vol. 1(1), pp. 01–07.
Boori, M.S., & Vozenilek, V., 2014. Remote sensing and GIS for Socio-hydrological vulnerability. Journal of Geology and Geosciences (JGG), Vol. 3(3), pp. 01–04, Doi: 10.4172/2329-6755.1000e115
Boori, M.S., & Vozenilek, V., 2014. Remote Sensing and land use / land cover trajectories. Journal of Geophysics and Remote Sensing, Vol. 3(3), pp. 01–07. Doi: 10.4172/2169-0049.1000123
Burgi, M., Hersperger, A.M., & Schneeberger, N., 2004. Driving forces of landscape change – current and new directions. Landscape Ecology 19, pp. 857-868.
Enea, M., & Salemi, G., 2001. Fuzzy approach to the environmental impact evaluation. Ecol. Model. 135, pp. 131– 147.
Fazey, I., Kesby, M., Evely, A., Latham, I., Wagatora, D., 2010. A three-tiered approach to participatory vulnerability assesssment in the Solomon Islands. Global Environmental Change 20, pp. 713–728.
Hao, Y., & Zhou, H.C.H., 2002. A grey assessment model of regional eco-environment quality and its application. Environ. Eng. 20 (4), pp. 66–68.
IPCC, 2001. Climate Change (2001). Impacts, Adaptation, and Vulnerability. Contribution of Working Group II to the Third Assessment Report of the Intergovernment Panel on Climate Change. Cambridge University Press, Cambridge, UK.
Irwin, E.G. & Geoghegan, J. 2001. Theory, data and methods: Developing spatially explicit economic models of land use change. Agriculture, Ecosystems & Environment 85, pp. 7–23.
Kangas, J., Store, R., Leskinen, P. et al., 2000. Improving the quality of landscape ecological forest planning by utilizing advanced decision-support tools. Forest Ecol. Manage. 132, pp. 157–171.
Li, A., A. Wang, S. Liang & W. Zhou. 2005. Ecoenvironmental vulnerability evaluation in mountainous region using RS and GIS: A case study in the upper reaches of Minjiang River, China. Ecological Modelling 192, pp. 175-187.
Lozoya, J.P., Sarda, R., Jimenez, J.A. 2011. A methodological framework for multi-hazard risk assessment in beaches. Environmental Science & Policy I4, pp. 685–696.
Luers, A.L., 2005. The surface of vulnerability: an analytical framework for examining environment change. Global Environmental Change 15, pp. 214–223.
Parinet, B., Lhote, A., Legube, B., 2004. Principal component analysis: an appropriate tool for water quality evaluation and management—application to a tropical lake system. Ecol. Model. 178, pp. 295–311.
Thieler, E.R., Williams, J., Hammar-Klose, E., 1999. National assessment of coastal vulnerability to sea-level rise. U.S. geological survey open-file report.
Wotling, G., Bouvier, Ch., Danloux, J., et al., 2000. Regionalization of extreme precipitation distribution using the principal components of the topographical environment. J. Hydrol. 233, pp. 86–101.