Retrieval of Land Surface Temperature Diurnal Cycle model parameters from Kalpana-1
VHRR data over India
D. B. Shah a, *, M. R. Pandya b, A. Gujrati b, H. J. Trivedi a, R. P. Singh b a
N. V. Patel college of Pure and Applied Sciences, Vallabh Vidyanagar, 388120, Gujarat, India - ([email protected], [email protected])
b
Space Applications Centre (ISRO), Ahmedabad, 380015, Gujarat, India- (mrpandya, ashwin8199, rpsingh)@sac.isro.gov.in
KEY WORDS: Land, Modelling, Retrieval, Temperature, Thermal
ABSTRACT:
Land Surface Temperature (LST) is an important parameter in the land surface processes on regional and global scale. The Land Surface Temperature Diurnal (LSTD) cycle of different land cover is an excellent indicator of the surface processes and their interaction with planetary boundary layer. The Kalpana-1 very high resolution radiometer (VHRR) LST product is available with 30 minute spatial resolution and 0.1 degree temporal resolution. A study was carried out with an objective to determine the LSTD parameters directly from K1-VHRR monthly averaged LST observations over Indian landmass. In this analysis, a harmonic function is fitted to LSTD from the K1-VHRR observations, where cosine term describing the effect of sun and exponential term represents decay of LST during nighttime. Using LSTD parameters, one can directly know the temperature amplitude, residual temperature and time of maximum temperature for each pixel. The LSTD parameters fitting accuracy in root mean square error (RMSE) and coefficient of determination (R2) ranges between 0.5-2.5 K and 0.90-0.99 respectively for most of the pixels over Indian landmass. These LSTD parameters may bring new insight for estimation of thermal inertia and also useful in cloud screening algorithms.
1. INTRODUCTION
Land Surface Temperature (LST) is one of the key parameters at the land-atmosphere interface, while the land surface temperature diurnal cycle (LSTD) is an important element of the climate system and meteorology. Diurnal observation of LST dataset is necessary for model evaluation (Duana et al., 2012). Furthermore, it can also be used to study the energy equilibrium of the land-atmosphere system by taking into account the relationship between LST and the sensible/latent heat flux. LST and the air temperature have great impact on the exchange of energy and water vapour flux on the land-atmosphere interface. The diurnal and annual variation of LST are related to insolation, wind speed, overlying atmosphere and land cover types (e.g., vegetation, soil moisture, soil type, surface structure etc.) (Carlson and Boland, 1978). Cloud cover usually becomes an obstacle for the generation of LST over large area from thermal infrared observations sensed by satellites. If cloud cover is less than 4 hours and only partial on the scale of a K1-VHRR satellite pixel, the discontinuous time series of cloud free measurements still approximates a cloud free LSTD.
LSTD parameters can be very well determined from the geostationary satellite platform. The geostationary satellite K1-VHRR provides LST observations at 0.1 degree spatial resolution and 30 minutes temporal resolution (Pandya M. R et al., 2014). Fitting a model to LSTD summarizes the thermal behavior of the land surface and yields representative and informative parameters: these can then be used to interpolate atmospheric corrections and missing LST (Schadlich et al., 2001) or to improve cloud screening algorithms (Reuter, 2005).
In the present study, LSTD modelling over Indian landmass has been carried out for K1-VHRR derived LST products.
2. MODELLING THE LSTD PATTERN
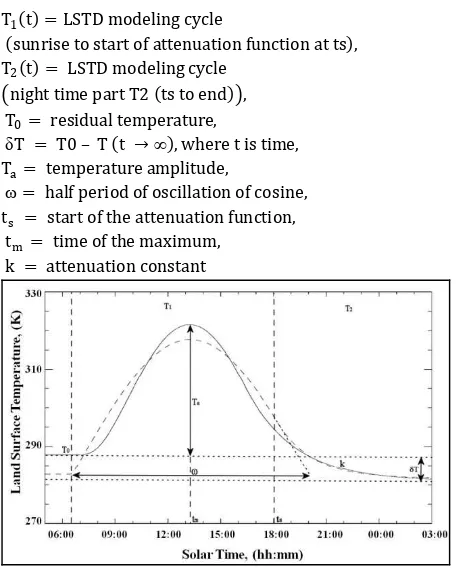
Gottsche and Olesen (2001) developed a physics based model of cloud-free LSTD describing the thermal behavior of the surface, which several authors successfully used to interpolate atmospheric corrections and missing LST derived from satellite data (Schadlich et al., 2001; Jiang et al., 2006; Inamdar et al., 2008, Inamdar and French, 2009). A harmonic function is fitted to LSTD from the K1-VHRR observations, describing the effect of the Sun and decrease of LST during night time. From the LSTD observations, it is found that maximum value of LST occurs at local time 13-14 h, the minimum LST occurs at Sun rise and is about 6-7 h local solar time. This model uses a cosine term to describe the effect of the Sun and exponential term for the decrease of LST during night time shown in Figure 1. Moreover, day time and night time parts are required to smoothly fit together at sunset, i.e. the model has to be differentiable. This semi-empirical model is referred as “LSTD model” and describe as follows:
�1(�) = �0+ �� . cos�
The International Archives of the Photogrammetry, Remote Sensing and Spatial Information Sciences, Volume XL-8, 2014 ISPRS Technical Commission VIII Symposium, 09 – 12 December 2014, Hyderabad, India
This contribution has been peer-reviewed.
T1(t) = LSTD modeling cycle
(sunrise to start of attenuation function at ts), T2(t) = LSTD modeling cycle
�night time part T2 (ts to end)�, T0= residual temperature,
δT = T0 – T (t →∞), where t is time, Ta= temperature amplitude,
ω= half period of oscillation of cosine, ts = start of the attenuation function,
tm = time of the maximum,
k = attenuation constant
Figure 1. Model parameters for describing LSTD. Day time part T1 (sunrise to start of attenuation function at ts) and night time
part T2 (ts to end) are indicated by broken vertical lines (Gottsche and Olesen, 2009).
Here, time “t” is limited to the interval between two successive Sun rises. The model of LSTD given by equation 1 and 2 is non linear, which means that the corresponding normal equations cannot be solved, explicitly. Therefore, Levenberg Marquardt scheme is used to fit the model parameters to the K1-VHRR derived diurnal LST observations.
3. METHODOLOGY AND DATA USED
The generalized single channel method was used to retrieve LST from K1-VHRR brightness temperature observations. The diurnal observations of K1-VHRR LST for the December-2013 were utilized for LSTD modelling over Indian landmass. Monthly average image for each acquisition have been carried out and used for LSTD modelling to fill all the available clear sky pixels over India. These dataset was used to generate the LSTD parameters by applying equation 1 and 2 for day and night time respectively.
3.1 Diurnal variation of LST over representative land covers
In order to avoid the uncertainty of cloud-radiation forcing in the earth-atmosphere system, modelling of diurnal variation of LST on "pure" clear pixels are used, which are determined as clear by using temporal criterion in all 24 hours a day. Figure 2 shows the diurnal temperature variation in December 2013 over different land cover types.
The LST variation gradient in daytime is larger than at night due to the impact of solar radiation (Figure 2). The temperature increases sharply at 07:00 hrs and reaches the peak at 13:00 hrs
local solar time when the temperature variation gradient is not large. Afterward, the temperature declines rapidly. The decline scale of LST after 16:00 hrs becomes less, and the LST variation gradient is trivial during the night and reaches a minimum in early morning (05:00 hrs). Figure 2 shows that minimum variation in LST is found for water class and maximum variation is found for the desert land cover type.
Figure 2. Diurnal land surface temperature variations over various land cover type for the December 2013.
4. RESULTS AND DISCUSSION
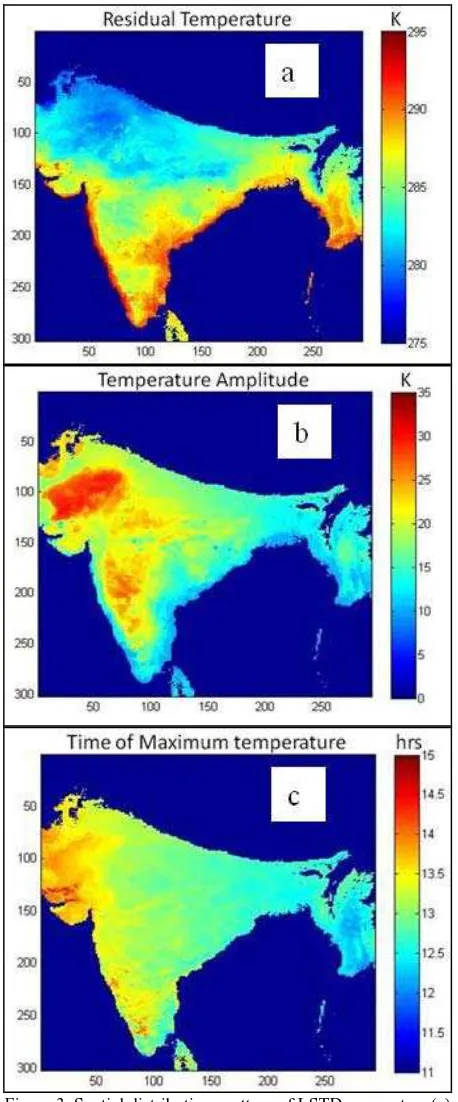
Various parameters used to determine LSTD cycle in equation 1 and 2 were obtained for diurnal LST observations for December 2103. The spatial distribution pattern of some important LSTD parameters, like residual temperature, temperature amplitude and time of maximum temperature are shown in Figure 3 for the month of December-2013. These LSTD parameters retrieval accuracy in terms of root mean square error (RMSE) and mean absolute error (MAE) are shown in Figure 4. These parameters obtained from equation 1 and 2 can effectively solve the LSTD diurnal cycle parameter for representative months. Figure 3 (a) demonstrates residual temperature image obtained using LSTD modelling. It shows higher residual temperature for the water and forest land cover types whereas it gives lower values over desert and north India region because of winter season. Temperature amplitude (Figure 3(b)) is high over desert and shrubland where as it is having lower values over water, forest and cropland land cover types. The time of maximum LST (Figure 3(C)) shows the effect of sun and gradually increases from east to west direction.
The LSTD parameters fitting errors in root mean square error (RMSE) and coefficient of determination (R2) are shown in Figure 4 (a) and (b) for the month of December-2013 over Indian landmass. The fitting accuracy for LSTD model obtained with RMSE and R2 ranges between 0.5 – 2.5 K and 0.90-0.99 respectively for most of the pixels over India.
The difference between K1-VHRR LST and modeled LST at 30 minutes interval for December-2013 obtained at each corresponding local solar time. Figure 5 shows the results over cropland land cover. It shows that LSTD obtained from K1-VHRR and modelled using equation 1 and 2 are hardly discernable with the largest absolute difference occurring during the sunrise (around 2K). For the remaining part of the day both (K1-VHRR LSTD and modeled LSTD) fit equally well and LST error is less than 0.5K.
The International Archives of the Photogrammetry, Remote Sensing and Spatial Information Sciences, Volume XL-8, 2014 ISPRS Technical Commission VIII Symposium, 09 – 12 December 2014, Hyderabad, India
This contribution has been peer-reviewed.
Figure 3. Spatial distributions pattern of LSTD parameters (a) residual temperature, (b) temperature amplitude and (c) time of
maximum temperature for the month of December-2013.
The difference between K1-VHRR LST and modeled LST at 30 minutes interval for December-2013 obtained at each corresponding local solar time. Figure 5 shows the results over cropland land cover. It shows that LSTD obtained from K1-VHRR and modelled using equation 1 and 2 are hardly discernable with the largest absolute difference occurring during the sunrise (around 2K). For the remaining part of the day both (K1-VHRR LSTD and modeled LSTD) fit equally well and LST error is less than 0.5K.
Figure 4. Spatial distributions of (a) root mean square error and (b) coefficient of determination for LSTD modelling for the
month of December-2013.
Figure 5. LSTD cycle over representative cropland locations over India for December 2013 derived from K1-VHRR LST
and modelled LST derive using equation 1 and 2.
5. CONCLUSIONS
Fitting the LSTD model summarizes the thermal behavior of the land surface and yields representative and informative thermal surface parameters. The model used in the present study includes a cosine term to describe the effect of the Sun and exponential term for the decay of LST during night time. The The International Archives of the Photogrammetry, Remote Sensing and Spatial Information Sciences, Volume XL-8, 2014
ISPRS Technical Commission VIII Symposium, 09 – 12 December 2014, Hyderabad, India
This contribution has been peer-reviewed.
LSTD model showed a good performance to fit the K1-VHRR derived LSTs with an MAE less than 1K. The results demonstrated that LSTD model has significantly lower RMSE for K1-VHRR measured LSTD. However, the performance of the models depends on the quality of the K1-VHRR LST as well as on atmospheric and surface wind conditions, i.e. the observed LSTD should at least approximate undisturbed LSTD profiles. Application of present work can be in improving cloud screening algorithm, e.g., the detection of partial cloud cover could be enhanced using dynamic threshold based on model values and examine the modelling of thermal forcing in mesoscale models.
AKNOLEDGEMENT
This work has been carried out in a collaborative study under SAC R&D project “Retrieval and validation of Land Surface Temperature using INSAT-3D imager”. We thank Shri A. S. Kirankumar, Director, SAC, Dr. J. S. Parihar, Deputy Director, EPSA, Dr. B. Bakshi, Principal, NVPAS, for their guidance and support to the study.
REFERENCES
Carlson, T. N. and Boland, F. E. 1978. Analysis of urban-rural canopy using a surface heat flux/temperature model; Journal of
Applied Meteorology, 17, PP 999−1013.
Duana, S. B., Liang, Z. L., Wanga, N., Wua, H., Tanga, B, H., 2012. Evaluation of six land-surface diurnal temperature cycle models using clear-sky in situ and satellite data; Remote Sensing of Environment, 124, pp 15–25.
Gottsche, F. M. and Olesen, F. S. 2001. Modelling of diurnal cycles of brightness temperature extracted from METEOSAT data; Remote Sensing of Environment, 76, pp 337-348.
Gottsche, F. M. and Olesen, F. S. 2009. Modelling the effect of optical thickness on diurnal cycle of land surface temperature; Remote Sensing of Environment, 113, PP 2306-2316.
Inamdar, A. K., French, A., Hook, S. and Vaughan, G. 2008. Land surface temperature retrieval at high spatial and temporal resolutions over the southwestern United States; Journal of Geophysical Research, 113, D07107.
Inamdar, A. K., French, A. 2009. Disaggregation of GOES land surface temperatures using surface emissivity; Geophysical Research Letters, 36, L02408
Jiang, G. M., Li, Z. L. and Nerry, F. 2006. Land surface emissivity retrieval from combined mid-infrared and thermal infrared data of MSG-SEVIRI; Remote Sensing of Environment, 105, PP 326-340.
Pandya, M. R., Shah, D. B., Trivedi, H. J., Darji, N. P., Ramakrishnan, R., Panigrahy S., Parihar J. S., Kirankumar, A. S. 2014. Retrieval of Land Surface Temperature from the Kalpana-1 VHRR Data using a Single-Channel Algorithm and its Validation over western India. International Journal of Photogrammetric Engineering and Remote Sensing, 94, pp 160-168.
Reuter, M. 2005. Identification of cloudy and clear sky areas in MSG SEVIRI images by analyzing spectral and temporal information; Ph.D. Thesis , Freie University Berlin.
Schadlich, S., Gottsche, F. M. and Olesen, F. S., 2001. Influence of land surface parameters and atmosphere on METEOSAT brightness temperatures and interpolation of atmospheric correction; Remote Sensing of Environment, 75, PP 39-46.
The International Archives of the Photogrammetry, Remote Sensing and Spatial Information Sciences, Volume XL-8, 2014 ISPRS Technical Commission VIII Symposium, 09 – 12 December 2014, Hyderabad, India
This contribution has been peer-reviewed.