ASSESSING WHEAT YELLOW RUST DISEASE THROUGH HYPERSPECTRAL
REMOTE SENSING
Gopal Krishnaa, Rabi N. Sahooa *, S. Pargalb, V. K. Guptaa, P. Sinhac, S. Bhagatd, M. S. Saharane, R. Singha & C. Chattopadhyayd
a
Division of Agricultural Physics, Indian Agricultural Research Institute, New Delhi, India b
Division of Plant Physiology, Indian Agricultural Research Institute, New Delhi, India c
Division of Plant Pathology, Indian Agricultural Research Institute, New Delhi, India dNational Centre for Integrated Pest Management, New Delhi, India
e
Directorate of Wheat Research, Karnal, Haryana, India
Commission VI, WG VI/4
KEY WORDS: Wheat Yellow Rust, Hyperspectral Reflectance, Spectral Disease Indices, Disease Severity Score, PLSR, ANOVA, MLR
ABSTRACT:
The potential of hyperspectral reflectance data was explored to assess severity of yellow rust disease (Biotroph Pucciniastriiformis) of winter wheat in the present study. The hyperspectral remote sensing data was collected for winter wheat (Triticum aestivum L.) cropat different levels of disease infestation using field spectroradiometer over the spectral range of 350 to 2500nm. The partial least squares (PLS) and multiple linear (MLR) regression techniques were used to identify suitable bands and develop spectral models for assessing severity of yellow rust disease in winter wheat crop. The PLS model based on the full spectral range and n = 36, yielded a coefficient of determination (R2) of 0.96, a standard error of cross validation (SECV) of 12.74 and a root mean square error of cross validation (RMSECV) of 12.41. The validation analysis of this PLS model yielded r2 as 0.93 with a SEP (Standard Error of Prediction) of 7.80 and a RMSEP (Root Mean Square Error of prediction) of 7.46. The loading weights of latent variables from PLS model were used to identify sensitive wavelengths. To assess their suitability multiple linear regression (MLR) model was applied on these wavelengths which resulted in a MLR model with three identified wavelength bands (428nm, 672nm and 1399nm). MLR model yielded acceptable results in the form of r2 as 0.89 for calibration and 0.90 for validation with SEP of 3.90 and RMSEP of 3.70. The result showed that the developed model had a great potential for precise delineation and detection of yellow rust disease in winter wheat crop.
* Corresponding author. Email Id:[email protected]
1. INTRODUCTION
Hyperspectral remote sensing techniques have been proved to be highly useful for disease identification and severity assessment due to availability of hundreds of contiguous bands. Remote sensing technologies can provide an automatic and objective alternative to visual disease assessment of plant diseases (Mahlein et al., 2012). Production losses have been recorded in agricultural industries worldwide due to various diseases in plants. According to a study by Huang et al. 2012, due to yellow rust stripes approximately 73-85% of yield losses and significant grain quality suppression was observed. Monitoring of health and detection of diseases in plants and trees is critical for sustainable agriculture (Sankaran et al, 2010).The traditional ground-based survey method requires high labour cost and produces low efficiency. Thus, it is unfeasible for large area. Fortunately, remote sensing technology can provide spatial distribution information of diseases and pests over a large area with relatively low cost. Derivation of indices from spectroscopic and imaging measurements is an effective method to monitor, detect and quantify various leaf content substances. The very extensively used technique, to extract highly optimum wavebands for any dependable variable is multivariate analysis. This statistical technique computes the covariance between dependent and independent variables (more than one). The objective of multivariate analysis is the prediction of variables, optimization
of variables and extract out the optimum columns using one set of observed variables. In present study, we applied Partial Least Square Regression (PLSR), Analysis of Variance (ANOVA) and Multiple Linear Regression (MLR) techniques.
To achieve an unique (i.e. robust) calibration independent of the leaf age and the genotype, authors suggested to couple the use of enlarged reflectance spectra with chemometric analysis (mainly the partial least square regression, PLS) to perform calibrations (Ecarnot, 2013). Recently, PLS was also used to predict plant biomass, LAI, nitrogen and chlorophyll concentration and density of wheat using hyperspectral reflectance measurement of wheat canopy (Hansen and Schjoerring, 2003). The potential few bands extracted out from PLS regression could be further used to develop a good prediction model.
2. STUDY AREA AND INPUT DATA
2.1 Experimental Setup and Hyperspectral Reflectance Data
Field survey was done to different wheat growing farmers’ fields of Haryana and Punjab state of India having yellow rust disease at different severity scales during March, 2013. Disease
The International Archives of the Photogrammetry, Remote Sensing and Spatial Information Sciences, Volume XL-8, 2014 ISPRS Technical Commission VIII Symposium, 09 – 12 December 2014, Hyderabad, India
This contribution has been peer-reviewed.
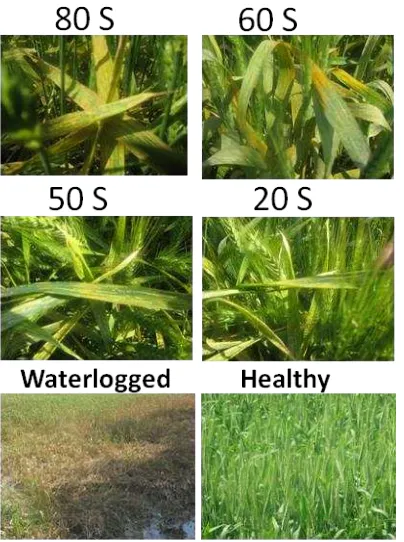
scores were determined by expert pathologist, on the basis of available yellow rust density and visual inspection, severity was classified into eleven classes. Proximal reflectance measurement of infected wheat leafs were done in the spectral range of 350-2500nm using FS3 spectroradiometer and its leaf clip assembly. Wheat fields with different disease severity is shown in Fig 1 and location map of yellow rust affected area with different severity levels (taken from CIMMYT Country survey rust tracker tool) is given in Fig. 2.
Figure 1.Wheat crop in study area with different disease severity scores of yellow rust
Figure 2. Yellow rust affected areas in North Western part of India, showing level of yellow rust infestation.
2.2 Disease Severity Score
Disease score was determined by extensive field visits of yellow rust affected farmers’ fields by expert pathologist, on the basis of available yellow rust density and visual inspection, severity was classified into eleven classes Classification was as follows:
0%, 5%, 10%, 20%, 30%, 40%, 50%, 70%, 75%, 80%, 90% and 100%. Here plants with 0% disease score were healthy while 100% disease score means plant is totally damaged due to yellow rust infestation.
3. METHODOLOGY
3.1 Predictive Model Development using Multivariate Analysis
3.1.1 Partial Least Square Regression: PLS regression analysis was performed using the GRAMS statistical analysis software. PLS regression method exhibits PCA like data compression technique and MLR like regressive modeling both. The PLSR provides reasonable explanations for independent variables using fewer latent variables still some uncorrelated noise may creep into the system while developing a model using PLS regression (Zhang et al, 2011). PLSR was computed considering independent X variables as spectral reflectance observations and disease severity score as dependent y variable. Partial least squares regression is an extension of the multiple linear regression model, in its simplest form, a linear model specifies the (linear) relationship between a dependent (response) variable y and a set of predictor variables, the x variables (www.uta.edu).
3.1.2 Analysis of Variance (ANOVA): ANOVA was applied on wavelengths extracted from PLSR and were used to test the sensitivity of possible wavelengths against yellow rust severity. Wavelengths with significance level p < 0.0001 were used for MLR model development.
3.1.3 Multiple Linear Regression (MLR): MLR could be used to regress many dependent variables with independent variables. MLR Regression was also used in this study to create a robust predictive model from wavelengths delineated from ANOVA. Multiple linear regression attempts to model the relationship between two or more explanatory variables and a response variable by fitting a linear equation to observed data and every value of the independent variable x is associated with a value of the dependent variable y (Lattin, et al, 2003). Though PLSR model could also be used as a model for prediction but in PLSR equation, every coefficient has a RMSE error associated with it which makes it more susceptible to deviation. So wavelengths extracted through latent variables could be used as input for MLR model, it may generate a better and robust model based on high t-test values.
4. RESULTS AND DISCUSSION
4.1 Partial Least Square Regression Model
The PLSR was applied to extract highly sensitive wavebands out of the highly contiguous hyperspectral data. The calibration model based on Y- variable (Disease severity Scores) and corresponding whole spectra of region 350 to 2500nm was developed using PLS analysis with cross validation. The NIPALS (Non Linear Iterative Partial Least Squares) algorithm was used which is the PLS method for principal components. To develop and validate model the dataset was randomly split into two subsets: a calibration set with 24 samples and a test sample with 12 samples. The model was also validated with cross validation (leave one out and validate with each).
The International Archives of the Photogrammetry, Remote Sensing and Spatial Information Sciences, Volume XL-8, 2014 ISPRS Technical Commission VIII Symposium, 09 – 12 December 2014, Hyderabad, India
This contribution has been peer-reviewed.
Figure 3. Yellow rust disease severity scores versus spectral reflectance of wheat crop showing Partial Least Square Regression model with calibration and validation sets.
An excellent model with six latent variables (out of seven latent variables) was built for prediction of yellow rust severity in wheat crop. Shenk and Westerhaus (1996) suggest that an R2 value greater than 0.9 indicates excellent quantitative information. The model R2 for yellow rust disease severity was 0.96, thus the model’s prediction could be considered as excellent. According to Zhang et al (2011), SECV value (12.74 for present study) must be viewed must be viewed in association with standard deviation and range of the parameters studied. Ratio of performance to deviation (RPD) was initially used by Williams and Norris (2001) which is considered as a measure of robustness for the model’s prediction. RPD could be explained mathematically as:-
According to Malley et al, 1996, RPD value less than 2 shows irrelevant prediction, RPD value between 2.0 and 3.0 is regarded adequate whereas RPD value above 3.0 reflects moderately successful and >4 show excellent prediction capacity of the model. In present study RPD value was derived as 4.009 which lie well within recommended values. The calibration model produced the coefficient of determination as 0.93, RMSE of cross validation as 12.41, SECV as 12.70 and standard error of calibration as 6.9.
To validate the model a sample set which was not used in calibration model was tested. The validation set has similar extent on both of the axes to the calibration set with n=12 samples. Fig.5 shows calibration and validation sets of yellow rust severity score using PLSR model. For validation, the coefficient of determination, SEP and RMSEP were 0.96, 7.46 and 7.80 respectively.
4.2 Analysis of Variance (ANOVA)
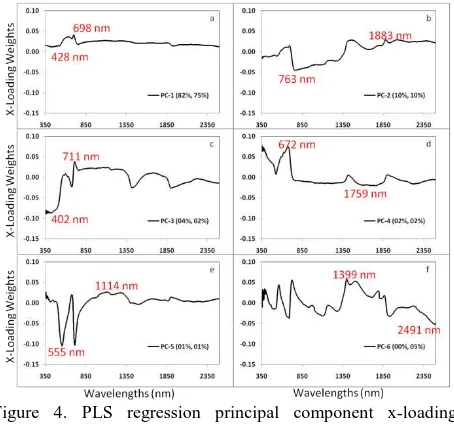
PLS regression produces latent variables which provided the highly sensitive waveband. Out of the more than 2000 spectral band PLSR latent variables yielded 12 sensitive wave bands. These 12 wavebands were used as input of ANalysis Of Variance (ANOVA). The ultimate goal was to test their level of significance against yellow rust severity which was determined on the basis of p < 0.0001. All bands meeting this criterion were included into MLR model.
Figure 4. PLS regression principal component x-loading weights, depicting potentially sensitive wave bands against yellow rust severity.
4.3 Multiple Linear Regression (MLR) Model
MLR model was applied through a Matlab program. MLR algorithm computed t-test over the wavelengths selected by ANOVA and wavelengths with highest t-values were used to develop the MLR model. The wavelengths with highest t values are considered to be the most contributing wavelengths for model. The MLR model was built using calibration data set which was based on independent wavelength variables 428nm, 672nm and 1399 nm. The model is as given below-
y = -102.06 – (263.44*R428nm) + (399.26*R672nm) + (428.42* R1399nm)
These three wavelengths were considered as the most suitable and strongly correlated wavelengths for yellow rust disease severity detection. The calibration and external prediction results of MLR model are shown in Fig.5. The model displayed R2 values of 0.89 and 0.90 for calibration and validation respectively and RMSE as 12.6. This MLR model was executed using only three optimum wavebands in comparison with PLSR which was performed over full 2151 wavebands range that’s why this model produced a slight less predictions which also reflects through RPD value. This model produced the RPD value as 3.80 which is very well within the recommended range but slight lower than the RPD (4.00) of PLSR model. However RPD value of MLR above 3.0 reflects excellent prediction capacity of this model.
Figure 5. Yellow rust disease severity scores versus spectral reflectance of wheat crop showing MLR model with calibration and validation sets.
The International Archives of the Photogrammetry, Remote Sensing and Spatial Information Sciences, Volume XL-8, 2014 ISPRS Technical Commission VIII Symposium, 09 – 12 December 2014, Hyderabad, India
This contribution has been peer-reviewed.
5. SUMMARY AND CONCLUSIONS
The results of this research showed that wheat crop yellow rust has various symptoms and distinct spectrum than healthy spectrum. The study successfully executes spectroscopy in VNIR and SWIR regions for yellow rust severity detection in winter wheat crop. By means of PLS regression, ANOVA and MLR, a robust model was derived based on reflectance spectra and yellow rust disease severity scores of wheat crop. The model developed through this study reflects strong correlation and low error. Six latent variables in the form of principal components were derived through PLSR and three highly significant spectra (428nm, 672nm and 1399nm) were determined for yellow rust severity. Using this model, yellow rust disease in winter wheat could be traced using reflectance data of the diseased crop. A low cost and efficient instrument could be developed using wavelength values recommended through this study.
REFERENCES
Anonymous, Partial Least Squares (PLS) URL: http://www.uta.edu/faculty/sawasthi/Statistics/stpls.html (04 December 2014).
Ecarnot M., Compan F., Roumet P., 2013. Assessing leaf nitrogen content and leaf mass per unit area of wheat in the field throughout plant cycle with a portable spectrometer, Field Crops Research, 140 pp. 44–50.
Hansen, P.M., Schjoerring, J.K., 2003. Reflectance measurement of canopy biomass and nitrogen status in wheat crops using normalized difference vegetation indices and partial least squares regression. Remote Sensing of Environment, 86 pp. 542-553.
Huang, L.S., J.L. Zhao, D.Y. Zhang, L. Yuan, Y.Y. Dong and J.C. Zhang, 2012 Identifying and Mapping Stripe Rust in Winter Wheat using multi-temporal airborne hyperspectral images, International journal of agriculture and biology, 14(5) pp. 697-704.
Lattin, J. M., Douglas, J., & Green, P. E., 2003. Analyzing multivariate data. China:Machine Press, pp. 38–40.
Mahlein A.-K. Rumpf T., Welke, P., Dehne H.-W., Plumer L., Steiner U., Oreke E.-C. 2013. Development of spectral indices for detecting and identifying plant diseases, Remote Sensing of Environment, 128 (21) pp. 21–30.
Malley, D.F., Hauser, B.W., Williams, P.C., Hall, J., 1996. Prediction of organic carbon, nitrogen and phosphorus in freshwater sediments using near infrared reflectance spectroscopy. In A.M.C. Davies and P. Williams (eds) Near Infrared Spectroscopy: The Future Waves. pp 691-699.
Sankaran, S.; Mishra, A.; Ehsani, R.; Davis, C. 2010 A review of advanced techniques for detecting plant diseases. Comput. Electron. Agric. 72, pp.1–13.
Williams, P., Norris, K. (Eds.), 2001. Near-Infrared Technology in the Agricultural and Food Industries. American Association of Cereal Chemists, Inc., St. Paul, Minnesota, USA.
Zhang J., Wu J.& Zhou L., 2011. Deriving vegetation leaf water content from spectrophotometric data with orthogonal signal correction-Partial least square regression, International Journal of Remote Sensing, 32(22) pp. 7557-7574.,
The International Archives of the Photogrammetry, Remote Sensing and Spatial Information Sciences, Volume XL-8, 2014 ISPRS Technical Commission VIII Symposium, 09 – 12 December 2014, Hyderabad, India
This contribution has been peer-reviewed.