www.elsevier.nlrlocateraqua-online
Dietary protein requirement of juvenile American
ž
/
eel Anguilla rostrata fed practical diets
S.M. Tibbetts
a,b,), S.P. Lall
b, D.M. Anderson
aa
Department of Animal Science, NoÕa Scotia Agricultural College, P.O. Box 550, Truro, NoÕa Scotia,
Canada B2N 5E3
b
Institute for Marine Biosciences, National Research Council, 1411 Oxford Street, Halifax, NoÕa Scotia,
Canada B3H 3Z1
Accepted 16 November 1999
Abstract
Triplicate groups of juvenile American eel were fed to satiation herring meal-based diets
Ž .
containing 35, 39, 43, 47 and 51% crude protein as fed basis for 84 days. Data were collected to determine the relationship between dietary protein level and the following response variables:
Ž . Ž . Ž .
mean weight gain MWG , specific growth rate SGR , feed conversion ratio FCR , nutrient
Ž .
digestibility and nutrient retention. Highest MWG and SGR P-0.05 were obtained when
Ž .
dietary protein was 47% and 51% with values mean"SEM of 14.2"0.66 g and 12.8"0.61 g for MWG, respectively, and values of 1.20"0.04%rday and 1.13"0.05%rday for SGR,
Ž .
respectively. Optimum FCR P-0.05 of 1.17"0.05 g feedrg gain was achieved by feeding 47% protein and was significantly better than all other levels. Digestibilities of crude protein and energy were similar among the diets containing 39, 43, 47 and 51% protein with mean protein digestibility of 90.7"0.54% and mean energy digestibility of 90.3"0.60%. However,
digestibil-Ž .
ity coefficients of the 35% protein diet were significantly lower P-0.05 at 84.9"0.97% for
Ž .
protein and 85.2"0.98% for energy. Highest carcass protein gain P-0.05 of 2.2"0.11 grfish was achieved when feeding 47% and 51% protein, while highest carcass lipid gain
ŽP-0.05 of 1.8. "0.07 grfish was achieved when feeding 47% protein. Little difference in carcass energy gain was observed due to the different dietary protein levels. Based on all measured criteria, the optimum level of dietary protein for juvenile American eel is estimated to
)Corresponding author. Institute for Marine Biosciences, National Research Council, 1411 Oxford Street, Halifax, Nova Scotia, Canada B3H 3Z1. Tel.:q1-902-868-2232; fax:q1-902-426-9413.
Ž .
E-mail address: [email protected] S.M. Tibbetts .
0044-8486r00r$ - see front matterq2000 Elsevier Science B.V. All rights reserved. Ž .
be 47% or 22 g digestible proteinrMJ digestible energy.q2000 Elsevier Science B.V. All rights reserved.
Keywords: American eel; Anguilla rostrata; Protein requirement; Elver; Optimum growth; Digestibility
1. Introduction
American eel culture is a relatively new industry in Atlantic Canada. Due to environmental constraints, particularly low winter water temperature in the Atlantic provinces, a recirculation system must be used to rear wild elvers to market size. Feeds used for this system should be water-stable and highly digestible to minimize nitrogen, phosphorous and solid output to the aquatic environment. Unfortunately, information on the nutrient requirements of American eel is limited and there are no published data on nutrient bioavailability from locally available feed ingredients.
Dietary protein supply is one of the major factors that influence the productivity of fish and the production of nitrogenous waste material that is excreted in water. Like other fish species, the reported protein requirement of Japanese eel and European eel is
Ž .
relatively high compared to terrestrial animals National Research Council, 1993 . Ž
Although the protein requirement of Japanese eel has been investigated Arai et al., .
1971, 1972; Nose and Arai, 1973 and is 44.5% of the diet, reported values for European Ž
eel range from 30% to 48% Spannhof and Kuhne, 1977; Degani et al., 1984, 1985; Arai .
et al., 1986 . Dietary requirement for protein is, in fact, a requirement for the essential amino acids contained in the dietary protein. The quantitative amino acid requirement
Ž .
values for Japanese eel Nose, 1979 are commonly used for feed formulation of both American eel and European eel.
Dietary energy concentration has a profound effect on how well protein is utilized.
Ž .
Studies have indicated that American eels Otwell and Rickards, 1981 , Japanese eels ŽTakeuchi et al., 1980 and European eels Dave et al., 1974, 1976 efficiently utilize fat. Ž . as an energy source.
The present study was designed to determine the quantitative dietary crude protein requirement for optimum growth of juvenile American eel using a practical fish-meal-based diet and to measure the digestibility of nutrients from the experimental diets. This information is necessary for cost-effective feed formulations, to optimize growth and protein retention and reduce the soluble and solid load of nitrogenous compounds in the water used for eel culture systems, particularly in recirculation systems.
2. Materials and methods
2.1. Rearing systems, diets and experimental design
Ž .
American eels Anguilla rostrata obtained from Springhill Fish Farms, Springhill,
twice daily. The experiment was conducted according to a randomized complete block design and the tanks were arranged in three blocks of five tanks. Each of the five experimental diets were fed to three tanks, each containing 45 fish and individual diets were represented in each block of tanks. The initial biomass density in each tank was approximately 18 kgrm3. Water was supplied to each tank at a flow rate of 1 lrmin, constantly aerated and maintained thermostatically at 22"0.28C. Photoperiod was controlled automatically on a 15 h light:9 h dark schedule. During the 84-day experi-mental period, fish were fed at a rate judged to be near satiety twice daily during the week and once daily on weekends. Daily feed intake was recorded by weighing feed containers at the beginning of each day and ensuring that all feed offered was consumed. All mortalities were collected, weighed and recorded on a daily basis. When necessary, these weights were used to adjust tank biomass for calculation of feed conversion ratio ŽFCR ..
Ž .
Five isoenergetic 19 MJ DErkg experimental diets were formulated to supply crude
Ž .
protein levels of 35, 39, 43, 47 and 51% on an as fed basis Table 1 . Digestible protein ŽDP and digestible energy DE values of feed ingredients for salmonids National. Ž . Ž
.
Research Council, 1993 were used for feed formulation. Dry feed ingredients were finely ground, mixed with micronutrient and lipid supplements, steam-pelleted in a
Ž .
laboratory pellet mill California Pellet Mill, Crawfordsville, IN and stored in air-tight containers until used.
Fish from each tank were individually weighed on days 0, 28, 56 and 84 and the average weight was determined. Growth was estimated from average weight in each of
Ž . the three tanks receiving each dietary treatment. Specific growth rate SGR was
Ž .
calculated using the equation of Ricker 1979 . FCRs were calculated from weight of
Ž . Ž .
feed consumed grams of apparent DM feed intake divided by wet weight gain grams . After the termination of the growth experiment, 10 fish from each tank were killed with
Ž .
an overdose of MS222 tricaine methane sulfonate after 48 h food deprivation and immediately frozen aty608C until analyzed for body composition.
2.2. Nutrient digestibility
After the growth trial, remaining fish were fed the experimental diets supplemented
Ž . Ž .
with an inert marker, chromium III oxide Cr O , 5 grkg for an additional 4 weeks2 3 ŽAustreng, 1978 ..
It was obvious from our preliminary work designed to evaluate faecal collection methods that it is very difficult to separate faeces from water. In addition, escapement of eels from the tanks was a major problem. Other common methods using collection of rectal contents by manually stripping, anal suction, metabolic chambers or dissecting the fish could not be applied to eels. Moreover, forced evacuation of the rectum results in the addition of enzymes, bodily fluids and intestinal epithelial cells to the rectal contents
Ž .
resulting in under-estimated digestibility coefficients Cho et al., 1982 . Ž .
Fish were housed in 10 glass aquariums 60 l for digestibility measurements. After the last feeding of the day, the tanks were completely cleaned of any feed and faeces
Ž .
Table 1
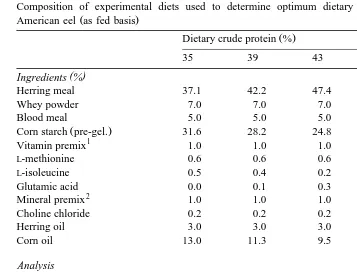
Composition of experimental diets used to determine optimum dietary protein requirement of juvenile
Ž .
Herring meal 37.1 42.2 47.4 52.5 57.7
Whey powder 7.0 7.0 7.0 7.0 7.0
Blood meal 5.0 5.0 5.0 5.0 5.0
Ž .
Corn starch pre-gel. 31.6 28.2 24.8 21.4 18.9
1
Vitamin premix 1.0 1.0 1.0 1.0 1.0
L-methionine 0.6 0.6 0.6 0.6 0.6
L-isoleucine 0.5 0.4 0.2 0.0 0.0
Glutamic acid 0.0 0.1 0.3 0.5 0.5
2
Mineral premix 1.0 1.0 1.0 1.0 1.0
Choline chloride 0.2 0.2 0.2 0.2 0.2
Herring oil 3.0 3.0 3.0 3.0 3.0
Crude protein % 34.6 39.1 43.1 47.5 50.6
Ž .
Lipid % 19.5 17.6 16.3 15.6 13.5
Ž .
Ash % 4.8 5.3 5.8 6.5 6.9
Ž .
Carbohydrate % 33.1 30.5 27.5 23.7 21.7
Ž .
Gross energy MJrkg 21.3 21.3 21.3 21.3 20.9
Ž .
Digestible protein % 29.4 35.0 39.1 43.0 46.6
Ž .
Digestible energy MJrkg 18.2 18.9 19.2 19.3 19.2
Ž .
PrE ratio g DPrMJ DE 16.2 18.5 20.4 22.3 24.3
1 Ž .
Vitamin premix mgrkg or IU : vitamin A, 6000 IU; vitamin D, 4000 IU; vitamin E, 250 IU; vitamin K
Žmenadione sodium bisulphite , 30 mg. rkg; thiamin, 40 mgrkg; riboflavin, 50 mgrkg;D-calcium
pantothen-Ž . Ž .
ate, 150 mgrkg; biotin 1% , 0.8 mgrkg; folic acid, 15 mgrkg; vitamin B12 0.1% , 0.05 mgrkg; niacin, 200
Ž .
mgrkg; pyridoxine, 30 mgrkg; ascorbic acid phosphate, 15% , 200 mgrkg; inositol, 400 mgrkg; ethoxyquin, 125 mgrkg.
y608C. For individual tanks, faeces were pooled, lyophilized Edwards High Vacuum .
Freeze-Dryer, Manor Royal, Crawley, West Sussex, England and finely ground.
Ž .
Apparent digestibility coefficients ADC of organic matter, protein and energy were
Ž .
calculated by the formula of Cho et al. 1974 .
2.3. Chemical analysis
Ž . Ž .
5508C AOAC, 1984 , organic matter calculated as 100y percentage ash , lipid by
Ž . Ž
ether extraction Tecator Soxtec System HT2 1045 Extraction Unit following acid 4N
. Ž . Ž
HCl hydrolysis 1047 Hydrolyzing Unit , total nitrogen by the Dumas method Ebling,
. Ž .
1968 using a Leco nitrogen determinator model FP-228, Leco, St. Joseph, MI with protein calculated as N)6.25, moisture by weight loss after drying for 24 h at 1058C
ŽAOAC, 1984 and gross energy by an adiabatic bomb calorimeter Parr Instrument,. Ž .
Moline, IL . Chromium content of diets and faeces was measured
spectrophotometri-Ž .
cally using a micro-method outlined by Suzuki and Early 1991 .
2.4. Statistical procedures
All statistical analysis on growth data were performed according to Steel and Torrie Ž1960 . A 5% level of probability was chosen in advance to sufficiently demonstrate a. statistically significant difference. Statistical analysis was performed using Statistical
Ž .
Analysis System 1992 . Treatment means were differentiated using least square means "SEM if ANOVA showed significant differences. Mortality data were compared by
Ž .
G-test based on the intrinsic null hypothesis ay2 degrees of freedom that treatment
Ž .
had no significant effect on mortality Sokal and Rohlf, 1969 . Where the null hypothesis was rejected, pair-wise comparisons were made by calculating the 95%
Ž .
confidence interval by use of the Bonferroni Z statistic Neu et al., 1974 . Within the
Ž .
51% protein treatment, one of the tanks had significantly P-0.05 higher mortality than the other two replications, therefore, data from this tank were removed from the analysis of the growth data.
3. Results and discussion
3.1. Growth
Chemical analysis of the experimental diets indicated that the formulated protein
Ž . Ž .
levels were achieved. Desired analyzed crude protein levels percentage as fed in the
Ž . Ž . Ž . Ž . Ž .
diets were 35.0 34.6 , 39.0 39.1 , 43.0 43.1 , 47.0 47.5 and 51.0 50.6 .
The pattern of growth was similar prior to 56 days on test. The mean weight of fish
Ž .
fed diets containing 47% and 51% protein were significantly P-0.05 higher than those fed the 35, 39 and 43% protein diets. This difference persisted for the duration of the experiment with final weights of fish fed 47% and 51% protein being similar to each
Ž .
other and approximately 17% higher P-0.05 than those fed lower amounts of protein ŽTable 2 . SGR was 19% higher P-. Ž 0.05 when dietary protein levels were 47% and.
Ž .
51% than those fed the lower protein diets Table 2 . The most efficient FCR was
Ž . Ž .
Table 2
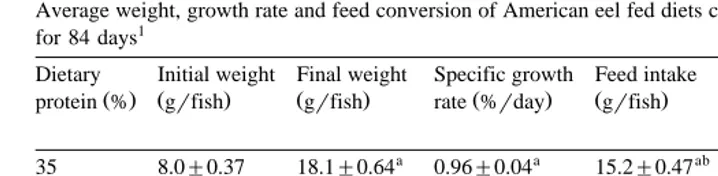
Average weight, growth rate and feed conversion of American eel fed diets containing graded levels of protein for 84 days1
Dietary Initial weight Final weight Specific growth Feed intake Feed conversion Mortality
Ž . Ž . Ž . Ž . Ž . Ž
Means"SEM of three replicates and values within the same column with different superscripts are
Ž .
significantly different P-0.05 .
The growth performance of eels measured as final weights, SGRs and FCRs improved as protein level in the diet increased to 47% protein then either leveled off or declined when 51% protein was fed. Results indicate that by increasing dietary protein above the 47% level, there is no significant benefit for growth improvement of juvenile American eel.
The growth performance results support past researchers who have concluded that high extremes of protein are not used for normal protein metabolic functions, such as tissue growth, but are instead used as a comparatively inefficient energy source ŽWattendorf, 1980 and that excesses of protein are, therefore, not likely to be beneficial. ŽVan Limburgh, 1975 . Feed conversion not only leveled off, but declined after 47%.. These findings are consistent with other reports, where reduced growth performance was
Ž .
observed when high protein diets were fed to catfish Dupree and Sneed, 1966 and
Ž .
Japanese eel Nose and Arai, 1973 .
By the end of the experiment, mortality of eels fed 47% protein was higher than the
Ž .
other groups. All mortalities observed were small eels mean weight, 7.9"0.23 g that displayed bite marks on their bodies. Based on this, it is felt that the higher growth rate in the 47% group led to higher variation between large and small eels and, ultimately, more aggressive behaviour within these tanks. It should be noted that this high mortality may slightly overvalue the final mean weight of animals in this group.
Ž .
The results obtained are in close agreement with Nose and Arai 1973 who reported that beyond 45% crude protein, growth and protein accumulation were nearly constant in
Ž .
Japanese eel. The small difference 2% observed in protein requirement may be attributed to the differences in the diet components, growth stage and water temperature.
Ž .
Nose and Arai 1973 used a purified diet with casein as a major source of protein compared to a practical diet containing fish-meal in this study. The protein digestibility
Ž .
of casein is significantly higher than fish-meals National Research Council, 1993 , therefore, the quantitative dietary protein need would tend to be lower than for fish-meals. The present study was undertaken to obtain information that can be directly applied for the feed formulation of commercial juvenile American eel diets. De La
Ž .
Higuera et al. 1989 also indicated that protein requirement should be determined by
Ž .
Ž .
smaller fish initial mean weight, 3.0 g at 258C, whereas our study was conducted with larger fish at 228C. Although the effect of water temperature on protein requirement is relatively small, some of the differences may be attributed to increase in nutrient
Ž .
retention at high temperatures. Earlier work of Wattendorf 1980 also suggests that protein requirement of juvenile American eel is close to 48%.
3.2. Digestibility
Several faecal sampling methods were attempted including sedimentation and
collec-Ž .
tion via a column of still water Guelph system , manually stripping and siphoning. The Guelph system was unacceptable due to the eels’ ability to escape through the perforations on the tank bottom intended to collect faecal material. Manually stripping was very laborious and produced poor samples fouled with skin surface mucous and, in some instances, blood. Siphoning of faecal material from the stand pipe area of the tank yielded intact faecal pellets and the leaching of the nutrients was minimal. Faecal samples obtained in this manner appeared intact, firm, unspoiled and of high quality
Ž
with dry matter contents consistent with those from the literature Schmitz et al., 1984; .
De La Higuera et al., 1989 . On this basis, siphoning method was adopted for this study. Digestibilities of organic matter, protein and energy ranged from low for the 35%
Ž .
protein diet to high for diets containing 51% protein Table 3 . The remaining diets had similar digestibility to the 51% protein diet.
Organic matter digestibility of the experimental diets showed a significant increase ŽP-0.05 from 82% to 90% as protein content of the diet increased. All these values. were higher than 82% indicating that all experimental diets were well utilized by the
Ž .
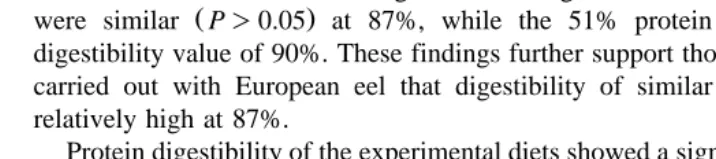
eels. Digestibility of organic matter for the 35% protein diet was significantly P-0.05 lower than all the other diets. Organic matter digestibilities for the 39–47% protein diets
Ž .
were similar P)0.05 at 87%, while the 51% protein diet showed the highest
Ž .
digestibility value of 90%. These findings further support those of Schmitz et al. 1984 carried out with European eel that digestibility of similar fish-meal-based diets are relatively high at 87%.
Ž .
Protein digestibility of the experimental diets showed a significant increase P-0.05 when more than 35% protein was fed. Digestibility for the 35% protein diet was 85%,
Table 3
1 Ž .
Apparent digestibility coefficients % for organic matter, protein and gross energy for the diets containing graded levels of protein fed to juvenile American eel
Dietary Organic matter Protein Gross energy
Ž .
Means"SEM of two replicates and values within the same column with different superscripts are
Ž .
Table 4
1 Ž .
Body composition wet weight basis of juvenile American eel fed the diets containing graded levels of protein after 84 days
Ž . Ž . Ž . Ž .
Moisture % Protein % Lipid % Gross energy kJrg
Initial 69.6 17.1 10.0 7.0
Means"SEM of three replicates and values within the same column with different superscripts are
Ž .
significantly different P-0.05 .
whereas the remaining diets were similar, averaging 91% digestibility. Schmitz et al. Ž1984 reported a similar protein digestibility coefficient of 94% for a fish-meal-based. diet.
Digestible energy coefficient of the experimental diets showed a similar pattern as the protein digestibility. Digestible energy coefficient for the 35% protein diet was 85%, whereas the remaining diets were similar, averaging 90% digestible. The lower di-gestibility of the 35% protein diet may be explained on the basis of diet formulation and ingredient composition. Corn starch was used to balance the energy content of the diets. In these diets, protein level increased from 35% to 51%, whereas carbohydrate level decreased from 33% to 22%. It is likely that the eels were not able to utilize the high amount of starch present in the low protein diet. Similar effects have been reported for
Ž .
rainbow trout fed similar diets Luquet, 1971; Bergot, 1979 . In general, nutrient digestibility was not significantly affected by the level of protein in the diet when the carbohydrate level was below 30%. These finding are in agreement with De La Higuera
Ž .
et al. 1989 who found that nutrient digestibility was independent of dietary protein
Ž .
level. Arai 1991 also observed that the optimum dietary level of carbohydrate for Japanese eel was in the range of 20–30%.
Table 5
Carcass protein, lipid and energy gain of juvenile American eel fed the diets containing graded levels of protein after 84 days1
Dietary Protein gain Lipid gain Energy gain
Ž . Ž . Ž . Ž .
Means"SEM of three replicates and values within the same column with different superscripts are
Ž .
3.3. Nutrient retention
Ž . Ž .
Body composition Table 4 and nutrient retention Table 5 showed a similar
Ž .
response to the growth parameters. The highest carcass protein and lipid gains P-0.05 were observed in fish fed diets containing 47% protein, further supporting our view that an increase in dietary protein beyond 47% produces no significant benefit in terms of
Ž . Ž
growth. Similar results were reported for grass carp Dabrowski, 1977 , snakehead Wee
. Ž . Ž
and Tacon, 1982 , Japanese eel Nose and Arai, 1973 and common carp Ogino and .
Saito, 1970 . Little difference in carcass energy gain was observed due to the change in dietary protein level. This was not surprising as the five diets were formulated to be isoenergetic and differences in energy digestibility were negligible.
4. Conclusions
The results indicate that juvenile American eel growing from 8 to 22 g body weight require approximately 47% protein in their diet for optimum growth and feed utilization. There were no obvious benefits in terms of growth and nutrient retention beyond this level. On the basis of this study, 47% crude protein or 22 g DPrMJ DE is recommended for practical feed formulation of juvenile American eel diets. The protein requirement and the nutrient digestibility information established should be useful for further development of grower diets for juvenile American eel and to minimize the nitrogenous waste output in American eel culture systems.
Acknowledgements
This work was supported by a grant from the CanadarNova Scotia Aquaculture Cooperative Agreement and a grant from the Department of Fisheries and Oceans. Fish rearing and laboratory facilities were provided by the Nova Scotia Agricultural College, Truro, Nova Scotia, the Department of Fisheries and Oceans, Halifax, Nova Scotia and the National Research Council, Halifax, Nova Scotia. Analytical and technical assistance by Mrs. Margie Hartling, Dr. Tessama Astatkie, Mr. Chris Giles, Dr. Jim Duston and Dr. Dick Peterson are greatly appreciated. The critical review and valuable suggestions of Dr. Jeong-Dae Kim and Mrs. Joyce Milley during the preparation of this manuscript is also gratefully acknowledged.
References
AOAC, 1984. Official Methods of Analysis. 13th edn. Assoc. Off. Anal. Chem., Washington, DC.
Ž .
Arai, S., 1991. Eel, Anguilla spp. In: Wilson, R.P. Ed. , Handbook of Nutrient Requirements of Finfish. CRC Press, Boca Raton, FL, pp. 69–75.
Arai, S., Mas Alvarez, B., Ogata, H., 1986. Optimum protein level in purified diet for growth of European eel
ŽAnguilla anguilla . Abstr. 4th World Congress on Animal Feeding, Madrid, Spain. GDRSI, Madrid, Short.
Ž .
Arai, S., Nose, T., Hashimoto, Y., 1971. A purified test diet for the eel Anguilla japonica . Bull. Freshwater Fish. Res. Lab. 21, 161–178.
Ž .
Arai, S., Nose, T., Hashimoto, Y., 1972. Amino acids essential for growth of eels Anguilla anguilla and ŽAnguilla japonica . Bull. Jpn. Soc. Sci. Fish. 38, 753–759..
Austreng, E., 1978. Digestibility determination in fish using chromic oxide marking and analysis of contents from different segments of the gastrointestinal tract. Aquaculture 13, 254–272.
Bergot, F., 1979. Carbohydrate in rainbow trout diets: effects of the level and source of carbohydrate and the number of meals on growth and body composition. Aquaculture 18, 157–167.
Cho, C.Y., Bayley, H.S., Slinger, S.J., 1974. Partial replacement of herring meal with soybean meal and other
Ž .
changes in a diet for rainbow trout Salmo gairdneri . J. Fish. Res. Board Can. 13, 1523–1528. Cho, C.Y., Slinger, S.J., Bayley, H.S., 1982. Bioenergetics of salmonid species: energy intake, expenditure
and productivity. Comp. Biochem. Physiol. 73B, 25–41.
Ž .
Dabrowski, K., 1977. Protein requirements of grass carp fry Ctenopharyngodon idella . Aquaculture 12, 63–73.
Dave, G., Johansson, M.L., Larsson, A., Lewander, K., Lidman, U., 1974. Metabolic and hematological
Ž .
studies on the yellow and silver phases of the European eel Anguilla anguilla : II. Fatty acid composition. Comp. Biochem. Physiol. 47B, 583–591.
Dave, G., Johansson, M.L., Larsson, A., Lewander, K., Lidman, U., 1976. Metabolic and hematological
Ž .
effects of starvation in the European eel Anguilla anguilla : III. Fatty acid composition. Comp. Biochem. Physiol. 53B, 509–515.
Degani, G., Horowitz, A., Levanon, D., 1985. Effect of protein level in purified diet and of density, ammonia
Ž .
and O level on growth of juvenile European eels Anguilla anguilla L. . Aquaculture 46, 193–200.2
Degani, G., Levanon, D., Trieger, G., 1984. Preliminary study on the influence of different feeds on mortality
Ž .
and growth of eels Anguilla anguilla in the initial period. Bamidgeh 36, 47–52.
De La Higuera, M., Garcia Gallego, M., Sanz, A., Hidalgo, M.C., Suarez, M.D., 1989. Utilization of dietary
Ž .
protein by the eel Anguilla anguilla : optimum dietary protein levels. Aquaculture 79, 53–61.
Dupree, H.K., Sneed, K.E., 1966. Response of channel catfish fingerlings to different levels of major nutrients in purified diets. U.S. Fish Wildf. Serv. Tech. Paper 9, p. 21.
Ebling, M.E., 1968. The Dumas method for nitrogen in feeds. J. Assoc. Off. Anal. Chem. 51, 766–770. Luquet, P., 1971. Efficacite des proteines en relation avec leur taux d’incorporation dans l’alimentation de la
truite arc-en-ciel. Annu. Hydrobiol. 2, 175–186.
National Research Council, 1993. Nutrient Requirements of Fish. National Academy Press, Washington, DC. Neu, C.W., Byers, C.R., Peek, J.M., 1974. A technique for analysis of utilization-availability data. J. Wildl.
Manage. 38, 541–545.
Nose, T., 1979. Summary report on the requirements of essential amino acids for carp. In: Halver, J.E., Tiews,
Ž .
K. Eds. , Finfish Nutrition and Fishfeed Technology. Heenemann, Berlin, pp. 138–150.
Ž .
Nose, T., Arai, S., 1973. Optimum level of protein in purified diet for eel Anguilla japonica . Bull. Ž .
Freshwater Fish. Res. Lab. 22 2 , 145–155.
Ogino, C., Saito, K., 1970. Protein nutrition in fish: 1. The utilization of dietary protein by young carp. Bull. Jpn. Soc. Sci. Fish. 36, 250–254.
Ž .
Otwell, W.S., Rickards, W.L., 1981. Cultured and wild American eels Anguilla rostrata : fat content and
fatty acid composition. Aquaculture 26, 67–76.
Ž .
Ricker, W.E., 1979. Growth rates and models. In: Hoar, W.S., Randall, D.J., Brett, J.R. Eds. , Fish Physiology. Academic Press, New York, pp. 677–743.
Schmitz, O., Greuel, E., Pfeffer, E., 1984. Digestibility of crude protein and organic matter of potential sources
Ž .
of dietary protein for eels Anguilla anguilla . Aquaculture 41, 21–30. Sokal, R.R., Rohlf, F.J., 1969. Biometry. W.H. Freeman, San Francisco.
Spannhof, L., Kuhne, H., 1977. Studies regarding the utilization of different feed mixes by European eels
ŽAnguilla anguilla . Arch. Tierernaehr. 27 8 , 517–531.. Ž .
Statistical Analysis System., 1992. SAS User’s Guide: Statistics, 6th edn. Statistics Analysis Systems, Cary, NC.
Steel, R.G.D., Torrie, J.H., 1960. Principles and Procedures of Statistics. McGraw-Hill, New York. Suzuki, E.Y., Early, R.J., 1991. Analysis of chromic oxide in small samples of feeds and faeces using chlorine
Ž .
Takeuchi, T., Arai, S., Watanabe, T., Simma, Y., 1980. Requirement of eel Anguilla japonica for essential fatty acids. Bull. Jpn. Soc. Sci. Fish. 46, 345–353.
Van Limburgh, C.L., 1975. Formula feeds and fish nutrition. External Report NR 27, TROUW, Putten, Holland, 10 pp.
Ž .
Wattendorf, R.J., 1980. The effect of diet on growth and amino acid composition of elvers Anguilla rostrata . MSc thesis, North Carolina State University, 80 pp.
Wee, K.L., Tacon, A.G.J., 1982. A preliminary study on the dietary protein requirement of juvenile snakehead.
Ž .