* Corresponding author
RICE CROP MONITORING AND YIELD ESTIMATION THROUGH COSMO SKYMED
AND TERRASAR-X: A SAR-BASED EXPERIENCE IN INDIA
S. Pazhanivelana,*, P. Kannana, P.Christy Nirmala Marya, E.Subramaniana, S. Jeyaramana, Andrew Nelsonb, Tri setiyonob, Francesco Holeczc,Massimo barbiericand Manoj Yadavd
aTamil Nadu Agricultural University, Coimbatore, Tamilnadu, India- [email protected] [email protected], [email protected], [email protected], [email protected] b
International Rice Research Institute (IRRI), Los Banos 4031, Philippines - [email protected], [email protected] c
Sarmap, Purasca 6989, Switzerland - [email protected], [email protected] d
Deutsche Gesellschaft für Internationale Zusammenarbeit (GIZ) GmbH, New Delhi 110029, India - [email protected]
KEY WORDS: Rice, Food Security, SAR, Yield Estimation, ORYZA, COSMO Skymed, TerraSAR-X
ABSTRACT:
Rice is the most important cereal crop governing food security in Asia. Reliable and regular information on the area under rice production is the basis of policy decisions related to imports, exports and prices which directly affect food security. Recent and planned launches of SAR sensors coupled with automated processing can provide sustainable solutions to the challenges on mapping and monitoring rice systems. High resolution (3m) Synthetic Aperture Radar (SAR) imageries were used to map and monitor rice growing areas in selected three sites in TamilNadu, India to determine rice cropping extent, track rice growth and estimate yields. A simple, robust, rule-based classification for mapping rice area with multi-temporal, X-band, HH polarized SAR imagery from COSMO Skymed and TerraSAR X and site specific parameters were used. The robustness of the approach is demonstrated on a very large dataset involving 30 images across 3 footprints obtained during 2013-14. A total of 318 in-season site visits were conducted across 60 monitoring locations for rice classification and 432 field observations were made for accuracy assessment. Rice area and Start of Season (SoS) maps were generated with classification accuracies ranging from 87- 92 per cent. Using ORYZA2000, a weather driven process based crop growth simulation model; yield estimates were made with the inclusion of rice crop parameters derived from the remote sensing products viz., seasonal rice area, SoS and backscatter time series. Yield Simulation accuracy levels of 87 per cent at district level and 85- 96 per cent at block level demonstrated the suitability of remote sensing products for policy decisions ensuring food security and reducing vulnerability of farmers in India.
1.INTRODUCTION
1.1. Synthetic Aperture Radar for Mapping Rice Area Rice is the most staple cereal food crop for ensuring food security in Asia (Maclean et al., 2013). Rice still accounts for 31% of the calorific intake being the largest single source of calories for more than 3.7 billion people in Asian countries even with rapid urbanization and diversification in consumption patterns, (FAOSTAT, 2014 and Timmer et al., 2010). Accurate and consistent information on the area under production is necessary for national planning in many countries, but conventional statistical methods cannot always meet the requirements of food security research and policy (Xiao et al., 2006 and Gumma et al., 2014). This information is vital to the policy decisions related to imports, exports and prices, which directly influence food security, especially amongst the poor (Balagtas et al., 2014, Mittal et al., 2009 and Dawe et al., 2012). Remote sensing has the scope for cost effective precise estimates of rice area to support, augment, improve or even replace survey and statistical methods (Gumma et al., 2014). But the technical challenges are many in the development of large scale dynamic remote sensing-based rice crop information systems. Rice cultivation during the monsoon season (Huke and Huke, 1997) which has wide cloud cover (NASA, 2014), wide range of conditions and environments, small land holdings and diverse and mixed cropping systems (Nguyen et al., 2012) are the most challenging factors in limiting the use of remote sensing as tool for rice crop monitoring.
1.2. Background of SAR Research and Applications for Rice Mapping
SAR data have a proven ability to detect lowland rice systems (both irrigated and rainfed) through the unique temporal signature of the backscatter coefficient (also termed sigma naught or σ°) exhibited by the crop. In the past years, a large number of publications have been dedicated to better understanding this relationship and applying it to rice detection and rice monitoring (Le Toan et al., 1997, Inoue et al., 2002, Suga and Konishi, 2008, and Bouvet et al., 2009). In summary, these studies have shown that lower frequencies (L- and C-band) penetrate deeper into the rice plant than higher frequencies, while only higher frequencies (X-band) interact with grain water content and grain weight sufficiently to show a dual-peak signal in σ° during the rice season (Inoue et al., 2002, Suga and Konishi, 2008, Oh et al., 2009 and Kim et al., 2009). Further, short wavelengths (X-, Ka-, Ku-band), especially at large incident angles, are sensitive enough to detect even very small rice seedlings just after transplanting. The correlation between σ° and rice biophysical parameters shows that lower frequencies are more closely related to total fresh weight, leaf area index (LAI) and plant height than other parameters (Inoue et al., 2009 and Kim et al., 2009).
Although σ° from X-band is poorly correlated with LAI, it is best correlated with panicle biomass indicating the suitability for a direct assessment of rice grain yield (Inoue and Sakaiya, 2013 and Inoue et al., 2014). On the other hand, σ° derived from C-band can provide information on par with the normalized difference vegetation index (NDVI) (Inoue et al., 2014). For X-band, the HH/VV polarization ratio continuously changes as a function of phenology during the vegetative and reproductive stages (Lopez-Sanchez et al., 2011). For X-band, the HH-VV phase difference is sensitive to early rice plant emergence. Moreover, the use of four polarimetric features derived from coherence coplanar dual-polarization X-band enables the estimation of five phenological stages from a single date scene (Inoue et al., 2002, Lopez-Sanchez et al., 2011 and Lopez-Sanchez et al., 2012).
It is clear from the literature that well-understood relationships exist between rice crop characteristics and backscatter coefficients from different wavelengths, and these relationships have been used to derive different types of algorithms for estimating rice crop characteristics from SAR data. Another approach for sparse time series is to extract temporal features from the data and relate those to the known temporal dynamics of the rice crop and use that knowledge to classify areas as rice or non-rice (Holecz et al., 2013). All of these approaches have been demonstrated successfully in the literature. Supervised classifiers rely on a substantial set of good-quality training data to ensure a good classification, and there is a risk of over-fitting the classification.
For this reason, a rule-based classification approach is tested for rice area mapping that is based on a small number of rules and parameters that can be quickly fine-tuned from site to site and season to season. Conceptually, the classification approach is based on rules that are agronomically meaningful and, thus, easily understood and easily fine-tuned based on the
local knowledge of the rice-growing environment and the key rice-growing stages.
1.3. Rice Growing Stages and Key Characteristics for SAR Based Detection
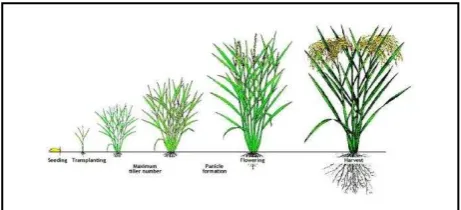
Rice in subtropical India is mainly cultivated in irrigated or lowland semidry conditions. Rice varieties range in duration from 90 to more than 150 days and with three main crop stages: vegetative (from germination to panicle initiation, from 45 to 100 days), reproductive (from panicle initiation to flowering, around 35 days) and maturity (from flowering to mature grain, around 30 days) (Figure 1). The following aspects contribute to the change in space occupied by the rice plants within a three-dimensional space: (1) appearances and growth of leaves from the main stem (culm) and tillers; (2) stem development and elongation; (3) tillering, defined as the production of stems from rice plants; (4) leaf senescence; and (5) panicle and grain development.Prior to transplanting, the rice field is flooded with water at depths ranging from 2 to 15 cm (Le Toan et al., 1997). This deliberate agronomic flooding is a key element of most remote-sensing rice detection algorithms (Boschetti et al., 2014).
Figure 1. Rice crop stages. Image from the International Rice Research Institute (IRRI)-Rice Knowledge Bank.
spatial distribution of rice fields and improves the yield estimation figures by forcing the model towards actual rather than attainable yields.
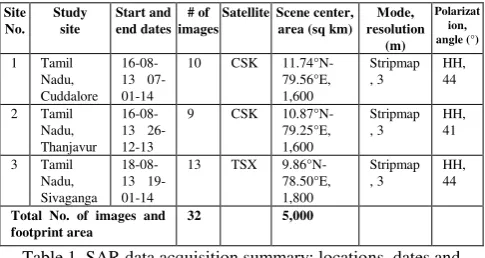
2.1. SAR Data
Multi-temporal X-band SAR Single Look Complex (SLC) data were obtained from the Italian Space Agency (ASI/e-GEOS) for COSMO-SkyMed (CSK) data and from InfoTerra GmbH for TerraSAR-X (TSX) data. In both the cases, data were obtained in HH polarization with consistent incidence angles in each multi-temporal stack, ranging from 41 to 44 degrees across sites. A large incidence angle is preferred, because (i) wind effects on water (in particular, during land preparation prior to transplanting) are significantly decreased, (ii) the dynamic of the radar backscatter is larger and (iii) the spatial resolution is higher. The image acquisition dates, locations, mode, pixel size, polarization and incidence angles are shown in Table 1. Image mode, extent, pixel size, polarization and incidence angles were constant for each footprint. CSK data are available from four X-band HH-SAR satellites with a 3.12-cm wavelength and a 16-day revisit period for the same satellite with the same observation angle. CSK data on Stripmap mode (3-m resolution) was used at two sites with a footprint of 40 × 40 km. Acquisition plans were made using one primary satellite from the constellation for each site with backup plans in place for the second, third and fourth satellites in the constellation in the event of a cancellation.TSX is provided by one X-band HH SAR satellite with a 3.11-cm wavelength and 11-day revisit period with the same observation angle. TSX data on Stripmap mode (3 m resolution) was used at one site with a footprint of 30 × 50 km.
Satellite Scene center, area (sq km)
Table 1. SAR data acquisition summary: locations, dates and modes used for 2013 Samba season.
2.2. Field Observations for Calibration of the Rice Detection Algorithm and Map Validation
Field observations were performed throughout the season in up to 20 paddy fields within each footprint. These fields were selected, with the farmers‘ consent, prior to the start of the rice season and the image acquisition schedule. Observations were made on or as close to the image acquisition date as possible. Observations included latitude and longitude from handheld GPS receivers, descriptions and photos of the status of the field, plant height, water depth, weather conditions, crop stage and leaf area index (LAI). The same field data collection protocols were used at all sites. LAI measurements were taken only during visits between seedling and flowering
stages, and these were recorded non-destructively using AccuPAR LP-80 Ceptometer (Decagon Devices, Inc., Pullman, WA, USA). At the end of the season, the farmer was interviewed to collect information on the rice variety, water source, crop management and establishment practices, as well as inputs, such as pesticide and fertilizer.
In total, 58 locations were regularly monitored across the three footprints, with 432 separate visits made to these locations to collect in-season information on the status of the rice crop. A validation exercise was conducted for each footprint to assess the accuracy of the rice classification. A rapid land cover appraisal method was adopted to collect land cover information at approximately 100 locations throughout each footprint with these points split 50/50 between non-rice points and rice points. This conforms to the minimum number of samples per land cover class accounting. These map validation assessments were generally conducted in-season, in the reproductive or ripening stage before harvesting, but in some cases, the assessment was conducted post-season. Locations were chosen such that the land cover was homogeneous in a 15-m radius around each GPS point for sites using 3-m resolution imagery and a 50-m radius for sites using 10-m or 15-m resolution imagery.
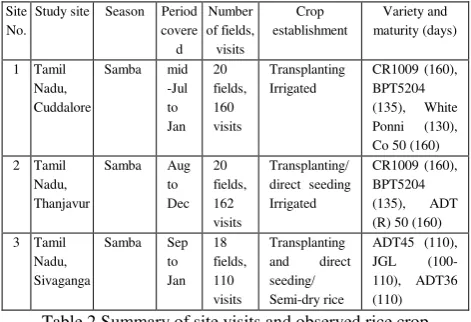
2.3. Study Site Characteristics
such as CR1009, BPT5204 and ADT (R) 50 were mainly grown, with duration from 135 to 150 days.
3. METHODS
The SAR time-series data underwent a series of basic processing steps to generate terrain-geocoded σ° values suitable for analysis. This multi-temporal stack was analyzed using a rule-based classifier to detect rice areas. The rules for the classifier were based on a small number of parameters that must be selected by the operator or user. Temporal feature descriptors were derived from temporal signatures in the monitored fields yield maps were generated.
Table 2.Summary of site visits and observed rice crop characteristics during the monitored seasons.
3.1. Basic Processing of SAR Data for Multi-Temporal Analysis
A fully automated processing chain was developed to convert the multi-temporal space-borne SAR SLC data into terrain-geocoded σ° values. The processing chain is a module within the MAPscape-RICE software (Holecz et al., 2013). The basic processing chain included strip mosaicking , co-registration of Images acquired with the same observation geometry and mode and, Time-series speckle filtering to balance differences in reflectivity between images at different times (De Grandi et al., 1997) and terrain geocoding, radiometric calibration and normalization. Further
Anisotropic non-linear diffusion (ANLD) filtering was done to smoothen homogeneous targets, while enhancing the difference between neighbouring areas. The filter uses the diffusion equation, in which the diffusion coefficient, instead of being a constant scalar, is a function of image position and assumes a tensor value (Aspert et al., 2007).
3.2. Multi-Temporal σ° Rule-Based Rice Detection
The multi-temporal stack of terrain-geocoded σ° images was put into a rule-based rice detection algorithm in MAPscape-RICE. The temporal evolution of σ° was analyzed from an agronomic perspective, based on prior knowledge of rice maturity, calendar and duration and crop practices from
field information and knowledge of the study location. The temporal signature was frequency and polarization dependent and also relied on the crop establishment method and, to some extent, on crop maturity. The general rules were applied to detect rice, but that the parameters for these rules were adapted according to the agro-ecological zone, crop practices and rice calendar.
The choice of parameters was guided by a simple statistical analysis of the temporal signature of σ° values in the monitored fields. The mean, minimum, maximum and range of σ° were computed for the temporal signature of each monitored field. Further, (i) minima and (ii) maxima of those mean σ° values across fields; the (iii) maxima of the minimum σ° values across fields; the (iv) minima of the maximum. σ° value across fields; and the (v) minimum and (vi) maximum of the range of σ° values across fields were calculated. These six statistics, called as temporal features, concisely characterized the key information in the rice signatures of the observed fields, and each one related directly to one parameter. Hence, the value of the six temporal features from the monitoring locations at each site were used to guide the choice of the six parameter values based on which the rice pixels were classified and the rice area maps were generated.
3.3. Rice Map Accuracy Assessment
A standard confusion matrix was applied to the rice/non-rice validation points collected at each site. The overall accuracy of the rice/non-rice classification and the kappa value were recorded. The accuracy assessment was a comparison of the classified rice map against ground-truth data. The spatial resolution of the rice maps ranged from 3 m to 15 m. However, the ANLD filtering processes reduced the effective resolution by performing locally adaptive smoothing and edge detection. To account for this lower resolution and the horizontal accuracy of the handheld GPS units relative to the pixel size, the validation data were collected in areas that had homogeneous land cover in a 15m radius the around each GPS point for sites considering 3m resolution of the imagery.
3.4. Rice yield estimation
The yield was estimated using ORYZA2000, a crop growth simulation model developed by IRRI (Boumman et al., 2001). The simulations account for water and nitrogen dynamics based on climatic, soil conditions and management practices. Irrigation and nitrogen fertilizer inputs are assumed as recommended for achieving attainable yield. LAI values at 50 days after emergence provided by the SoS efficiency, the spatial units for yield simulation are aggregated to 150 meter resolution.
4. RESULTS AND DISCUSSION 4.1. Rice Area Maps
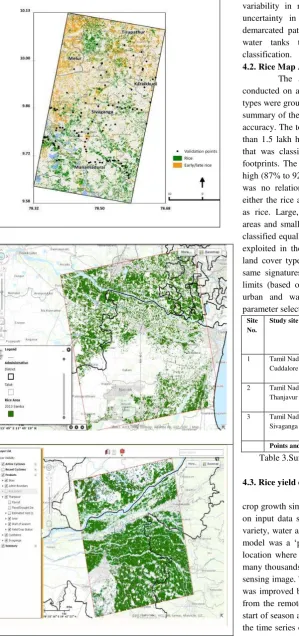
Figure 2 shows rice area maps derived from multi-temporal X-band SAR imagery for Sivaganga,Cuddalore and Thanjavur. Late rice and early rice were combined into one class and distinguished them from rice in the maps. Map accuracy considers any of the three rice subclasses as rice.
Site No.
Figure 2. Rice Area map of Sivaganga,Cuddalore and Thanjavur 2013
In the rice area map generated for Cuddalore, variability in rice crop establishment date was due to the uncertainty in the date of water availability. The clearly demarcated patches in the rice crop in the northern part are water tanks that were successfully excluded from the classification.
4.2. Rice Map Accuracy Assessment
The accuracy assessment for the rice maps was conducted on a rice/non-rice basis, where all other land cover types were grouped into a single non-rice class. Table 3 shows a summary of the validation data, rice area and rice classification accuracy. The total classified rice area across the 3 sites is more than 1.5 lakh hectares but the proportion of the footprint area that was classified as rice varied from 16% to 52% across footprints. The overall classification accuracy was consistently high (87% to 92%), with Kappa scores from 0.73 to 0.85. There was no relationship between the classification accuracy and either the rice area or the proportion of the footprint classified as rice. Large, homogeneous and landscape-dominating rice areas and small, fragmented, heterogeneous rice areas were all classified equally well. This rich non-rice dataset can be further exploited in the future to assess the SAR signatures of other land cover types commonly found in rice-growing areas. The same signatures can also be used to generate new bounding limits (based on the temporal signatures for other crops and urban and water surfaces, for example) to further guide parameter selection in the rule-based classifier.
Site No.
Study site Validation points and date(s) of validation
Rice area (ha) and as % of footprint
Accuracy and Kappa
1 Tamil Nadu, Cuddalore
111, 12-02-2014 and 03-03-2014
26,015, 16%
92%, 0.85
2 Tamil Nadu, Thanjavur
102, 31-01-2014 and 01-02-2014
83,871, 52%
91%, 0.82
3 Tamil Nadu, Sivaganga
110, 14-02-2014 and 21-02-2014
41,825, 24%
87% 0.73
Points and area (ha) 323 1,51,711
Table 3.Summary of site validation visits, rice area and accuracy assessments.
4.3. Rice yield estimation
the accuracy of the yield. In 2013 Samba season, District level, block level and field level rice yields were estimated and yield maps were generated across all the three sites.
District RIICE estimate (kg/ha)
Cuddalore 3816
Viluppuram 3786
Thiruvarur 4866
Thanjavur 4918
Ariyalur 4932
Sivaganga 4079
Madurai 4010
Table 4. Summary of rice yield estimates at district level.
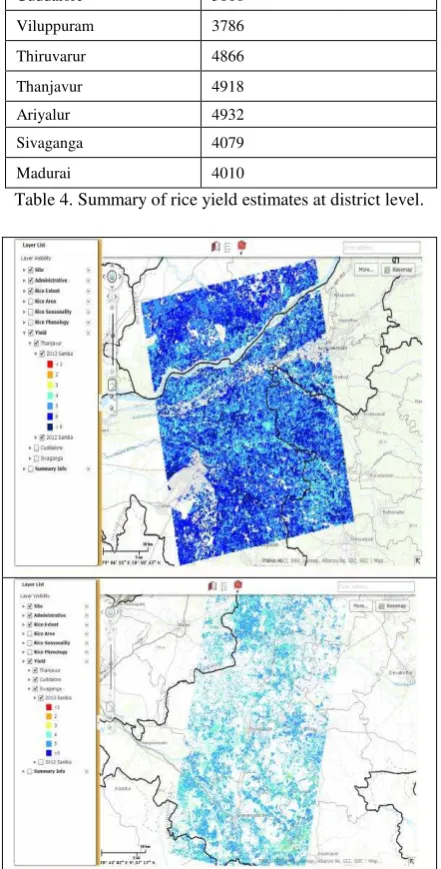
Figure.6.Rice yield map of Thanjavur and Sivaganga 2013 At district level an accuracy of 99% was achieved in Cuddalore followed Sivaganga and Thanjavur respectively with 88 and 86.7%. At block level it was interesting to come across an accuracy of 85-96% indicating the suitability of these products for policy decisions. At field level also, significantly higher accuracy was recorded for yield estimates derived using ORYZA model with Remote sensing based products indicating the scientific validation as compared to other methods of yield prediction.
The study demonstrated that rice area could be accurately classified with X-band HH polarization SAR images across multiple environments and management conditions and rice yields could be estimated by integrating ORYZA model with Remote sensing based products. With the Current and forthcoming SAR systems, such as CSK, TSX, RADARSAT-2,
RISAT-1, Sentinel-1 and ALOS-2, there exists a vast scope for rice crop monitoring and yield estimation at national level.
Block District RIICE estimate (kg/ha)
Block District RIICE estimate
(kg/ha)
Cuddalore Cuddalore 4064 Kumbakona
n Thanjavur 4892
Virudhachalam Cuddalore 3542 Thanjavur Thanjavur 5092
Panruti Cuddalore 3763 Thiruvaiyaru Thanjavur 4615
Kurinjipadi Cuddalore 3667 Orattanadu Thanjavur 5123
Viluppuram Viluppuram 3911 Udaiyarpalai
yam Ariyalur 5054
Tirukkoyilur Viluppuram 3407 Ariyalur Ariyalur 4881
Ulundurpettai Viluppuram 3736 Karaikkudi Sivaganga 4173
Pondicherry Pondicherry 4063 Tiruppattur Sivaganga 4132
Mannargudi Thiruvarur 4943 Sivaganga Sivaganga 4070
Valangaiman Thiruvarur 4937 Manamadur
ai Sivaganga 4066
Needamangalam Thiruvarur 4630 Ilaiyankudi Sivaganga 4002
Papanasam Thanjavur 4844 Melur Madurai 4010
Table 5. Rice yield estimates at block level.
Sl. No
District RIICE estimate
(Kg/ha)
CCE
(Kg/ha)
RMSE
(Kg/ha)
NRM SE
(%)
Accura cy (%)
1 Sivaganga 4079 4635 555 12.0 88.0 2 Thanjavur 4918 5676 758 13.3 86.7 3 Cuddalore 3816 3854 38167 1.0 99.0 4 Thiruvarur 4866 5512 646 11.7 88.3
Table 6. RIICE CCE data vs. ORYZA2000 yield estimates at District level
Sl.No Block RIICE estimate (Kg/ha)
CCE (Kg/ha)
RMSE (Kg/ha)
NRM SE (%)
Accuracy (%) 1 Mannargudi 4943 5512 569 10.3 89.7 2 Papanasam 4844 5060 215 4.3 95.7 3 Kumbakonan 4892 5742 850 14.8 85.2 4 Cuddalore 4064 3854 209433 5.4 94.6 5 Tiruppattur 4132 4635 503 10.8 89.2
Table 7. RIICE CCE data vs. ORYZA2000 yield estimates at block level
5. CONCLUSIONS
The study demonstrates that regularly acquired X-band HH SAR imagery is suitable for rice crop monitoring across the major rice environments of South and Southeast Asia. The consistently high accuracy of the rice area classification across these sites demonstrates that the methodology is appropriate for rice detection across the most common rice agro-ecologies. The classification is based on a temporal analysis of the spectral signature, including a detection of agronomic flooding at the land preparation and/or seedling stage followed by a rapid increase in biomass relative to the duration of the vegetative stage of the varieties in the footprint. Yield Simulation accuracy of more than 87% at district level and 85-96% at block level from the study means that simulated yield matched observed yield perfectly indicating the suitability of these products for policy decisions ensuring food security besides reducing the vulnerability of smallholder rice farmers in India.
ACKNOWLEDGEMENTS
This work has been undertaken within the framework of the Remote Sensing-based Information and Insurance for Crops in Emerging economies (RIICE) program, financially supported by the Swiss Agency for Development and Cooperation (SDC). SAR data were provided by ASI/e-GEOS for COSMO-SkyMed and by InfoTerra GmbH for TerraSAR-X. The authors would like to thank International Rice Research Institute (IRRI), GIZ and Tamil Nadu Agricultural University for the institutional support and IRRI GIS Team and sarmap for the technical support.
REFERENCES
Aspert, F.; Bach-Cuadra, M.; Cantone, A.; Holecz, F.; Thiran, J.-P. Time-varying segmentation for mapping of land cover changes. In Proceedings of ENVISAT Symposium, Montreux, Switerland, 23–27 April 2007.
Attema E.P.W. and F.T. Ulaby. 1978. Vegetation modeled as a water cloud. Radio Science.13 (2): 357-364.
Balagtas, J.V.; Bhandari, H.; Cabrera, E.R.; Mohanty, S.; Hossain, M. Did the commodity price spike increase rural poverty? Evidence from a long-run panel in Bangladesh. Agric. Econ. 2014, 45,303–312.
Boschetti, M.; Nutini, F.; Manfron, G.; Brivio, P.A.; Nelson, A. Comparative analysis of normalised difference spectral indices derived from MODIS for detecting surface water in flooded rice cropping systems. PLoS One 2014, 9, e88741.
Bouman B.A.M. et al. 2001. ORYZA2000: modeling lowland rice, IRRI and Wageningen University.
Bouvet, A.; le Toan, T.; Lam-Dao, N. Monitoring of the rice cropping system in the Mekong delta using ENVISAT/ASAR dual polarization data. IEEE Trans. Geosci. Remote Sens. 2009, 47, 517–526.
Dawe, D.; Timmer, P.C. Why stable food prices are a good thing: Lessons from stabilizing rice prices in Asia. Glob. Food Sec. 2012, 1, 127–133.
De Grandi, G.F.; Leysen, M.; Lee, J.S.; Schuler, D. Radar reflectivity estimation using multiple SAR scenes of the same target: Technique and applications. In Proceedings of the 1997 IEEE International Geoscience and Remote Sensing ―Remote Sensing—A Scientific Vision for Sustainable Development‖ (IGARSS ‘97), Singapore, 3–8 August 1997; Volume 2, pp. 1047–1050.
FAO FAOSTAT. Available online: http:
//faostat3.fao.org/faostat-gateway/go/to/home/E (accessed on 1 June 2014).
Gumma, M.K.; Thenkabail, P.S.; Maunahan, A.; Islam, S.; Nelson, A. Mapping seasonal rice cropland extent and area in the high cropping intensity environment of Bangladesh using MODIS 500 m data for the year 2010. ISPRS J. Photogramm. Remote Sens. 2014, 91, 98–113.
Holecz, F.; Barbieri, M.; Collivignarelli, F.; Gatti, L.; Nelson, A.; Setiyono, T.D.; Boschetti, M.; Manfron, G.; Brivio, P.A.; Quilang, J.E.; et al. An operational remote sensing based service
for rice production estimation at national scale. In Proceedings of the Living Planet Symposium 2013, Edinburgh, UK, 9–11 September 2013; ESA: Edinburgh, UK, 2013.
Huke, R.E.; Huke, E.H. Rice Area by Type of Culture: South, Southeast, and East Asia, A Revised and Updated Data Base; International Rice Research Institute: Manila, Philippines, 1997; p. 32 .
Inoue, Y.; Kurosu, T.; Maeno, H.; Uratsuka, S.; Kozu, T.; Dabrowska-Zielinska, K.; Qi, J. Season-long daily measurements of multifrequency (Ka, Ku, X, C, and L) and full-polarization backscatter signatures over paddy rice field and their relationship with biological variables. Remote Sens. Environ. 2002, 81, 194–204.
Inoue, Y.; Sakaiya, E. Relationship between X-band backscattering coefficients from high- resolution satellite SAR and biophysical variables in paddy rice. Remote Sens. Lett. 2013, 4, 288–295.
Inoue, Y.; Sakaiya, E.; Wang, C. Capability of C-band backscattering coefficients from high-resolution satellite SAR sensors to assess biophysical variables in paddy rice. Remote Sens. Environ. 2014, 140, 257–266.
Kim, Y.H.; Hong, S.Y.; Lee, Y.H. Estimation of paddy rice growth parameters using L-, C-, X-bands polarimetric scatterometer. Korean J. Remote Sens. 2009, 25, 31–44.
Le Toan, T.; Ribbes, F.; Wang, L.F.; Floury, N.; Ding, K.H.; Kong, J.A.; Fujita, M.; Kurosu, T. Rice crop mapping and monitoring using ERS-1 data based on experiment and modeling results. IEEE Trans. Geosci. Remote Sens. 1997, 35, 41–56.
Lopez-Sanchez, J.M.; Ballester-Berman, J.D.; Hajnsek, I. First results of rice monitoring practices in Spain by means of time series of TerraSAR-X dual-pol images. IEEE J. Sel. Top. Appl. Earth Obs. Remote Sens. 2011, 4, 412–422.
Lopez-Sanchez, J.M.; Cloude, S.R.; Ballester-Berman, J.D. Rice phenology monitoring by means of SAR polarimetry at X-band. IEEE Trans. Geosci. Remote Sens. 2012, 50, 2695– 2709.
Maclean, J.L.; Hardy, B.; Hettel, G.P. Rice Almanac, 4th ed.; International Rice Research Institute: Los Baños, Philippines, 2013; p. 298.
Mittal, A. The 2008 Food Price Crisis: Rethinking Food Security Policies; United Nations: New York, NY, USA, 2009; pp. 1–40.
NASA Cloud Fraction. Available online: http:
//neo.sci.gsfc.nasa.gov/view.php?datasetId= MODAL2_M_CLD_FR (accessed on 1 June 2014).
Nguyen, T.T.H.; de Bie, C.A.J.M.; Ali, A.; Smaling, E.M.A.; Chu, T.H. Mapping the irrigated rice cropping patterns of the Mekong delta, Vietnam, through hyper-temporal SPOT NDVI image analysis. Int. J. Remote Sens. 2012, 33, 415–434.
IEEE Trans. Geosci. Remote Sens. 2009, 47, 2714–2721.
RIICE. Available online: http://www.riice.org (accessed on 1 December 2014).
Suga, Y.; Konishi, T. Rice crop monitoring using X-, C- and L-band SAR data. Proc. SPIE 2008, 7104, 710410.
Timmer, C.P. The Changing Role of Rice in Asia‘s Food Security; ADB Sustainable Development Working Paper Series, No 15; Asian Development Bank (ADB): Manila, Philippines, 2010; p. 18.