Postharvest fruit density as an indicator of dry matter and
ripened soluble solids of kiwifruit
Robert B. Jordan
a,*, Eric F. Walton
b, Karin U. Klages
b, Richard J. Seelye
aaTechnology De
6elopment Group,HortResearch,Pri6ate Bag3123,Hamilton,New Zealand bPlant De
6elopment Group,HortResearch,Pri6ate Bag3123,Hamilton,New Zealand
Received 18 January 2000; accepted 23 May 2000
Abstract
The density of unripe kiwifruit (Actinidia deliciosa(A. Chev.) C.F. Liang et A.R. Ferguson cv. Hayward) early in storage was investigated as a means of determining the current fruit dry matter (DM) and total sugar-plus-starch concentrations, and of predicting DM and soluble solid concentrations later when the fruit had ripened. To investigate the robustness of the density relationships with DM and ripe fruit soluble solids, measurements were made on fruit collected in a survey involving 208 New Zealand orchards (10% of the total) across the normal harvest season (early May – early June). Density measured on unripe fruit early in storage correlated with both DM measured at the same time (r2=82.6%; S.E.=0.68% fresh weight (FW)), and with SSC measured after ripening (r2=85.1%;
S.E.=0.57% FW). As fruit taste is related to sugar concentration, and sugars make up the bulk of the soluble solids in fruit, this suggests potential for automated bulk taste sorting of kiwifruit at harvest by floating off low DM fruit in prepared salt solutions. To investigate the reasons for the relationship between density and other fruit measure-ments, fruit composition was analysed. Fruit taken from storage 2 weeks after harvest were graded non-destructively by density into four distinct dry matter groups, each containing eight fruit (four pairs matched by density). Paired fruit were separated and analysed for DM, soluble solids, starch and sugars (sucrose, glucose and fructose), one fruit immediately and the other after ripening. Equations relating density to both DM and ripe fruit soluble solids in the composition trial had similar parameter values to those of the survey trial and gave S.E. of prediction of about 0.3% FW. DM levels were about 3.2% FW above the sum of soluble solids and starch concentrations in both ripe and unripe fruit, a difference largely independent of DM concentration. Starch lost during ripening was accounted for by the increase in the glucose and fructose sugar pools, and these two sugars had near equal concentrations at each DM level. Sucrose and minor sugar levels were independent of DM and ripeness. © 2000 Elsevier Science B.V. All rights reserved.
Keywords:Kiwifruit; Composition; Carbohydrates; Density; Ripening; Maturity
www.elsevier.com/locate/postharvbio
1. Introduction
Density has long been used as an estimator of dry matter (DM), soluble solids, maturity, quality
* Corresponding author. Tel.: +64-858-4748; fax: + 64-7-8584705.
E-mail address:[email protected] (R.B. Jordan).
and defects in fruit and vegetables, and conse-quently, has been used to grade these products (Smith and Nash, 1940; Nelson et al., 1963; Gut-terman, 1976; Zaltzman et al., 1987; Abbott et al., 1997). In kiwifruit, density measured at harvest is positively correlated with both DM, and soluble solids concentration (SSC) of ripe fruit (Asami et al., 1988; Richardson et al., 1997). Further, Crisosto (1992) suggested that DM measurements made at any time after harvest provide a reliable predictor of ripe fruit soluble solids content and hence fruit quality. Relationships have also been shown between consumer acceptability and both the DM (Scott et al., 1986), and the ripe SSC (MacRae et al., 1989; Mitchell et al., 1992) of the fruit. In fact, DM, because of its relationship with ripe fruit SSC, is now used as the target parame-ter for the near infra red (NIR) grading equip-ment currently under developequip-ment (see Jordan et al., 1997; Kupferman, 1997). Density offers an alternative to NIR for assessing kiwifruit DM non-destructively in the laboratory, and in com-mercial grading operations.
There is a simple reason why fruit density can be used to assess the DM fraction of kiwifruit. Sugars and starch are the major components of kiwifruit DM (Beever and Hopkirk, 1990). Their densities are similar (1530 and 1590 kg/m3, respec-tively; Lide, 1998), and are greater than that of water (1000 kg/m3). Thus fruit density is higher for those with more solids. However, this relation-ship is affected by fruit intercellular air spaces which may exceed 3% of fruit volume (Hallet et al., 1992) and reduce the density proportionally (Wilson and Lindsay, 1969), but not to the point where the fruit float in water. Although gases are produced when fruit ripens, total gas volumes appear reasonably constant in fruit at similar points of their development/storage life (Jordan, unpublished data) and therefore do not affect the usefulness of the density/DM relationship.
At harvest, much of the carbohydrate in kiwi-fruit is starch, which on ripening is hydrolysed to sugars (Given, 1993), requiring laboratory meth-ods to estimate potential sugar concentrations of fruit at harvest. Monitoring the changes in fruit composition during ripening is difficult to follow quantitatively because of the variation in
individ-ual fruit DMs and ripening times, and because current laboratory methods are destructive. Non-destructive estimates of DM using density allow individual fruit with vastly different DMs to be followed during development and storage.
This study investigates the relationship between density and composition of kiwifruit across ranges of DM, and before and after ripening, both at a large scale using a broad survey to establish ro-bustness, and at a laboratory scale to detail the mechanisms involved.
2. Materials and methods
2.1. Sur6ey trial
Export quality kiwifruit (Actinidia deliciosa (A. Chev.) C.F. Liang et A.R. Ferguson cv. Hay-ward) were collected from 208 orchards selected at random from nine commercial pack-houses across New Zealand during the 1996 kiwifruit harvest (May 4 – June 9). Throughout the season, fruit samples were taken automatically from the grader, removing one 36 count size (100 g) fruit from every 500 – 1000 graded until 72 fruit were collected from each orchard line. Fruit were packed into trays and immediately placed in cool storage until the end of the harvest season. In mid-June, fruits were transferred to the Ruakura Research Centre for analysis, which was com-pleted by July 10.
only yielded fruit in four of the five categories. One fruit was then taken from each category from each orchard for analysis without ripening (an 812 fruit sub-sample), and a second for analysis after ripening (789 fruit; note, some fruit were lost to rots and damage).
On the following day, both sub-samples were measured individually for density by displace-ment, applying appropriate corrections for ap-paratus volume, fruit and water temperatures, and the weight of water retained on wet fruit. The non-ripened fruit were also analysed at that time for DM by removing two 5-mm slices from the equatorial region, weighing them together, oven-drying at 65°C until constant weight, and expressing the result as a percentage of fresh weight (% FW).
Fruit to be ripened were held at 25°C for 2 – 7 days until each reached eating firmness (ap-proximately 8 N, the end point determined by feel and checked using a penetrometer with a 7.9-mm plunger on auxiliary fruit). As each fruit became ripe, it was returned to storage at 0°C, and when all were ripe, analysis for DM and SSC started within 24 h. Fruit were equilibrated to room temperature before analysis. Slices (15-mm) were removed from each end of the fruit and juice squeezed from them separately onto a digital refractometer (Atago™, Japan) calibrated in °Brix, and the means of the two ends were reported as SSC expressed as °Brix, (grams of sucrose equivalent per 100 g of juice). DM analyses, as described above, were also per-formed on these fruit.
2.2. Composition trial
Kiwifruit were harvested from two Bay of Plenty orchards in New Zealand during late May 1997, graded and packed as for export and held in cool-storage (0°C) for approximately 2 weeks. One tray of fruit of average size (36 count, 100 g each) was randomly selected from each orchard line, and the fruit individu-ally assessed for density as above. Fruit from each orchard were then ranked by density. Six-teen pairs of fruit with closely matched densities were selected, four pairs near each of the
nomi-nal densities 1031, 1037, 1044 and 1050 kg/m3. This provided a sample of matched pairs of fruit representing the typical range of densities of the New Zealand kiwifruit crop. It is notable that the eight pairs with the lowest densities came from one orchard and the remainder from the other. The pairs of fruit were then separated into two sets for composition analysis, one set immediately, and the other after ripening. This permitted direct comparison of the composition of pre- and post-ripened fruit with equal densi-ties and therefore similar DMs.
The ‘unripened’ fruit sample was stored at 0°C overnight and analysed the following day while the ‘ripened’ sample was ripened as above prior to analysis. All fruit were individually analysed for SSC and DM as described above. SSC readings were completed rapidly to elimi-nate errors from any starch particles settling on the sensor plate (checks on this were made with repeated readings on duplicate fruit). The re-mainder of each fruit was cut into 2 – 3 mm slices, weighed, frozen in liquid nitrogen and stored at −20°C. Later, these samples were lyophilised, ground and analysed for sugars and starch, expressed as % FW (Klages et al., 1998).
SSC, as determined by refractometer, is a measure of the soluble material in the juice. Consequently, it must be adjusted to a whole fruit basis to allow comparison with other fruit constituent measurements (see AOAC method 932.12; Anon, 1995). Using DM and SSC, solu-ble solids in whole fruit (SSF) can be calculated as a percentage of FW, using:
SSF (% FW)=SSC(100−DM)
(100−SSC) (1)
3. Results and discussion
3.1. Sur6ey trial
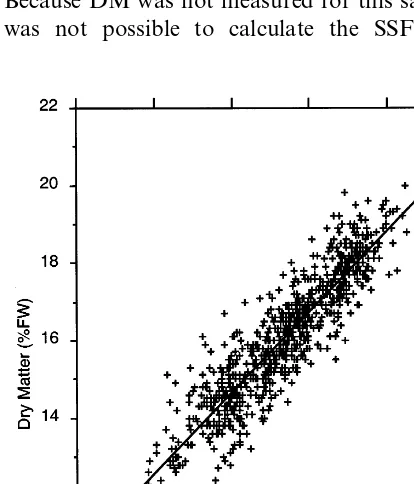
The regression of initial density against DM from the 812 unripened survey fruit (Fig. 1) is
DM (% FW)=8.4[90.13]+
(r2
=82.6%; S.E.M. DM estimate=0.68% FW). Parameter S.E. are shown here and subsequently inside square brackets. The independent variable ‘density−1000’ is used because water (density= 1000 kg/m3) is the notional zero point of the DM scale. It is worth noting that the slope term (0.210) is dependent on the density of the DM of the fruit solids, and the offset (8.4) depends on both DM density and the amount of gas present (Wilson and Lindsay, 1969). If the volume of air and gases in the fruit were more variable, we would expect ther2
of the above regression to be smaller.
The regression of initial density against ripe fruit SSC (Fig. 2) from 789 ripened survey fruit is
Ripe fruit SSC (°Brix)=5.7[90.11]+
0.189[90.003]×(Density−1000) (3)
(r2=85.1%; S.E.M. SSC estimate=0.57°Brix). Because DM was not measured for this sample, it
was not possible to calculate the SSF values. Fig. 2. Ripe fruit SSC vs. initial density and associated regres-sion line of individual kiwifruit sub-sampled from 208 New Zealand orchards. Error bar indicates one S.E. of the fit of the data to the line.
Fig. 1. DM vs. initial density and associated regression line of individual kiwifruit sub-sampled from 208 New Zealand or-chards. Error bar indicates one S.E. of the fit of the data to the line.
Considering the extensive nature of the survey, both DM and SSC relationships have high r2 values, and S.E. reported are likely to be smaller in absolute magnitude than the level that a human can differentiate.
3.2. Composition trial
The means and S.E. of composition measure-ments of the four fruit in each density category and ripeness group are shown in Table 1.
3.2.1. Density and dry matter
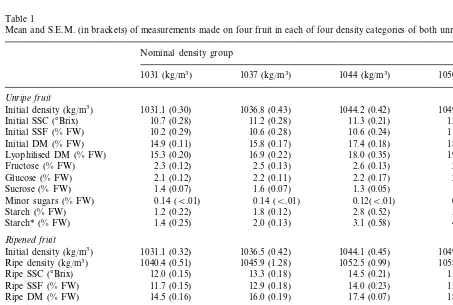
between pairs B0.1% FW). This pair matching and the DM range produced, justify the use of density as a selection criterion and created a unique data set with which to explore composi-tion changes with ripening. Results are clearly grouped within each of the four nominal density categories (Fig. 3), and a trend is evident both between and within the two orchards (orchard 1 below and orchard 2 above the 1042 kg/m3point, respectively). Similar groupings appeared in each of the other measurements made and showed no suggestion of difficulties caused by taking the fruit from different orchards. There was no significant difference between the DMs of ripe and unripe groups.
The regression line for DM against initial den-sity of all fruit shown in Fig. 3 is
DM (% FW)=8.2[90.3]+
0.209[90.008]×(Density−1000) (4)
(r2=96.2%; S.E.M.=0.3% FW). This strong cor-relation between initial density and DM measure-ments has been reported before (Richardson et al., 1997), however, their coefficients were differ-ent, tending to have lower slopes (0.192), and higher offsets (10.23) perhaps due to the fact that their measurements were made at normal harvest time.
Corresponding values for DM obtained by the oven method and for the lyophilised samples (Table 1) matched to 0.6% FW on average, with oven DMs being slightly lower. Only two individ-ual oven DMs were more than 1.2% FW lower than the lyophilised DMs.
Table 1
Mean and S.E.M. (in brackets) of measurements made on four fruit in each of four density categories of both unripe and ripe fruita
Nominal density group
1044 (kg/m3)
1037 (kg/m3)
1031 (kg/m3) 1050 (kg/m3)
Unripe fruit
1031.1 (0.30) 1036.8 (0.43)
Initial density (kg/m3) 1044.2 (0.42) 1049.8 (0.68)
10.7 (0.28) 11.2 (0.28) 11.3 (0.21)
Initial SSC (°Brix) 12.3 (0.43)
11.4 (0.43) 10.2 (0.29)
Initial SSF (% FW) 10.6 (0.28) 10.6 (0.24)
14.9 (0.11) 15.8 (0.17) 17.4 (0.18)
Initial DM (% FW) 18.6 (0.25)
Lyophilised DM (% FW) 15.3 (0.20) 16.9 (0.22) 18.0 (0.35) 19.7 (0.19) 2.6 (0.13)
1031.1 (0.32) 1036.5 (0.42)
Initial density (kg/m3) 1044.1 (0.45) 1049.9 (0.80)
1058.3 (1.13) 1045.9 (1.28)
Ripe density (kg/m3) 1040.4 (0.51) 1052.5 (0.99)
12.0 (0.15) 13.3 (0.18)
Ripe SSC (°Brix) 14.5 (0.21) 15.9 (0.17)
Ripe SSF (% FW) 11.7 (0.15) 12.9 (0.18) 14.0 (0.23) 15.4 (0.17) Ripe DM (% FW) 14.5 (0.16) 16.0 (0.19) 17.4 (0.07) 18.7 (0.16)
15.0 (0.10) 16.1 (0.25)
Lyophilised DM (% FW) 17.9 (0.06) 19.2 (0.20)
3.7 (0.07) 3.3 (0.06)
2.9 (0.07)
Fructose (% FW) 4.0 (0.06)
Glucose (% FW) 2.7 (0.11) 3.2 (0.10) 3.7 (0.03) 4.0 (0.05)
1.3 (0.04) 1.6 (0.06)
Sucrose (% FW) 1.6 (0.05) 1.9 (0.07)
0.19 (0.04) 0.24 (0.03)
Minor sugars (% FW) 0.14 (B.01) 0.16 (B.01)
0.02 (0.01) 0.04 (0.01)
Starch (% FW) 0.02 (B.01) 0.01 (B.01)
0.02 (0.01) 0.02 (B.01) 0.01 (B.01)
Starch* (% FW) 0.04 (0.01)
aFW, fresh weight; and starch* is the starch concentration adjusted by 11% to reflect the amount of sugar it will produce
Fig. 3. DM of kiwifruit before () and after ( ) ripening, plotted against initial density and showing the respective re-gression lines. Orchard 1 comprises the lower 16 data points. The S.E. of the data about the regression lines is shown as a bar at the mean density, and paired fruit are shown linked.
Ripe fruit SSF (% FW)=5.9[90.47]+
0.188[90.011]×(Density−1000) (5)
r2
=95.0%; S.E.M.=0.33% FW).
Because ripe and unripe DM levels were matched (see Fig. 3), the potential soluble solids levels of ripened and unripened fruit should not be different. Although the data contributing to Eq. (5) do not extend across the complete ripening regime from normal harvest to full ripeness, our own studies (Jordan and Seelye, unpublished data) and that of Richardson et al. (1997) provide support for this relationship holding for all ki-wifruit regardless of ripeness status. Initial density thus provides a means to non-destructively esti-mate the soluble solid levels of ripe kiwifruit. Ripe fruit SSC can also be estimated from initial den-sity using the following regression
Ripe fruit SSC (°Brix)=5.9[90.43]+
0.198[90.010]×(Density−1000) (6)
(r2
=96.2%; S.E.M.=0.30% FW). This relation-ship is similar to that reported by Asami et al. (1988) and Richardson et al. (1997) who gave slopes of 0.171 and 0.165 (cf our 0.198) and offsets of 7.89 and 7.47 (cf our 5.9), respectively. It is noteworthy that their relationships pertain to fruit analysed closer to harvest, and, as noted earlier, show lower slopes and higher offsets.
3.2.3. Starch
Starch contents of ripened fruit were low in all cases (B0.05% FW) and contributed little to total carbohydrate. Concentrations in unripe fruit ranged from 1 to 4% FW and were higher in high density fruit. Starch contents were lower than those typical of fruit at harvest (about 7% FW, e.g. Fuke and Matsuoka, 1982; Walton and de Jong, 1990; Richardson et al., 1997).
By adding the concentrations of starch to solu-ble solids for each unripe fruit, an estimate of the potential soluble solids levels in ripe fruit can be made. To allow comparison with the sugars, the starch mass has been scaled up by 11% (labelled starch*) to account for the higher resultant sugar mass following hydrolysis.
3.2.2. Soluble solids
The soluble solid concentrations of the ripe fruit were not dissimilar to the ranges of Beever and Hopkirk (1990), Paterson et al. (1991). SSC measurements of unripened fruit (mean, 11.4°Brix) were above normal harvest values (typ-ically fruit arrive at the pack house with mean SSCs between 6.5 and 10.5°Brix) and comparison with the fully ripened figures above (mean, 13.9°Brix) indicated that starch hydrolysis was already well underway. It was noted that fruit with higher density and DM tended to have higher SSC values. However, these fruit also had correspondingly more starch showing that starch conversion was proportionately less advanced.
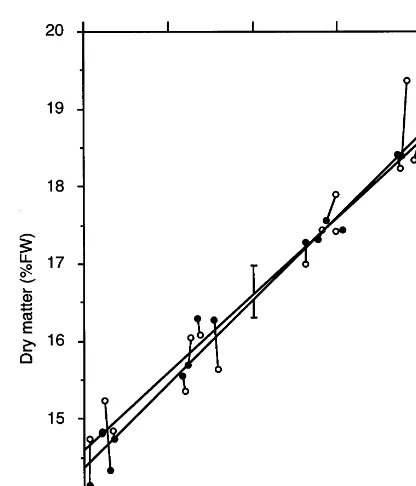
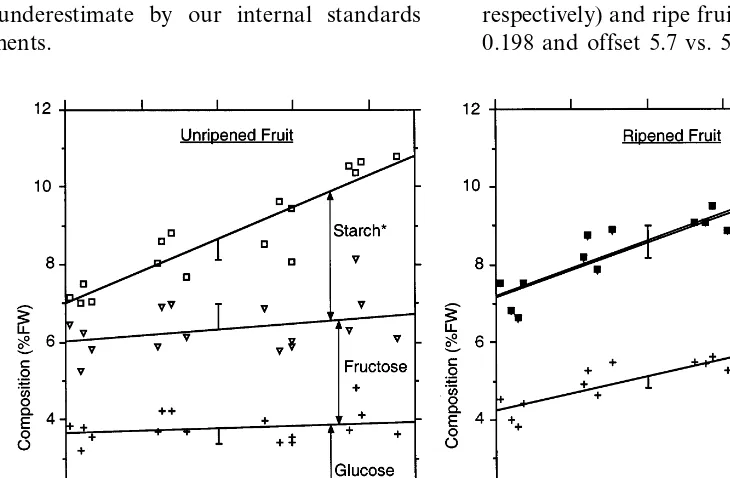
A comparison between ripe and unripe SSF-plus-starch* (Figs. 4 and 5) shows regression lines matching to better than 0.4% FW at all densities, consistent with starch being hydrolysed to sugars on ripening.
3.2.4. Sugars
Results for ripe fruit sugars (Table 1) are typi-cal of those of Beever and Hopkirk (1990), albeit at the low end of or lower than their ranges, and fit comfortably inside the ranges of Paterson et al. (1991) except for our highest sucrose value. Wal-ton and de Jong (1990) report totals of sugars plus starch that are similar, although the relative fractions of their components differ from ours consistent with the later stage of ripeness of our fruit.
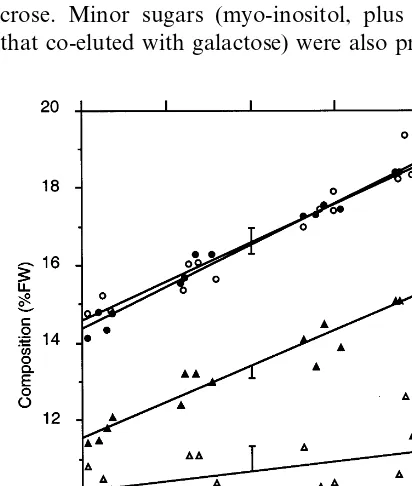
The major sugars measured had the following concentration ranking, fructose, glucose and su-crose. Minor sugars (myo-inositol, plus a sugar that co-eluted with galactose) were also present in
Fig. 5. Ripened (closed diamonds) and unripened (open dia-monds) fruit soluble solids plus starch* (starch scaled by 11%), and unripened fruit soluble solids (triangles) concentrations of kiwifruit plotted against their initial density with correspond-ing regression lines. Error bars show one S.E. of the fit to the regression lines and the steepest line is the unripe SSF+
starch*.
Fig. 4. DM (circles) and soluble solids (triangles) concentra-tions (expressed as % FW) for ripened (closed symbols) and unripened (open symbols) kiwifruit and corresponding regres-sion lines. Error bars show one S.E. of the fit to the regresregres-sion lines, and the steeper DM line corresponds to the ripe fruit.
low concentrations (0.17 and B0.08% FW, re-spectively) and were grouped together in this study. By plotting sugars cumulatively, an illustra-tion of fruit composiillustra-tion and the way it changes with increased density is provided (Fig. 6).
3.2.5. Other soluble components
The refractometer-based SSF (SSC as % FW) measurement, and the chemically determined sug-ars (see Fig. 7) show an SSF that is greater than the sum of sugars by 4% FW, increasing to 5.5% FW in the ripened high density fruit. SSF would include the three fruit acids citric, quinic and malic which were not measured in these experi-ments and which are typically 1.0 – 1.6% FW in total (Beever and Hopkirk, 1990; Walton and de Jong, 1990), although as high as 2.9% FW (Pater-son et al., 1991). This leaves 2.4 – 3.9% FW (cf. Beever and Hopkirk, 1990), or 1.1 – 2.6% FW (cf. Paterson et al., 1991), of the SSF readings uniden-tified. This discrepancy, which is also apparent in the data of Fuke and Matsuoka (1982), may be due to the presence of another soluble component that we have not measured (e.g. potassium, nitrate or soluble pectins; see Beever and Hopkirk, 1990). Alternatively, less than the total carbohydrate was recovered from the fruit samples, resulting in a slight underestimate by our internal standards adjustments.
3.2.6. Other insoluble components
For ripened fruit, mean measurements of SSF-plus-starch* over the density/ripeness groups were consistently lower than DM by 2.8 – 3.4% FW (see Table 1), while in the unripened fruit, this differ-ence was 3.1 – 3.7% FW. These differdiffer-ences are also apparent by inspecting Figs. 4 and 5 and repre-sent ‘the insoluble non-starch fraction’ of the DM. This insoluble fraction increases only slightly with higher DM fruit, and would contain cell wall, seeds, skin, and minor insoluble compo-nents, and should not be affected by the sugar and starch levels of the fruit.
3.3. Comparison of sur6ey and composition trial results
The regression lines obtained in the survey and composition trials when compared have very close parameters for initial density against both DM (cf. slope 0.210 vs. 0.209 and offset 8.4 vs. 8.2, respectively) and ripe fruit SSC (cf. slope 0.189 vs. 0.198 and offset 5.7 vs. 5.9, respectively).
Fig. 7. Soluble solids in whole kiwifruit (SSF), and total sugar estimates for unripened and ripened data groups plotted against initial fruit density and showing regression lines. Error bars show one S.E. of the regression fit to the cumulative carbohydrate measurements.
ering the extensive nature of the sample taken in this survey, this confirms the robustness of the relationship in kiwifruit between initial density and the fruit DM and ripe fruit SSC.
It is worth noting that the sets of fruit in the survey and composition trials were stored for similar lengths of time prior to analysis and would have been at similar stages of ripeness. Had these trials been undertaken immediately after harvest, the regression parameters would have been different from those reported above, but would still have matched each other closely. This predicted change in regression parameters as fruit ripened might be due to a reduction of internal air spaces during early storage, but war-rants further investigation.
4. Conclusions
Using density, we have investigated composi-tion changes in kiwifruit over the full range of
DM levels experienced and have identified how these changes are affected by the DM levels. Fruit selected to have closely matching densities during early storage were shown to have closely matching DM, as well as total carbohydrate lev-els, both in early storage, and after ripening. Fruit with higher or lower density had corre-spondingly higher or lower DMs and SSCs when ripe, respectively. These experiments show that the increase during ripening of both soluble solids and of the sum of glucose and fructose concentrations in fruit of varying DM concen-trations can be wholly accounted for by the loss of starch. Levels of residual insoluble compo-nents in the fruit (excluding starch) representing fruit structures are largely independent of the fruit DM. Even though the fruit studied came from two different orchards, there was no evi-dence that orchard differences affected the re-sults.
and by refractometer which could not be ac-counted for from typical soluble acid concentra-tions reported in the literature, or by other identified sources of error.
Confirmation is provided that DM can be predicted from initial density measurements in laboratory experiments with S.E. as low as 0.3% FW and in a nation-wide survey to better than 0.7% FW. From the initial density measure-ments, and also from the DM, good estimates of final or ripe fruit soluble solids levels can be obtained. This suggests the utility of using fruit initial density to non-destructively sort kiwifruit on the basis of its DM and therefore its ulti-mate (ripe) SSC and thus its sugars. Such a re-sult is evident in small-scale laboratory trials, and in large-scale industry wide surveys. This technology thus offers the potential to commer-cially sort kiwifruit into different eating qualities by allowing the fruit to float or sink in appro-priate solutions adjusted to key densities.
Acknowledgements
We thank Helen Boldingh and Ian Waring for the carbohydrate analyses. This work was funded by the New Zealand Foundation for Re-search, Science and Technology (C06624). Fruit used in the survey trial were collected and analysed under funding from the New Zealand Kiwifruit Marketing Board (NZKMB 96155).
References
Abbott, J.A., Lu, R., Upchurch, B.L., Stroshine, R., 1997. Technologies for nondestructive quality evaluation of fruits and vegetables. Hort. Rev. 20, 2 – 120.
Anon, A., 1995. AOAC Method 932.12 solids (soluble) in fruit and fruit products. AOAC Official Methods Analysis 37 (1), 15.
Asami, I., Tanaka, Y., Aoki, M., 1988. Studies on the quality evaluation of kiwifruit (1) chemical composition and non-destructive quality evaluation method of kiwifruit. Res. Bull. Aichi Agric. Ctr. 20, 309 – 316.
Beever, D.J., Hopkirk, G., 1990. Fruit development and fruit physiology. In: Warrington, I.J., Weston, G.C. (Eds.),
Kiwifruit Science and Management. For the New Zealand Society of Horticultural Science. Ray Richards Publisher, pp. 97 – 126.
Crisosto, C.H., 1992. Predicting high quality in kiwifruit. California Grower, September 1992.
Fuke, Y., Matsuoka, H., 1982. Changes in contents of sugars, starch, organic acids and free amino acids in kiwifruit during growth and after ripening. Nippon Shokuhin Ko-gyo Gakkaishi 29, 642 – 648.
Given, N.K., 1993. Kiwifruit. In: Seymour, G., Taylor, J., Tucker, G. (Eds.), Biochemistry of Fruit Ripening. Chap-man & Hall, London.
Gutterman, R.P., 1976. Mass flow density sorter for fruits and vegetables. In: J.J Gaffney (Compiler), Quality Detection in Foods. ASAE publication 1-76 in co-operation with the ASAE technical committee FE-74 on Food Handling. Hallet, I.C., MacRae, E.A., Wegrzyn, T.F., 1992. Changes in
kiwifruit cell wall ultra-structure and cell packing during postharvest ripening. Int. J. Plant Sci. 153, 49 – 60. Jordan, R.B., Osborne, S.D., Ku¨nnemeyer, R., Seelye, R.J.,
1997. Harvest time prediction of eating time properties of kiwifruit using NIR transmission. Proceedings of Sensors for Non-destructive Testing. International Conference, Or-lando, FL, February 1997, p. 101.
Klages, K., Donnison, H., Boldingh, H., MacRae, E., 1998. myo-Inositol is the major sugar inActinidia aguta during early fruit development. Aust. J. Plant Physiol. 25, 61 – 67. Kupferman, E., 1997. Near infrared sorting for the Washing-ton Apple Industry. WashingWashing-ton State Univ. Tree Fruit Postharvest J. 8, 4 – 9.
Lide, D.R. (Ed.), 1998. CRC Handbook of chemistry and physics, 79th ed, p. 1529.
MacRae, E.A., Bowen, J.H., Stec, M.G.H., 1989. Maturation of kiwifruit (Actinidia deliciosa cv Hayward) from two orchards: difference in composition of the tissue zones. J. Sci. Food Agric. 47, 401 – 416.
MacRae, E.A., Quick, W.P., Benker, C., Stitt, M., 1992. Carbohydrate metabolism during postharvest ripening in kiwifruit. Planta 188, 314 – 323.
Mitchell, F.G., Mayer, G., Biasi, W., 1992. Effect of harvest maturity on storage performance of ‘Hayward’ kiwifruit. Acta Hort. 297, 617 – 625.
Nelson, K.E., Baker, G.A., Winkler, A.J., Amerine, M.A., Richardson, H.B., Jones, F.R., 1963. Chemical and sen-sory variability in table grapes. Hilgardia 34, 1 – 42. Paterson, V.J., MacRae, E.A., Young, H., 1991. Relationship
between sensory properties and chemical composition of kiwifruit. J. Sci. Food Agric. 57, 235 – 251.
Richardson, A.C., MacAneney, K.J., Dawson, T.E., 1997. Carbohydrate dynamics in kiwifruit. J. Hort. Sci. 72, 907 – 917.
Sawanabori, S., Shimura, I., 1990. Effects of growing location and season on fruit growth and development of ‘Hayward’ Kiwifruit. J. Jpn. Soc. Hort. Sci. 58 (4), 849 – 857. Scott, K.J., Spraggon, S.A., McBride, R.L., 1986. Two new
maturity tests for kiwifruit. CSIRO Food Res. Q. 46, 25 – 31.
Smith, O., Nash, L.B., 1940. Potato quality II. Relation of soil reaction irrigation and mineral nutrition to cooking qual-ity. Proc. Am. Soc. Hort. Sci. 38, 507 – 512.
Walton, E.F., de Jong, T.M., 1990. Growth and compositional changes in kiwifruit berries from three Californian loca-tions. Ann. Botany 66, 285 – 298.
Wilson, J.H., Lindsay, A.M., 1969. The relation between specific gravity and dry matter content of potato tubers. Am. Potato J. 46, 323 – 328.
Zaltzman, A., Verma, B.P., Schmilovitch, Z., 1987. Potential of quality sorting of fruits and vegetables using fluidized bed medium. Trans. ASAE 30, 823 – 831.