IN
Acacia aulacocarpa
A. Cunn.
ex
Benth
Anthonius YPBC Widyatmoko and Susumu ShiraishiThe geographic variation of chloroplast DNA (cpDNA) haplotypes of was investigated among 18 natural populations. These populations represent the geographical range of the species in New Guinea Island and Queensland. Single strand conformation polymorphism (SSCP) was used for the analysis. Two non-coding regions of cpDNA, the intron region of the L gene and the intergenic spacer region between the P and W genes, were analyzed, and four haplotypes (A, B, C, and D) were recognized. The haplotype distribution corresponded with the geographic distribution of the populations. Based on four cpDNA haplotypes, the eighteen populations were divided into three groups: New Guinea Island, Northern Queensland and Southern Queensland. Haplotype C was observed only in the New Guinean populations, while the other three haplotypes (A, B, and D) were found in Queensland only. All of these three haplotypes were observed in Southern Queensland, whereas haplotype B was found only in the Northern Queensland populations. The cpDNA haplotype diversity of this species seemed to be highest in southern Queensland.
Keywords: , geographic variation, Chloroplast DNA, non-coding region, haplotype, PCR-SSCP
1 2
Received : 29 January 2013, Accepted : 26 June 2013
ABSTRACT
Acacia aulacocarpa
trn trn trn
Acacia aulacocarpa
I. INTRODUCTION
The genus is a common forest tree species originated from Papua and Papua New Guinea (New Guinea Island), Australia and neighboring islands. Among species,
Willd and Cunn. ex.
Benth are considered as the most important species for plantation, and some genetic improvement programs have been carried out in Southeast Asia (Thompson, 1994). In addition,
A. Cunn. ex Benth and
Cunn. ex Benth are widely distributed in tropical areas. These species are utilized in forest plantation for pulp and paper. Genetic diversities
in , , and
have been discussed by Moran . (1988 and 1989), Khasa ., (1994), Wickneswari and
Acacia
Acacia A.
mangium . A. auriculiformis .
A. aulacocarpa A. crassicarpa
A. mangium A. auriculiformis A. crassicarpa et al
et al
Norwati (1993), Butcher ., (1998), Widyatmoko , (2010) and Widyatmoko and Shiraishi (2011). Several studies have been carried out in species trial, provenance trial, nursery practice and fertilization to determine superior growth performance, adaptability, pest and disease resistance of the genus (Thompson, 1994). Phylogenetic study on has been reported by Brown . (2008), Byrne . (2001 and 2002) and Clarke . (2000).
belongs to the section of , subgenus (Brain and Maslin, 1996; Pettigrew and Watson, 1975). This species is naturally distributed in diverse habitats over a wide geographic range, including four states in northern and eastern Australia (Queensland/ QLD, New South Wales/NSW, Northern Territory/NT, and Western Australia/WA), Papua New Guinea (Western Province/WP), and Indonesia (Papua/PI). Based on morphological differences, this species has been divided into 5 subspecies: subsp. A (NT, WA),
subsp. B (WP, PI), subsp. et al
et al.
Acacia
et al et al
et al A. aulacocarpa
Juliflorae Phyllodineae
A. aulacocarpa A.
aulacocarpa A. aulacocarpa
1
2
Center for Forest Biotechnology and Tree Improvement, Yogyakarta
Laboratory of Silviculture, Faculty of Agriculture, Kyushu University, Fukuoka, Japan
C (northern QLD), subsp. D
(northern QLD), and subsp. E
(southern QLD, NSW) (Thomson, 1994). McDonald and Maslin (2000) revised taxonomic of Cunn. ex Benth. and its seven close relatives, mainly based on their mode of pod dehiscence. These species divided into two
subgroups: subgroup and
subgroup. subgroup
consists of , and
subgroup comprise
of , , ,
and .
Field trials regarding to the species have been carried out in several countries.
subspecies C (Thomson, 1994), is kown as highly productive and high survival rate at most of the trial sites. This species demonstrates high pulp productivity (330 kg/m ) especially for kraft pulping. In comparison with other Acacia`s species (
and ), yields more for
pulping (Balodis and Clark, 1998).
Single-strand conformation polymorphism (SSCP) is a simple, fast and very sensitive method for the identification of nucleotide-sequence polymorphisms. This technique is performed without sequencing and able to detect small changes in DNA such as single base substitutions, deletions, and insertions (Orita ., 1989). Hayashi (1991) combined this method with PCR, and developed a simple method of analysis referred to as PCR-SSCP. This method has greatly increased the efficiency of the marker and appears to be a useful tool for studying genetic variation. It has been utilized in studies on the detection of inheritance and molecular variation (Bodenes
., 1996), chloroplast DNA variation, typing and identification (Maeda and Shiraishi, 1997; Watano ., 1995), and genetic mapping (Judelson ., 1995). Hongyo . (1993) reported the improvement of SSCP method becomes simple method called 'Cold-SSCP'. Recently, the SSCP method has been further modified and utilized for DNA genome analysis (Grace ., 1995).
The chloroplast genome is conservative in its evolution. Chloroplast DNA (cpDNA) possesses
A. aulacocarpa A. aulacocarpa
Acacia aulacocarpa
A. aulacocarpa A.
crassicarpa Acacia aulacocarpa
A. aulacocarpa A. celsa A. disparrima, while A. crassicarpa
A. crassicarpa A. lamprocarpa A. midgleyi A. peregrina A. wetarensis
A. aulacocarpa
A. auriculiformis, A. cincinnata, A. crassicarpa A. mangium A. aulacocarpa
et al
many peculiar characteristics, such as uniparental inheritance, the lack of recombination and repeated sequences, and low variability compared with nuclear DNA (Birky, 1988; Wolfe ., 1987). These characteristics lead to the expectation that diversity within a population is very low and differentiation between populations might be easily detected. This would be especially observable in species with geographically isolated populations and/or small populations.
Studies of the genetic diversity of the aulacocarpa have been reported by Widyatmoko and Shiraishi (2010). In this study, however, only six samples have been used and compared to the others three species of which
had the highest genetic diversity. Information of genetic diversity for all natural distribution of
is needed. Therefore, reserach was carried out with main objective to elucidate genetic diversity and genetic distribution of the species.
A total of 87 individuals (seeds) originating from 18 populations were used in this study (Figure 1 and Table 1). The seed samples were obtained on 1994 from the Australian Tree Seed Centre of the CSIRO (Commonwealth Scientific and Industrial Research Organization), Australia and from the Forest Tree Improvement Research and Development Institute, Indonesia. The populations were distributed in Indonesia, Papua New Guinea, and QLD (corresponding populations: 1, 8 and 9, respectively). Population latitudes ranged from 7.45°S (Papua, Indonesia) to 27.17°S (Samford, QLD); altitudes ranged from 6 m a.s.l (N. Yeppoon, QLD) up to 720 m a.s.l (Buckley, QLD). For each population, 2-6 trees are represented; only one seed from each individual tree (n=87) was used. Similar number of samples per population for analysing chloroplast DNA variation also reported by Zulfahmi . (2010) and Bordacs . (2002).
et al
Acacia
Acacia A. aulacocrapa
A. aulacocarpa
et al et al
II. MATERIAL AND METHOD
B. DNA Extraction
Total genomic DNA was extracted using a modified SDS method (Guan ., 2011). Each seed was grounded using 400 µl SDS extraction buffer, which contained of 50 mM Tris-HCl (pH 9.0), 1% (w/v) SDS, 10 mM EDTA, and 0.5% (v/v) 2-Mercaptoethanol. After incubation at 65 C for 60 min, 200 µl of 7.5 M ammonium acetate was added. The solution was kept on ice for 30 min, and was then centrifuged at 0 C at 15,000 rpm for 40 min. The sample in aqueous phase (400 µl), was transferred to a new tube, and the DNA was precipitated by the addition of 400 µl isopropanol. After circa 10 min, the precipitate was collected by centrifugation at 15,000 rpm for 10 min. The supernatant was completely removed, and the pellet was washed twice with 1.0 ml of 70% Ethanol. After washing, the pellet was then vacuumed in an evaporator for 2 min, then it was resuspended in 100 µl purified H O. Finally, the crude solution was purified using a GeneClean III Kit (BIO 101).
et al
o
o
2
C. PCR Amplification
The 10 µl PCR reaction mixture contained 2 ng genomic DNA, 0.25 µM of each primer, 10 mM Tris-HCl (pH 8.3), 10 mM KCl, 3.0 mM MgCl , 0.2 mM each of dNTPs, and 0.5 unit of AmpliTaq DNA polymerase, Stoffel Fragment (Perkin-Elmer). PCR was performed using a GeneAmp PCR System, Model 9600 (Perkin-Elmer). The conditions of amplification were as follows: 95°C for 60 s, and 30 cycles of 30 s at 94°C, 30 s at 55°C, and 90 s at 72°C, followed by 60 s at 72°C.
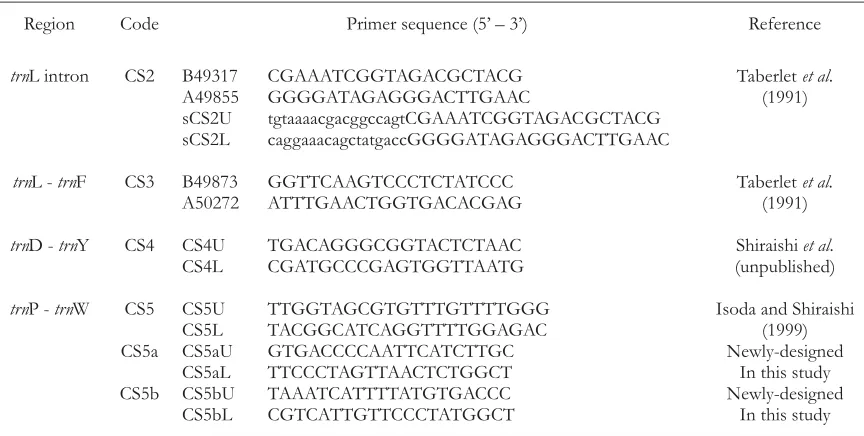
In this study, six pairs of primers (Table 2) were used to amplify six cpDNA regions. The four regions were as follows: one intron region of the L gene (CS2; B49317/A49855) and three intergenic spacer regions, namely, those between the L and F genes (CS3; B49873/A50272),
between the D and Y genes (CS4;
S4U/CS4L), and between the P and W genes (CS5; CS5U/CS5L). Two regions (CS5a and CS5b) originated from the CS5 region were also amplified with two primer pairs (CS5aCS5aU/ CS5aL and CS5bU/CS5bL), respectively.
2
trn
trn trn
trn trn
trn trn Figure 1. Natural Distribution of A. aulacocarpaand location of population invested
Table 1. Details of seedlot number and location of sample populations of Acacia aulacocarpa
No. Population No. of Seedlot No. Latitude Longitude Altitude
seeds (ºS) (ºE) (m a.s.l.)
New Guinea
1. Kuel, Irian Jaya
6 1001, 1002, 1003, 1004,
1005, 1006
7.45 140.45 45
2. Makapa WP 5 16974-M (3, 7, 12, 16, 19) 7.56 142.35 35
3. Isago Arimia River WP
5 16948-AI (3, 4, 5, 6, 7) 8.10 142.41 10
4. Duaba WP 5 16949-AD (2, 4, 6, 8, 10) 8.13 142.58 25
5. Wasua Pedeya
WP
5 16950-AW (1, 11, 21, 31, 37) 8.17 142.52 52
6. Kapal NW of
Wipim WP
5 16981-BVG (1651, 1653,
1654, 1655, 1659)
8.37 142.47 40
7. Derideri E Morehead WP
5 16989-MM (969, 970, 971,
974, 975)
8.40 141.50 30
8. Wipim WP 5 16976-KER (2, 6, 10, 13, 16) 8.47 142.52 45
9. Balimo
District
5 16946-AKO (1, 12, 22, 32,
42)
8.50 142.58 12
Northern Queensland
10. Old Rock
Hart Airstrip
5 18358-GJM (1377, 1383,
1384, 1385, 1386)
12.50 143.18 15
11. Mcil Wraith Range
4 18001-T (1142, 1143, 1145,
1146)
13.44 143.20 500
12. Piccaninny Creek
2 16136-JMO (1459, 1463) 13.90 142.48 40
13. 10 K NW Mt.
Molloy
5 17905-TREE (1, 2, 3, 4, 5) 16.40 142.15 420
14. Garioch 5 13866-BVG (2939, 3940,
2941, 2942, 2943)
16.40 145.18 400
15. Buckley
Logging Area
5 13865-BVG (2921, 2935,
2936, 2937, 2938)
17.90 145.37 720
Southern Queensland
16. 3K S Mt.
Larcom
5 17739-GB (22, 25, 27, 28,
73)
23.50 151.00 70
17. N of Yeppon 5 14591-PWO (174, 175, 178,
184, 185)
23.60 150.45 6
18. Samford 5 17891-GB (96, 97, 98, 99,
100)
Table 2. Primer sequences of cpDNA non coding regions used in this study
Region Code Primer sequence (5’ – 3’) Reference
trnL intron CS2 B49317 CGAAATCGGTAGACGCTACG Taberletet al.
A49855 GGGGATAGAGGGACTTGAAC (1991)
sCS2U tgtaaaacgacggccagtCGAAATCGGTAGACGCTACG
sCS2L caggaaacagctatgaccGGGGATAGAGGGACTTGAAC
trnL -trnF CS3 B49873 GGTTCAAGTCCCTCTATCCC Taberletet al.
A50272 ATTTGAACTGGTGACACGAG (1991)
trnD -trnY CS4 CS4U TGACAGGGCGGTACTCTAAC Shiraishiet al.
CS4L CGATGCCCGAGTGGTTAATG (unpublished)
trnP -trnW CS5 CS5U TTGGTAGCGTGTTTGTTTTGGG Isoda and Shiraishi
CS5L TACGGCATCAGGTTTTGGAGAC (1999)
CS5a CS5aU GTGACCCCAATTCATCTTGC Newly-designed
CS5aL TTCCCTAGTTAACTCTGGCT In this study
CS5b CS5bU TAAATCATTTTATGTGACCC Newly-designed
CS5bL CGTCATTGTTCCCTATGGCT In this study
Lower case indicates -21M13 primer or M13 Rev primer (Perkin-Elmer)
D. SSCP Analysis
E. Cloning of DNA Fragments
PCR products (2.5 µl) were mixed with 12 µl of loading buffer containing 77% formamide, 0.25% BPB, and 1x TBE. The solution was concentrated for 15 minutes using a vacuum evaporator, denatured for 5 min at 94°C, then immediately cooled on ice, and loaded onto 7% polyacrylamide (39:1 acrylamide to bis acrylamide) TBE gel. Depending on the length of PCR product, the electrophoresis was run for 2 or 4 hours at 1.5 V/cm and at a constant temperature of 10°C in 1x TBE running buffer. The gel was stained with a 0.5 µg/ml solution of ethidium bromide in 1x TBE buffer for 15 min. The SSCP bands were visualized using a 302 nm UV transilluminator.
The PCR and SSCP assays revealed two duplicated DNA fragments in the CS5 region (Fig. 3). To determine the sequence of each fragment, a cloning technique was adopted. Each fragment was cut from the gel and used as a template for the next PCR. PCR amplification was performed again for each fragment using the same primers as those used for CS5 (CS5U and CS5L). The two PCR products were ligated with pGEM vector (Primega), and were transformed into E. coli (JM109 High Efficiency Competent Cell) according to the method recommended by the
suppliers. The inserted DNA regions were directly amplified from colonies using colony P C R w i t h t h e f o l l ow i n g p r i m e r s : 5 ' TCCGGCTCGTATGT-TGTGTGGA-3' and 5'-GTGCTGC-AAGGCGATTAAGTTGG-3' (Hattori, 1997). DNA amplification was carried o u t u s i n g t h e a b ove - m e n t i o n e d P C R composition, except with an extremely small E. coli colony as a template DNA. PCR was performed using a GeneAmp PCR System, Model 9600 (Perkin-Elmer) with the thermal profile of 95°C for 60 s; 29 cycles of 15 s at 96°C, and 120 s at 70°C; followed by one cycle of 15 s at 96°C and 10 min at 70°C. The PCR products were purified with a GeneClean III Kit (BIO 101) and used as templates for sequencing.
In addition to the colony-PCR products mentioned above, the CS2 region was amplified as templates for sequencing using a primer pair (sCS2U/sCS2L) shown in Table 1. A 20 µl reaction mixture contained 4 ng of genomic DNA, 0.25 µM of each primers, 20 mM Tris-HCl (pH 8.0), 100mM KCl, 2.0 mM MgCl , 1 mM DTT, 0.25 mM of each dNTP, and 1.0 unit of
TM (TAKARA). PCR was performed with a Gene Amp PCR System, Model 9600 (Perkin-Elmer). The conditions of amplification were 95°C for 60 s, and 30 cycles of
G. Sequencing
2
30 s at 94°C, 30 s at 45°C, and 90 s at 72°C, followed by 60 s at 72°C. In order to separate the amplified DNA from residual primers, all reactions were pooled and subjected to electrophoresis in a 1.5% (w/v) low-melting-point agarose gel using TBE buffer. The desired DNA fragment was cut out of the gel and recovery was obtained using QIAEX II (QIAGEN). Sequencing was performed with a Thermo Sequanase pre-mixed cycle sequence kit (Amersham) and two sequence primers (PerkinE l m e r 2 1 M 1 3 : 5 ' T G T A A A A C G A C G G C C A G T 3 ' a n d M 1 3 R e v : 5 ' -C AG G A A A-C AG -C TAT G A-C -C - 3 ' ) u s i n g HITACHI SQ5500 Sequencer.
Of the four DNA regions where the cpDNA
variation was surveyed in two
regions (CS2 and CS5) showed polymorphisms, and the other two regions (CS3 and CS4) were monomorphic. In the SSCP profile of the CS2
III. RESULT
A. PCR-SSCP Profile
A. aulacocarpa,
region, two bands appeared that corresponded to the two single-strand DNAs (ssDNA) of the PCR product. Figure 2 depicts three SSCP types showing different migration patterns. These three types were referred to as , and . In the NGI populations, all of the samples were of the type (lanes b, d, f, h, i, and k in Figure 2). In contrast, 3 different types were observed in the QLD populations. The type was recognized in the populations of N. Yeppoon and 3K S Mt. Larcom (lanes e and g), while was found only in the one sample from Samford (lane j). The remaining samples from QLD (lanes a and c) were of the same type ( ) as those from NGI. Within-population polymorphism was detected in only two populations, namely, those from Samford and N. Yeppoon.
In the CS5 regions, three SSCP types were observed and all samples possessed four fragments (Fig. 3B). As each fragment and a single-strand DNA were in a one-to-one correspondence, the discovery of these four fragments indicates that two DNA regions were amplified by the PCR with primers CS5U and CS5L.
cs2 cs2 cs2
cs2
cs2
cs2
cs2
1 2 3
2
1
3
2
c22 c22 c22 c22 c21 c22 c21 c22 c22 c23 c22
a b c d e f g h i j k
Figure 2. Cold SSCP profiles of chloroplasttrnL intron (CS2) inAcacia aulacocarpa
Remarks: Fragment length of CS2 is 578 bp (same as in Fig. 6)
a-k, individual tree number: a, 13965-BVG 02921; b, 16946-AKO 00001; c, 13966-BH 02939; d, 16947-M 0000003; e, 14591-PWO 00174; f, 16948-AI 000003; g, 17739-GB 000022; h, 16949-AD 000002; i, 1001; j, 17891-GB 000096; k, 16950-AW 000001.
, "fast" allele; , "medium" allele; , "slow" allele
cs21 cs22 cs23
B. Polymorphism in CS5 Region
trn trn
In the SSCP profile of the Cs5 regions (Fig. 3B), all of the samples possessed four bands. These findings clearly suggest a duplication of the region between the P and W genes. Three types of band patterns were observed in this
C B A
(A)
a
b
c
d
e
f
(B)
a
b
c
d
e
f
300 bp 600 bp
Figure 3 PCR product (A) and Cold SSCP (B) profiles of chloroplasttrn trnP- W spacer (CS5) inA. aulacocarpa
Remarks : A, B, and C, three different PCR products.
a-f, individual tree number: a, 1001; b, 16946-AKO 00001; c, 16947-M 0000003; d, 17891-GB 000096; e, 17905-TREE 1; f, 18358-GJM 1377; M, 100 bps ladder
The agarose gel electrophoretic profile of the PCR products (Figure 3A) revealed that each sample possessed 2 bands in which the fastest band (A) was thicker than the slower bands (B and C). The sequence of the duplicated regions was clarified by cloning three DNA fragments (A, B, and C). Figure 4 depicts the sequences of fragments A, B, and C. These three sequences were highly homologous, especially fragments A and B, which were completely identical except for an insertion/deletion (indel) of 40 bps. The sequence of fragment C was different from the former two sequences as regards five of the indels and four substitutions. From the sequence homology, these three sequences (A, B, and C) could be grouped into CS5a and CS5b. The fragments A and B reflected the CS5a region, and the fragment C corresponded to CS5b. Based on
the sequence information, two primer pairs were newly designed to amplify the two regions (CS5a and CS5b) specifically, and SSCP variation was investigated in each region (Figure 5A and 5B).
In the CS5a region, two SSCP types with different migrations were detected (Figure 5A). The two types were referred to as cs5a and cs5a , respectively. The cs5a was found in only one sample from the Samford population (lane a). On the other hand, in the CS5b region, two SSCP types with different migrations were observed (Figure 5b). The two types were referred to as cs5b and cs5b . The odd lanes in Figure 5B were the samples from Queensland populations, whereas the even lanes were from NGI. This revealed that these two groups, NGI and Queensland, possessed quite different SSCP types of CS5b region.
1 2
2
Figure 4. A partial Sequences of chloroplast P- W (Cs5) spacer of the three different PCR products (A, B, and C) as shown in Figure 3
trn trn
cs5b 1 cs5b 2 cs5b 1 cs5b 2 cs5b 1 cs5b 2 cs5 1 cs5b 2 cs5 1 cs5b 2 cs5b 1
a b c d e f g h i j k
(B)
cs5a 2 cs5a 1 cs5a 1 cs5a 1 cs5a 1 cs5a 1 cs5a 1 cs5a 1 cs5 a
1 cs5a 1 cs5a 1
a b c d e f g h i j k
(A)
Figure 5 (A). Cold SSCP profiles of CS5a regions in
a-k, individual tree number : a, 17891-GB 000096; b, 17739-GB 000073; c, 1006, d, 16950-AW 000037; e, 17891-GB 000100; f, 16971-KER 00016; g, 17905-TREE 5; h, 16981-BVG 01659; i, 18358-GJM 1386; j, 16989-MM 000975; k, 16136-JMO 01463. , "fast" allele;
, "slow" allele
(B). Cold SSCP profiles of Cs5b regions in
a-k, individual tree number : a, 17905-TREE 1; b, 16976-KER 00002; c, 18358-GJM 1377; d, 16981-BVG 01651; e, 1800-T 1142; f, 16989-MM 000969; g, 16136-JMO 01459; h, 16946-AKO 00012; i, 13865-BVG 02935; j, 16947-M 0000007; k, 13866-BVG 02940.
, "fast" allele; , "slow" allele
Acacia aulacocarpa
cs5a cs5a
Acacia aulacocarpa
cs5b cs5b
1
2
1 2
C. Sequences of Polymorphic Regions
The sequences of SSCP types in each polymorphic region are shown in Figure 6. It was confirmed that all of the SSCP polymorphisms in the three regions reflected differences in sequence. In the cpDNA L intron region (CS2) in which three SSCP types were detected, all sequence types had the same length (578 bps); furthermore, no indel was detected. Single-base substitution, however, was recognized among the three types. , observed in 3K S Mt. Larcom and N. Yeppoon populations reflected a single-base transition (G to A) in the 177th single-base. However, the detected in one sample in the Samford population reflected a single transition (C to T) in the 228 position.
According to the cpDNA intergenic spacer between P and W (CS5), two regions were analyzed using the different primer pairs. In CS5a, the two types were distinguished by a 5-base
trn
Cs2
cs2
trn trn 1
3
th
duplication and a single-base transversion (A to C). In CS5b, which clearly separated NGI from QLD, the sequence length differd between the two types. In this region, a tandem repeat with a 20-bp core sequence was recognized.
appeared only in the NGI populations that had a twice-repeat sequence, whereas was detected only in QLD populations that had a four-fold-repeat. Moreover, a single-base substitution was detected between and .
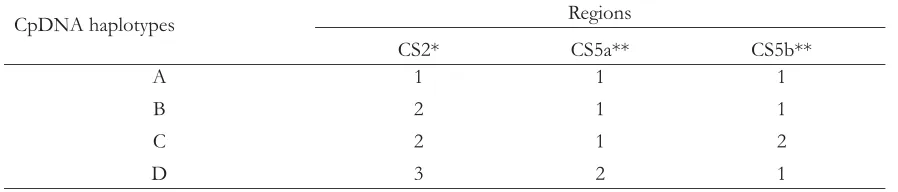
Four different cpDNA haplotypes have been determined based on the combination of SSCP types in the three regions (Table 3). Haplotype A was a combination of in CS2 region and and in CS5. Haplotype B was a combination of the , and . Haplotype C consisted of , , and , and haplotype D was a combination of , , and .
Cs5b
cs5b
cs5b cs5b
cs2 cs5a
cs5b
cs2 , cs5a cs5b cs2 cs5a cs5b
cs2 cs5a cs5b
2
1
1 2
1 1
1
2 1 1
2 1 2
3 2 1
Figure 6. Sequences of chloroplasttrnL intron (CS2) inA. aulacocarpa
Remarks :
cs2 cs2 cs2
Only positions different from the upper sequence are shown. Each line corresponds to the different allele. The upper line, 2allele; the middle line, 1allele; the lower line, 3allele
Table 3. Allele combination of each chloroplast DNA haplotype
CpDNA haplotypes Regions
CS2* CS5a** CS5b**
A 1 1 1
B 2 1 1
C 2 1 2
D 3 2 1
* Chloroplast L intron
** Chloroplast intergenic spacer between P and W
trn
IV. DISCUSSION
A. SSCP and Sequence Polymorphism
B. Geographical Variation in Chloroplast DNA
Recently, PCR-SSCP analysis has proved to be a very sensitive, rapid, and easy method for detecting point mutations and other DNA polymorphisms (Rehben ., 1997; Watano ., 1995; Bodenes ., 1996; Watanabe ., 1997; Maeda and Shiraishi, 1997). So far, extensive use of this technique has been limited by disadvantages such as the need for radioactive labeling, time-consuming electrophoresis, and an accurate DNA concentration. These factors play an important role in the sensitivity and resolution of SSCP. A new method referred to as “Cold-SSCP” (Hongyo 1993) enabled SSCP profiles to be visualized directly with ethidium bromide staining.
The effectiveness of PCR-SSCP for detecting cpDNA haplotype polymorphism in
was demonstrated in this study. Orita . (1989) and Spinardi . (1991) have reported differences in SSCP band migration caused by single-base substitutions. In the present study, this method was adopted to enable single-base substitution and indel detection. In both CS5 regions (CS5a and Cs5b), sequence length variations and single-base substitutions were detected as mobility shifts in both SSCP bands. In the CS2 region, SSCP was able to distinguish three sequences that differed from each other by a single-base substitution.
In spite of the conservative evolution of the chloroplast genome, intraspecific variations of cpDNA have been widely reported (Levy ., 1996) and cpDNA has become increasingly valuable as a genetic marker to detect intraspecific variations. CpDNA markers have been used to examine population genetics and structure, haplotype diversity, genetic diversity, and breeding systems (Hong ., 1993; Levy ., 1996; Watano ., 1995). In the present study, cpDNA was adopted to estimate the geographic variation
of . Widyatmoko and Shiraishi
(2011) reported cpNA variation of 6 samples of A. aulacocarpa using intergenic spacer between the P and W gene. The NGI and QLD tend to be separated based on the cpDNA haplotypes.
et al et al
In this study, cpDNA haplotype variations in in the NGI and the QLD were detected in two non-coding regions (the L intron and the intergenic spacer between the P and W genes) by using PCR-SSCP.
Two duplicated regions were detected in the region between the P and W genes (CS5). By cloning and sequencing the DNA fragments, two new pairs of primers were designed, thus enabling the two regions to be specifically amplified by PCR. One of these two regions, maybe CS5b, seems to be a pseudogene. Highly homologous arrangements with cpDNA are also observed in nuclear DNA (ncDNA) (Birky, 1988). If the region was located in ncDNA, the heterozygous type with and should have appeared. However, no heterozygote was detected in any of the 87 samples analyzed in this study. Therefore, both regions were presumed to be located on the cpDNA. However, it cannot be ruled out that one of the two regions is located in a genome other than the cpDNA genome. A total of 7 SSCP types were detected in the three regions, and 4 cpDNA haplotypes were identified based on a combination of the 7 SSCP types (Table 2).
Table 4. Distribution of chloroplast DNA haplotypes of each population in New Guinea and Queensland
Acacia aulacocarpa
No Population No. of cpDNA haplotype (%)
seeds A B C D
New Guinea
1. Kuel, Irian Jaya 6 0.000 0.000 1.000 0.000
2. Makapa WP 5 0.000 0.000 1.000 0.000
3. Isago Arimia River WP 5 0.000 0.000 1.000 0.000
4. Duaba WP 5 0.000 0.000 1.000 0.000
5. Wasua Pedeya WP 5 0.000 0.000 1.000 0.000
6. Kapal NW of Wipim WP 5 0.000 0.000 1.000 0.000
7. Derideri E Morehead WP 5 0.000 0.000 1.000 0.000
8. Wipim WP 5 0.000 0.000 1.000 0.000
9. Balimo District 5 0.000 0.000 1.000 0.000
Northern Queensland
10. Old Rock Hart Airstrip 5 0.000 1.000 0.000 0.000
11. Mcil Wraith Range 4 0.000 1.000 0.000 0.000
12. Piccaninny Creek 2 0.000 1.000 0.000 0.000
13. 10 K NW Mt. Molloy 5 0.000 1.000 0.000 0.000
14. Garioch 5 0.000 1.000 0.000 0.000
15. Buckley Logging Area 5 0.000 1.000 0.000 0.000
Southern Queensland
16. 3K S Mt. Larcom 5 1.000 0.000 0.000 0.000
17. N of Yeppon 5 0.800 0.200 0.000 0.000
18. Samford 5 0.000 0.800 0.000 0.200
0.104 0.414 0.471 0.011
Frequencies of cpDNA haplotypes are shown in parentheses
around 23°S; these two populations had common haplotypes. The other population, namely, the Samford population, shared a common haplotype with the northern QLD group.
In , a correlation between the cluster analysis and geographical distribution has been reported (Butcher, 1998). has been grouped into four distinct regions, the Sidei and Ceram Islands, NGI, the northern part of northern QLD, and the southern part of northern QLD. The group in the northern part of northern QLD was more closely related to the NGI group than to that of the southern part of northern QLD. Similar results have been reported in
(Wickneswari and Norwati, 1993). This species was divided into three distinct groups, the Northern Territory (NT), QLD, and NGI; the populations of QLD were closely
A. mangium
A. mangium
A. auriculiformis
related to those of NGI. In the present study, however, a strong separation was observed between the NGI and QLD populations as regards the cpDNA variation. Since Australia and NGI were separated by the rising sea level during the postglacial period ca. 10,000 years ago, it might be easily predicted that the species adapted to different environments and that the gene flow between Australia and NGI was obstructed.
A rare haplotype was detected in a restricted population. Such a phenomenon has also been recognized in the isozymes of
, and (Moran ., 1989;
Wickneswari and Norwati, 1993; Khasa ., 1994). Rare allelic variants at a particular locus were detected in only one or two populations; this could be due to mutations that arose during the postglacial period. Compared with ,
A. mangium, A. auriculiformis A. crassicarpa et al
et al
auriculiformis A. crassicarpa A. aulacocarpa
A. aulacocarpa
.
A. aulacocarpa
A. aulacocarpa, A. celsa A. disparrima
A. crassicarpa A. crassicarpa, A. midgleyi, A. peregrina
A. crassicarpa A. midgleyi lampcocarpa A. wetarensis
, and , is
more widely distributed and formed larger forests in QLD. Hence, a relatively high level of genetic diversity was expected in this territory; evidence for this hypothesis was given by the polymorphic cpDNA haplotype.
The clustering of the population in NGI and QLD based on cpDNA haplotypes was in agreement with that based on the morphological characteristics No population of NT was investigated in this study. The NGI group appears to belong to subsp. B. The northern QLD group is presumed to correspond to subsps. C and D, whereas the southern QLD group corresponds to subsp. E. If these correspondences are accurate, the differentiation of cpDNA haplotypes in this study supports the subspecies classified by Thompson (1994). Distribution of eight species those clustered into 2 groups (McDonald and Maslin, 2000) also related with cpDNA haplotypes. A. aulacocarpa group (
and ) distributed in northern and southern QLD. However, group
( ), distributed
in NGI and northern QLD. Thus, both groups can be separated with cpDNA haplotypes, except
some population of and
those distribute in southern QLD. No samples of
A. and were collected in
this study because both species were distributed in NT and Wetar.
The geographic distribution of cpDNA haplotypes indicated that the NGI and QLD populations could be grouped into three regions, namely NGI, northern QLD, and southern QLD. There was a large difference in the cpDNA haplotypes among groups from different geographical areas; this was especially the case in the NGI and the QLD groups. This can be utilized to an improvement program as basic information for seed orchard establishment and provenance trial and so on. In general, the necessity of intensive seed collection from many populations should be emphasized; such collection should take place especially in southern QLD, where the highest genetic diversity is maintained.
V. CONCLUSION
ACKNOWLEDGEMENTS
REFERENCES
Using Cold SSCP marker of 4 chloroplast DNA regions four cpDNA haplotypes were identified (A, B, C, and D). The haplotype distribution corresponded with the geographic distribution of the populations. Based on four cpDNA haplotypes, the eighteen populations were divided into three groups, namely, New Guinea Island, Northern Queensland and Southern Queensland.
The authors would like to thank JICA (Japan International Cooperation Agency) project for genetic materials (seeds) supporting. We would also like to thank Dr. Keiya Isoda for his technical assistance.
Balodis, V, and N. B. Clarkd. 1998. Tropical acacias -the new pulpwood. . 51, 179-181. Birky, C.W. 1988. Evolution and variation in plant
choroplast and miticondrial genomes. In: Gottlieb, L. D. and Jain, S. K. (eds)
, pp. 23-54. Chapman and Hall Ltd, London New York.
Bodenes, C., F. Laigret, and A. Kremer. 1996. Inheritance and molecular variations of PCR-SSCP fragments in pedunculate oak
( .). ., 93,
348-354.
Bordáct, S., F. Popescu, D. Slade, U. M. Csaikl, I. Lesur, A. Borovics, P. Kézdy, A. O. König, D. Gömöry, S. Brewer, K. Burg and R. J. Petit. 2002. Chloroplast DNA variation of white oaks in northern Balkans and in the Carpathian Basin.
, 156: 197-209.
Brain, P. and B. R. Maslin. 1996. A serological investigation of the classification of subgenus Phyllodineae (Leguminosae:
Appita J
Plant Evolutionary Biology
Quercus robur L Theor. Appl. Genet
Forest Ecology and Management
Mimosoideae). . ., 24, 379-392.
Brown, G. K., D. J. Murphy, J. T. Miller, and P. Y.
Ladiges. 2008. . and its
Relationship Among Tropical Legumes, Tribe Ingeae (Leguminosae: Mimosoideae).
33:739-751.
Byrne, M., B. MacDonald, and D. Coates. 2002. Phylogeographical patterns in chloroplast DNA variation within the
(Leguminosae: Mimosoideae) complex in Western Australia.
15 : 576-587.
Byrne, M., G. Tischler, B. Macdonald, D. J. Coates, and J. McComb. 2001. Phylogenetic relationships between two rare acacias and their common, widespread relatives in south-western Australia.
2: 157-166.
Clarke, H. D., S. R. Downie, and D. S. Seigler 2000. Implications of chloroplast DNA restriction site variation for systematics of
(Fabaceae: Mimosoideae). 25: 618-632
Butcher, P., G. F. Moran, and H. D. Perkins. 1998. RFLP diversity in the nuclear genome of
. , 81, 205-213. Grace, M.B., G.S. Bambeck, G.S. Buzard, and
B.D. Weintraub. 1995. Transverse temperature-g radient single-strand conformation polymorphism analysis for temperature optimization of 'Cold'-SSCP
mutation detection. . 23,
4224-4226.
Guan L., Suharyanto, and S. Shiraishi. 2011. Isolation and characterization of tetranuc-leotide microsattelite loci in
(Pinaceae). 98: e216-e217. Hattori, K. 1997. Sequencing methods for
PCR-amplified DNA. 15
(7), 711-717.
Hayashi, K. 1991. PCR-SSCP: A simple and sensitive method for detection of mutation
in genomic DNA. ., 1,
34-38.
Hong, Y-P., V. D. Hipkins, and S. H. Strauss. 1993. Chloroplast DNA diversity among trees,
Biochem. Sys Eco
Acacia s.s
Systematic Botany
Acacia acuminata Journal of Evolutionary Biology
Acacia mangium Heredity
Nucleic Acids. Res
Pinus massiniana Am. J. Bot.
Experimental Medicine
PCR Methods Appl
populations and species in the California closed-cone Pines (
). 135:
1187-1196.
Hongyo, T., G.S. Buzard, R.J. Calvert, and C. M. Weghorst. 1993. 'Cold SSCP' : a simple, rapid and non-radioactive method for optimized single-strand conformation
polymorphism analysis. .
21: 3627-3642.
Isoda, K., S. Shiraishi 1999. Identification of chloroplast DNA haplotypes of
and using a polymerase chain reaction with species-specific primers. Judelson, H. S., L. J. Spielman, and R. C Shattock.
1995. Genetic-mapping and non-Mendelian of mating-type loci in the Oomicete, Phytophthora-infestans.
141: 503-512
Khasa, P. D., W. M. Cheliak, and J. Bousquet. 1994. Genetic variation in 26 populations of
and
using allozymes. ., 24: 1123-1132.
Levy, F., J. Antonovics, J. E. Boynton, and N. W. Gillham. 1996. A population genetic analysis of chloroplast DNA in Phacelia.
76: 143-155.
Maeda, H., and S. Shiraishi 1997. An identification of chloroplast DNA haplotypes of
and var. using
flouresence-based PCR-SSCP analysis of L gene. ., 2: 187-188.
McDonald, M. W., and B. R. Maslin. 2000. Taxonomic Revision of the Salwoods: Cunn. ex Benth. and its allies (Leguminosae: Mimosoideae: section
Juliflorae). 13:
21-78.
Moran, G. F., O. Muona, and J. C. Bell. 1988. : A tropical forest tree of the coastal lowlands with low genetic diversity.
43: 231-235.
Moran, G. F., O. Muona, and J. C. Bell. 1989. Breeding systems and genetic diversity in
and .
21: 250-256.
Pinus radiata, Pinus muricata and Pinus attenuata Genetics
Nucleic Acids Res
.
Abies firma A. homolepis
Genetics .
Racosperma auriculiforme Racosperma mangium Can. J. For. Res
Heredity
.
Larix kaempferi L. gmelinii japonica rbc J. For. Res
Acacia aulacocarpa
Australian Systematic Botany
Acacia mangium Evolution
Orita, M., H. Iwahana, H. Kanazawa, K. Hayashi, and T. Sekiya. 1989. Detection of polymorphisms of human DNA by gel e l e c t r o p h o r e s i s a s s i n g l e - s t r a n d conformation polymorphisms.
, 86: 2766-2770.
Pettigrew, C. J. and L. Watson. 1975. On the classification of Australian Acacias.
. 23: 833-847.
Rehben, H., G. Kress, and T. Schmidt. 1997. Application of PCR-SSCP to species identification of fishery products.
74: 35-41.
Spinardi, L., R. Mazars, and C. Theillet. 1991. Protocols for an improved detection of
point mutations by SSCP. .
19: 4009.
Taberlet, P., L. Gielly, G. Pautou, and J. Boubet. 1991. Universal primers for amplification of three non-coding regions of chloroplast
DNA. . 17: 1105-1109.
Thompson, L.A.J. 1994.
and : an
annotated bibliography. Division of Forestry, Australian Tree Seed Centre, Canberra. 131pp.
Proc. Natl. Acad. Sci. USA
Aust. J. Bot
J. Sci. Food Agric.
Nucleic Acids Res
Plant Mol. Biol
Acacia aulacocarpa, A. cincinnata, A. crassicarpa A. wetarensis
Watano, Y. M. Imazu and T. Shimizu. 1995. Chlo-roplast DNA typing by PCR-SSCP in the
- var. com
plex (Pinaceae). . 108: 493-499. Wickneswari, R. and M. Norwati. 1993. Genetic
diversity of natural populations of in Australia and Papua New Guinea. . 41: 65-77.
Widyatmoko, AYPBC., A. Watanabe, and S. Shiraishi. 2010. Study on genetic variation and relationships among four Acacia species using RAPD and SSCP marker.
, 7: 125-144. Widyatmoko, AYPBC. and S. Shiraishi. 2011.
Sequence polymorphisms of four chloroplast genes in four Acacia species.
8: 79-89.
Wolfe, K. H., W.-H. Li, and P. M. Sharp. 1987. Rates of nucleotide substitution vary greatly among plant mitocondrial, chloroplast, and nuclear DNAs.
84: 9054-9058.
Zulfahmi, I. Z. Siregar, and U. J. Siregar. 2010. Chloroplast DNA variation of Shorea acuminata Dyer in Eastern Sumatra assessed by microsatellite markers.
11 (3): 107-111.
Pinus pumila P. parviflora pentaphylla -J. Plant. Res
Acacia auriculiformis
Aust. J. Bot
Journal of Forestry Research
Journal of Forestry Research
Proc. Natl. Acad. Sci. USA