Technical Note:
Infrastructure Leakage Index (ILI) as Water Losses Indicator
Winarni, W.1
Note from the Editor
The key in developing a strategy for management of non-revenue water (NRW) is to gain a better understanding of the reasons for NRW and the factors which influence its components. The components of NRW can be determined by conducting a water balance analysis. The International Water Association (IWA) provides a water balance calculation that gives guidance to estimate how much is lost as leakage from the network (physical losses), and how much is due to non physical losses. Further, IWA has established the Infrastructure Leakage Index (ILI), a performance indicator for comparisons of leakage management in water supply systems. This paper introduces ILI and reasons why it is a more appropriate approach to use than the percentage of system input volume.
Introduction
The annual volume of water losses is an important indicator in assessing water utility efficiency, both in individual years and as a trend over a period of years. High and increasing water losses are an indicator of ineffective planning and construction, and also of low operational maintenance activities. In developing countries, the combination of water losses with poor sanitation and intermittent supplies often gives impact to a serious health risk.
Key to establish a strategy for management water losses is to gain a better understanding of the reasons for losses and the factors which influence its components. Significant advances have been made by some water utilities in the understanding and modeling of water loss components, and in defining the economic level of leakage. Yet, despite some encouraging success stories, most water supply systems worldwide continue to have high levels of water losses.
Some countries have established water balance analysis, but unfortunately a wide diversity of formats and definitions are used, often within the same country.
1 Environmental Engineering Department, Trisakti University, Jakarta, Indonesia
Email: [email protected]
Note: Discussion is expected before November, 1st 2009, and will be published in the “Civil Engineering Dimension” volume 12, number 1, March 2010.
Received 31 October 2008; revised 19 January 2009; accepted 8 March 2009.
Part of the problem has been the lack of a meaningful standard and performance indicator (PI) in reporting, benchmarking and comparing the actual water losses management performance between different utilities. Being aware of the problems of the wide diversity water balance formats and methods, practitioners have identified an urgent requirement for a common international terminology. Drawing on the best practice from many countries, International Water Association (IWA) Task Forces on Water Losses and Performance Indicators have produced an international best practice approach for water balance calculation. [1]
Furthermore, in the recent years, IWA Task Forces have developed and tested the usage of Infrastructure Leakage Index (ILI) as a water losses performance indicator. ILI accommodates the fact that real losses will always exists, even in the very best and well managed distribution system. The international PI can give the most rational technical basis for comparisons water losses between utilities, which can be used by the operators to measure their attempt in water losses reduction.
International Water Balance
Water balance is based on measurements or estimations of (i) water produced, (ii) water imported and exported, (iii) water consumed, and (iv) water lost. The water balance calculation provides a guide to estimate how much is lost as leakage from the network (‘real’ losses), and how much is due to non-physical losses (‘apparent’ losses). This calculation allows the practitioner to answer the question of ‘how much water is being lost?’
The water balance is computed over a 12 month period, thus represented the annual average of all components. The components of water balance should always be calculated as volume before any attempts is made to calculate performance indicators. Considering the problem of different water balance format and methods, the IWA has developed an international standard of water balance structure and terminology as shown in Figure 1 [1]. Meanwhile, this standard format has been adopted by national associations in a number of countries and also by American Water Works Association (AWWA). [2].
Definitions of principal components of the IWA water balance are as follows:
- System Input Volume is the annual volume input to the particular part of the water supply system.
- Authorised Consumption is the annual volume of metered and/or non metered water taken by registered customers, the water supplier and others who are implicitly or explicitly authorized to do so. It includes water exported, leaks and overflows after the point of customer metering.
- Non-Revenue Water (NRW) is the difference between System Input Volume and Billed Authorised Consumption. NRW consists of:
• Unbilled Authorised Consumption (usually a minor component of the water balance). • Water Losses.
- Water Losses is the difference between System
Input Volume and Authorised Consumption, consists of Apparent Losses and Real Losses.
- Apparent Losses consists of unauthorised consumption due to all type of metering inaccuracies.
- Real Losses are the annual volumes lost through all types of leaks, bursts and overflows on mains, service reservoirs and service connections, up to the point of customer metering.
Nowadays, the term of ‘water loss’ and ‘NRW’ are internationally accepted, and have replaced the term of ‘unaccounted-for water’ (UFW) since there is a wide interpretation of the term UFW and less consistent which make inter-country comparison more difficult. Besides, the water balance shows that all losses can be accounted for. Therefore the IWA Task Forces do not recommend using of this term anymore.
Water Losses and Leakage
Non-Revenue Water
Non-revenue water is a volume of water which enters the distribution system but does not give any revenue to the utility, loss of revenue. NRW includes not only the real losses and apparent losses, but also the unbilled authorized consumption.
Unbilled authorized consumption is normally only a small component of the water balance. Its includes items such as fire fighting, flushing of mains and
Billed Metered Consumption
Billed Unmetered Consumption
Unbilled Metered Consumption
Unbilled Unmetered Consumption
System Input Volume Unauthorized Consumption
Metering Inaccuracies
Water Losses Leakage on Transmission and/or
Distrubution Mains
Real Losses Leakage and Overflows at
Utility's Storage Tanks
Leakage on Service Connections up to point of Customer Metering Billed Authorized
consumption
Revenue water
Authorized Consumption
Non Revenue Water (NRW) Unbilled Authorized
Consumption
Apparent Losses
sewers, cleaning of distribution storage tanks, filling of water tankers, public hydrants, street cleaning, watering of municipal gardens, public fountains, frost protection, etc. They may be metered or unmetered, according to local practice.
The available documentations of such usages often show that the volumes of unbilled authorised consumption are unnecessarily high. It can be managed down to lower annual volumes without influencing operation efficiency of customer service standards. For this reason, such volumes should be metered wherever feasible.
Water Losses
Besides definition as mentioned above, water losses can also be defined as a difference between NRW and unbilled authorized consumption. It is important to differentiate between water loss and leakage, since not all losses are the result of leaking pipe and poor infrastructure. As can be seen in Figure 1, water loss is apparent losses (non-physical losses and management losses) and real losses (physical losses).
Leakage is usually the major component of water loss in developed countries. But this is not always the case in developing countries, where illegal connections, meter error or accounting errors are often more significant. Water theft and illegal connection are often the result of local customs, combined with tariff structures or inadequate metering policies.
As the magnitude of the two components of water losses, real and apparent losses, is known, it is possible to:
- Predict the potential savings (from real losses) and potential revenue increases (from apparent losses).
- Develop real and apparent losses reduction strategy.
- Set realistic targets.
Not all countries have the luxury or well developed network infrastructure. Many are struggling to ensure that their customers receive a reasonable water supply to sustain health and life, often in a network with outdated infrastructure, poor record systems, inadequate technical skills and technology, an unsuitable tariff structure or revenue collection policy, and a poor operation and maintenance policy. Programme to reduce apparent losses will usually dependent on longer term of changes to metering, regulatory and legislative policies.
Factors Influencing Real Losses
There are several local factors which constrain performance in managing real losses. Based on a
reference data set of 27 diverse water distribution systems in 20 countries used by Lambert et al [3], it was found that these factors can vary widely between individual distribution systems, i.e.: (i) length of mains, (ii) number of service connections, (iii) location of customer meters on service connections, (iv) average operating pressure, and (v) continuity of supply.
The real losses in the water balance are the leakage occurs in the distribution system up to the metering point. Therefore the ’number of service connections’ is logically preferable to the ‘number of properties’, since there is a possibility that a single service connection serves a much larger properties. However, even where apartments are individually metered, the water balance calculation is usually based on the leakage up to a single master meter on the service connection. [1, 4].
In many systems, the customer meter is located close to the street/property’s boundary and the service pipe between the main and the customer meter is owned and maintained by the water utility. In case the customer meter is located some distance after the street/property’s boundary, the leakage on the private pipe between the street/property’s boundary and the customer meter should be included in the real losses component. It should be considered since the practitioner experiences that, in most well run systems, the largest volume of real losses is associated with service connections rather than main.
Many countries recognize pressure control as a technique for managing leakage, but there are local limits to the lowest acceptable average pressures that can be achieved. The average frequency with which new leaks occur, and rates of flow of individual leaks, is very sensitive to operating pressures. The observed weighted average relationship for large systems appears to be that leakage rates vary with pressure to the power of 1.15. The simplified formula is that leakage rate vary linearly with operating pressure except at very high of very low pressure.
The percentage of time for which the distribution system is pressurized is an important parameter to be included in real losses estimation. This can be achieved by expressing the annual volume of real losses as a volume per day ‘when the system is pressurized’ (w.s.p.). The average operating pressure should also be calculated over the period when system is pressurized.
and burst, and the speed with which leaks and bursts become visible at ground surface. These real losses can be undetected for a long period. However, correct selection and laying of pipe materials and modern leakage control methods can reduce these influences significantly.
Performance Indicators for Management of Real Losses
Performance indicators provided in the Manual of Best Practice of IWA [1] which are used to compare the performance of water losses management are:
- Water losses and real losses as a % of system input volume.
- Water losses per house connection.
- Water losses per km of mains per day (density of connections < 20 per km of mains).
- Infrastructure Leakage Index (ILI).
Percentage of System Input Volume
Water losses as a percentage of system input, which is a traditional indicator, is easily calculated and is certainly the most common indicator quoted by non specialists, including politicians and the media. They incorrectly believe that this is the most meaningful measure of performance for NRW, Undoubtly it is better than have no target at all. But this indicator is unsuitable for assessing the efficiency of management
of distribution system, since the values of percentage NRW are:
- Strongly influenced by consumption (and changes in consumption).
- Influenced by the high pressure (above average pressure).
- Difficult to interpret for intermittent supply situations.
- Not distinguishable between apparent and real losses.
For many years, technical groups in Germany and the United Kingdom draw attention to the undue influence of consumption and changes in consumption, when water losses are expressed as a of system input volume. The same volume of real losses can have a different percentage of losses depending to the consumption. If average real losses are 100 litres/service connection/day, then real losses as percentage of system input would be (i) 29% for consumption of 250 litres/connection/day, or (ii) 1% for consumption of 8000 litres/connection/day.
When consumption decreases, seasonally or annually, or due to demand management measures, the percentage of real losses increases even if the volume of real losses remains unchanged. When consumption increases, the opposite effect occurs. This influence of consumption is demonstrated in Figure 2 whereas the curved line represents the same real losses of 200 liters/connection/day. [5].
There are also problems of interpreting percentage of real losses in the situation of intermittent supply. A system with 12 hours supply per day may easily has only 20% real losses. But what would this figure look like in the uninterrupted supply situation? Consider that all burst will leak for 24 hours instead of 12 and thus twice as much water would be lost. This problem is found in Southeast Asia since intermittent supply is quite a common occurrence as reported by Asian Development Bank, 1997 [6]. It mentioned that Seoul (South Korea) has 34% losses with 24 hours supply per day, but Karachi (Pakistan) has 30% losses with 1 – 4 hours supply per day. Also Chennai (India) with 4 hours supply has losses of 20%. Seoul is certainly not worse than Karachi and Chennai.
Water Losses per House Connection
Considering that water losses as percentage of system input volume only shows water resources efficiency for the top management, and does not provide any information on management of distribution system, IWA recommended operational PI per service connection (m³/connection/year). Experience from practitioners shows that the frequency of leaks and bursts, and of the annual volume of real losses, are several times higher on service connections rather than mains since there are large number of joints and fittings on service connections between the main and the edge of the street. Although average burst flow rates are higher for mains than for service connections, when typical proportions of unreported bursts, and average durations of different types of bursts, are taken into account, it is evident that in most systems the largest volume of annual real losses generally occurs on service connections. [5].
There will of course be some systems where the greatest proportion of real losses will be associated with the length of mains, rather than the service connections. In well managed systems, this ‘break-point’ occurs when the density of connections is around 20 per km of mains [1, 4]. Therefore, for the density of connections less than 20 per km of mains, IWA provides indicator as water losses per length of mains (m³/km length of mains/year).
In the case of systems subject to intermittent supply, this indicator expressed as ‘litres/service connection/ day when the system is pressurised’. The annual volume of real losses is divided by the equivalent number of days that the system is pressurized, rather than by 365 days. This indicator allows for comparison between distribution systems with variations in supply time.
The Infrastructure Leakage Index, ILI
Even though using traditional indicator ‘volume/
allow comparisons between systems with different level of supply, however this indicator still does not take operating pressure into account, which is a major disadvantage. Also, it is influenced by difference of connection density and distance of customer meter to street/boundary.
In 1997 Allan Lambert (in Liemberger [6]) realized the need for a real losses performance indicator which would allow international comparisons between systems with very different characteristics, e.g. intermittent supply situations, low and high pressure systems, differences in consumption levels and so on. Therefore IWA recommended the use of ILI, abbreviation of Infrastructure Leakage Index, which is categorized as level-3 indicator i.e. indicators that provide the greatest amount of specific detail but are still relevant at the top management level [1].
The ILI, which in the first few years known to only a few insiders, is now widely accepted and used by practitioners around the world, as it best describes the efficiency of the real loss management of water utilities. It is a measurement of how well a distribution network is managed (maintained, repaired, and rehabilitated) for the control of real losses, at the current operating pressure. [3, 6]
ILI is the ratio of Current Annual Real Losses (CARL) to Unavoidable Annual Real Losses (UARL), or ILI = CARL / UARL. Being a ratio, the ILI has no units and thus facilitates comparisons between countries that use different measurement units (metric, U.S., British).
Concept of Infrastructure Leakage Index
This section describes the concept of ILI, to get better understanding how water balance and ILI could identify the priorities to address in leakage management strategy.
Real Losses Management Strategy
The number of new leaks arising each year is influenced primarily by long-term pipeline management. Replacing an old main with a new installation will undoubtedly reduce leakage from the main. However, unless the service connections are also renewed, the benefit may not be as great as first estimated. Reducing the time it takes to repair a leak will also reduce the volume of leakage. The average duration of the leaks is limited by the speed and quality of repairs, and the active leakage control strategy controls how long unreported leaks run before they are located.
Real losses can be severe, and may go undetected for months or even years. The volume lost will depend on the characteristics of the pipe network and the leak detection and repair policy practiced by the utility, i.e. [7]:
- The pressure in the network.
- The frequency and typical flow rates of new leaks and bursts.
- The proportions of new leaks which are ‘reported’. - The ‘awareness’ time (how quickly the loss is
noticed).
- The ‘location’ time (how quickly each new leaks is located).
- The repair time (how quickly it is repaired or shut off).
- The level of ‘background’ leakage (undetectable small leakage).
Pressure management is one of the fundamental elements of a well-organized leakage management strategy. The effective schemes are those which cover a large area and which make a significant impact on average pressures.
The benefits of pressure management are:
- Extension of the life of the distribution infrastructure.
- Reduction of new burst frequencies on
distribution mains and service connections.
- Reduction of flow rates of all leaks and bursts present in the system at any time.
- Reduction of new leaks on private pipes and overflows at private storage tanks.
- Reduction of some components of consumption subject to direct mains pressure.
Unavoidable Annual Real Losses, UARL
Leakage management practitioners are well aware that real losses will always exist, even in the very best systems. The volume of Unavoidable Annual Real Losses (UARL) which is the lowest technically achievable annual real losses for a well maintained and well managed system, is represented in Figure 3 by the smaller inner rectangle. The difference between CARL (large rectangle) and UARL (small rectangle) is the potentially recoverable real losses.
UARL is a useful concept as it can be used to predict, with reasonable reliability, the lowest technical annual real losses for any combination of mains length, number of connections, customer meter location at current operating pressures, assuming that the system is in good condition with high standards for management of real losses and there are no financial or economic constraints.
It is just a question of how high these UARL will be. IWA Task Forces have developed a ‘user friendly’ pressure-dependent formula for predicting UARL values in a wide range of distribution systems [3], i.e.:
UARL (litres/day) = (18 x Lm + 0.8 x Nc + 25 x Lp)
x P (1)
Potentially Recoverable Real Losses
UARL
Pressure Management
Speed and Quality of Repairs
Active Leakage Control
CARL
Where Lm is mains length in km, Nc is number of service connections, Lp is the total length of underground pipe between the edge of the street and customer meters in km, and P is average operating pressure in meter.
This formula considers real losses for modeling and calculation purposes:
- Background losses from undetectable leaks (i.e. at joints and fittings), which flow rates too low for sonic detection if non-visible. Typically low flow rates and long durations.
- Losses from reported leaks and bursts, based from experiences of frequency, typical flow rate, average duration target. Typically high flow rates but short duration.
- Losses from unreported leaks and bursts, based from experiences of frequency, typical flow rate, average duration target. Typically moderate flow rates but durations depend on the method and intensity of active leakage control.
- Pressure, whereas the correlation between pressure and leakage rate assumes to be linear.
With current knowledge and experience, UARL can be calculated for any system with more than 5000 service connections, density of connections greater than 20 per km mains, and operating pressure between 25 – 100 metres. [3, 4]
Application of ILI
The ratio of the CARL to the UARL (ILI) is a measure of how well the three infrastructure management functions – repairs, pipelines and asset management, active leakage control – are being undertaken separates from the aspects of pressure management.
In the beginning of developing the ILI methodology, based on international utilities data collected by IWA Water Losses Task Forces [5], North West England Utilities [8], North America and Australia [4], it found the maximum value of ILI is 14. It is important to note that this ILI is a result from the systems which had reasonable data and active policy to manage real losses. Since 1999, many more ILI values have been calculated for systems in more than 40 countries which show utilities with ILI in excess of 100.
Although a well managed system can have an ILI of 1.0 (CARL = UARL), this does not necessarily have to be the target as the ILI is a purely technical performance indicator and does not take economic considerations into account. For any water distribution system there is a level of leakage below which is it not cost effective to make further investment or use additional resources to drive leakage down further. In other words, the value of
In
fra
s
tru
c
tu
re
L
e
a
k
a
g
e I
nde
x
(IL
I)
Connection Density (numbers / km)
the water saved is less than the cost of making further reduction.
The variation of ILI shows a positive relationship with connection density, the higher the density the higher the ILI, as explain in Figure 4. Pearson [7] had identified that it was likely to be a result of:
- The longer location times in more complex urban areas.
- The longer reparation times due to road access restrictions.
- Asset lifetime, especially for the old connection.
Further, Liemberger [6] showed that the water losses as percentage of system input did not represent the performance of water losses management. Table 1 showed utilities with less than 15% real losses, which was obviously considered that real losses up to 15% indicate a reasonable leakage management performance. Taking as examples Vienna Water Works (Austria) and Ecowater (New Zealand), whose real losses are between 8 and 9%, ILI comparison showed that Ecowaters’s leakage management performance was 6 times better than Vienna’s. [6]
Conversely, it is not always the case that utilities with CARL of more than 15% have poor leakage management. Table 2 shows the 10 best-performing utilities with ILIs below 4 but their CARL represent between 6.0 – 24.2 % of their system input.
Table 1. ILI in the Utilities with Real Losses less than 15%
Utility Country Wide Bay Water Water Board of Lemesos SA Utility 1
Source: Liemberger [6]
Table 2 Percentage Water Losses in the Utilities with ILI less than 4,0
Utility Country ILI CARL, % system
input Ecowater
Water Board of Lemesos Wide Bay Water Malta WSC SA Utility 13 Bristol Water Plc SA Utility 20 SA Utility 6
Charlotte County Utilities SA Utility 26
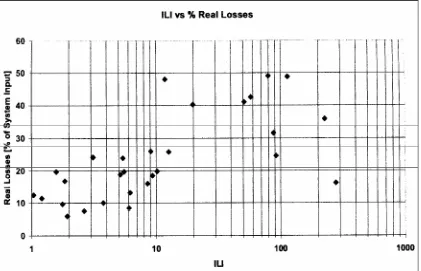
Figure 5 shows the leakage management performance of 30 utilities using the ILI and the respective losses expressed as percentage of total
system input. It is obvious that there is no correlation, for example 50% real losses mean in one case an ILI around 12 and in another case 114. This chart confirms that lower level of real losses say 10% is not necessarily an indication for good real losses management.
Data collected in Figure 5 also shows that the highest calculated ILI was 278, in Dushanbe, the capital city of Tajikistan. However, water consumption in this city is extremely high, so the real losses only represent 16.2 % of total system input. The ILI of 278 sounds unrealistic high, but in individual areas in Selangor, Malaysia, ILI values of up to 485 was observed (average 88) since there is no attention and repairement of burst pipe for years. [9].
Conclusions
The different terminology, calculation methods, and variety of water balance and Non-Revenue Water performance indicators limit the possibilities for benchmarking the true performance. The IWA has developed a standard international water balance structure and terminology. This standard format has meanwhile been adopted by national associations in a number of countries. It always worth to try to establish a water balance, even if main elements are based on estimates.
It is expected that this paper can convinced managers of water utilities with still high (or unknown) level of water losses that the establishment of water balance will be an important first step towards more efficiency.
It is obvious that the comparison of leakage management performance between utilities should not be based on percentage of system input volume. Since it is influenced by consumption and does not take into account the factors of supply continuity, mains length, number of service connections, location of customer meters, and average operating pressure. The decision makers, policy makers, and top management of water utilities should be aware of the weakness of using term of NRW as percentage of system input volume.
Accurate performance indicators should be used for benchmarking, international performance comparison, target setting or contractual target for internationally funded project/private sector participation.
The Infrastructure Leakage Index (ILI) is a new performance indicator for real losses, which measures the ratio of current annual real losses to system-specific unavoidable annual real losses. It is
comparison. The ILI approach provides an improved basis for technical comparisons of leakage management performance which separates aspect of infrastructure management; repair, pipe and assets management, effectiveness of active leakage control policy, from aspects of pressure management.
There is no correlation between ILI and NRW as percentage of system input volume. Low percentage of NRW is not necessarily an indication for good real losses management.
References
1. Alegre H., Hirnir W., Baptista J.M., and Parena R., Performance Indicators for Water Supply Services, IWA Manual Best Practice, first edition, IWA Publishing, London, 2000.
2. Liemberger R. and Farley M., Developing a Non-Revenue Water Reduction Strategy, Part 1: Investigating and Assessing Water Losses, Paper to IWA Congress, Marrakech, 2004. (download from www.liemberger.cc).
3. Lambert A.O., Brown T.G., Takizawa M., and Weimer D., A Review of Performance Indicators for Real Losses from Water Supply Systems,
AQUA, 48 (6), ISSN 0003-7214, 1999, pp. 227– 237.
4. Lambert A.O. and McKenzie R.D., Practical Experience in using the Infrastructure Leakage Index, Paper to IWA Managing Leakage
Conference, Cyprus, 2002. (download from
www.liemberger.cc).
5. Lambert A.O., International Report on Water Losses Management and Techniques: Report to IWA Berlin Congress, October 2001, Water Science and Technology: Water Supply, 2 (4), ISSN 1606-9749, 2002, pp. 1–20.
6. Liemberger R., Do You Know How Misleading the Use of Wrong Performance Indicators can be?, IWA Managing Leakage Conference, Cyprus, 2002. (download from www.liemberger.cc).
7. Farley M., Non-Revenue Water–International Best Practice for Assessment, Monitoring and Control, 12th Annual CWWA Water, Wastewater & Solid Waste Conference, Bahamas, 2003. (download from www.liemberger.cc).
8. Pearson D., Testing the UARL and ILI Approach Using a Large UK Data Set, IWA Managing Leakage Conference, Cyprus, 2002. (download from www.liemberger.cc).
9. Preston S.J. and Sturm R., Use of the Infrastructure Leakage Index (ILI) in Malaysia,
![Figure 1. International Standard Water Balance and Terminology – IWA [1].](https://thumb-ap.123doks.com/thumbv2/123dok/3672569.1469750/2.595.73.540.549.733/figure-international-standard-water-balance-terminology-iwa.webp)

![Figure 3. Basic Methods of Managing Real Losses. [5]](https://thumb-ap.123doks.com/thumbv2/123dok/3672569.1469750/6.595.137.448.87.278/figure-basic-methods-managing-real-losses.webp)
![Figure 4. Relationship of ILI to Connection Density in North West England. [8]](https://thumb-ap.123doks.com/thumbv2/123dok/3672569.1469750/7.595.59.523.450.759/figure-relationship-ili-connection-density-north-west-england.webp)