VEGETATIVE GROWTH OF GRAIN SORGHUM IN
RESPONSE TO PHOSPHORUS NUTRITION
Rafael Camacho1*; Eurípedes Malavolta2; José Guerrero-Alves1; Tomás Camacho1
1
Center for Research and Extension of Soils and Waters (CIESA), University “Rómulo Gallegos”, San Juan de los Morros, 2301, Guárico-Venezuela.
2
Lab. de Nutrição Mineral de Plantas - USP/CENA, C.P. 96 - CEP: 13400-970 - Piracicaba, SP. *Corresponding author <[email protected]>
ABSTRACT: Morphological variables such as phytomass, plant height, leaf area, number of leaves, have been used to express the influence of mineral nutrients on plant growth patterns, since the vegetative development responds, in general, favorably to fertilizer applications. This work evaluates the effect of P on both, some morphological characteristics and total [P] in the shoot of eight grain sorghum (Sorghum bicolor L.
Moench) genotypes. Genetic materials were grown in nutrient solution under three concentrations of P (0; 0.5 and 1.0 mmol L-1)
. Plants were harvested 41 days after sowing, and leaf area per plant (LA), number of leaves
(NL) per plant, root volume (RV), plant height (PH), root dry matter (RDM), shoot dry matter (SDM), total dry matter (TDM), RDM/SDM ratio, and total P concentration in shoot were determined. RDM/SDM was high for treatment P(0) and diminished about twice when P was added. Lack of applied P decreased the final NL and LA. Shoot [P] was positively correlated with solution [P], but the increase in P concentration in the nutrient solution from 0.5 to 1.0 mmol L-1 had a negative effect on growth. Both under deficiency and sufficiency
conditions of P, Himeca-101 showed the best behavior in terms of RDM, SDM, TDM, RV, LA and NL. LA and PH were identified as the best indicators to predict dry matter yield of sorghum plants under P supply conditions. Key words: sorghum, phosphorus, leaf area, plant height, root volume
CRESCIMENTO VEGETATIVO DE SORGO GRANÍFERO EM
RESPOSTA À NUTRIÇÃO FOSFATADA
RESUMO: Peso da matéria (fresca e/ou seca), altura de planta, área foliar e número de folhas por planta são variáveis usadas para estudar o efeito dos nutrientes minerais sobre o crescimento das plantas ou de alguns de seus órgãos. Assim, é indicado que o crescimento vegetativo responde favoravelmente a aplicações de P. Avaliou-se o efeito do P em oito genótipos de sorgo granífero (Sorghum bicolor L. Moench).
Os materiais genéticos foram crescidos em solução nutritiva sob condições de casa de vegetação, com três concentrações de P (0, 0,5 e 1,0 mmol L-1). Plantas foram colhidas 41 dias após a semeadura e o
número de folhas por planta (NL), área foliar por planta (LA), volume de raízes (RV), altura de planta (PH), matéria seca de raízes (RDM), matéria seca da parte aérea (SDM), matéria seca total (TDM), razão raiz/ parte aérea (RDM/SDM) e o teor de P total na parte aérea foram usados para avaliar o crescimento vegetativo. RDM/SDM foi alta no tratamento deficiente em P e diminuiu perto de duas vezes nos tratamentos que receberam o nutriente. [P] na parte aérea foi positivamente correlacionada à [P] na solução nutritiva. Observou-se diminuição do crescimento quando os genotipos passaram de 0,5 a 1,0 mmol L-1. Sob condições
de carência e suprimento de P, Himeca-101 mostrou o melhor comportamento em termos de RDM, SDM, TDM, RV, LA e NL. LA e PH foram os melhores indicadores para predizer o rendimento da matéria seca sob condições de suprimento de P.
Palavras-chave: sorgo, fósforo, área foliar, altura de planta, volume radicular
INTRODUCTION
Grain sorghum is a staple food in countries like India and China (Nour & Weibel, 1978). In Venezuela, the phytomass (total above ground biomass, including grain) is totally used as animal feed. The crop is adapted to tropical, sub-tropical and temperate areas. In Tropical America sorghum yield, as well as those from other crops, are limited by nitrogen and, in second place, by low soil phosphorus status (Camacho & Malavolta, 1999).
Over the years, some morphological characteristics such as phytomass, plant height, leaf
Since positive correlations have been found between plant height and yield of maize genotypes (Camacho & Caraballo, 1994), this character, therefore, could be an important selection criterion in breeding programs. Despite of this, plant height has received little attention by plant breeders.
Because of that the numerous nutritional differences suggest the genetic control of inorganic plant nutrition (Gerloff & Gabelman, 1983), therefore in this study, some morphological variables were used to determine the ability of eight sorghum cultivars to grow well under P-lack or P-supply conditions. Other objectives were: describing the relationships among dry matter production and morphological variables, substrate-P, and shoot-P. On the other hand, this experiment was based on the following hypothesis: between limits, there must be a positive correlation between P in the nutrient solution and morphological variables, and P in shoots.
MATERIAL AND METHODS
Seeds of eight genotypes of grain sorghum (cvs. Criollo-1, Criollo-8, Sefloarca-7, Sefloarca-10, Himeca-101, Himeca-303, Pioneer YSB83 and Wac 8228-BR) were placed to germinate on vermiculite moistened with a 10-4 mol L-1 solution of calcium sulfate (CaSO
4). Seedlings were kept for 10 days in Johnson’s solution (Johnson et al., 1957) diluted five-fold. Afterwards the young plants were transferred to the full strength solution, which was modified to supply three P concentrations: 0; 0.5 and 1.0 mmol L-1 wherein they were grown during 20 days until the vegetative growth was evaluated. The other macro and micronutrients were added in equal rates to all plants. Nutrient solutions were constantly aerated and renewed every other week. Plants were grown in 3-L plastic containers.
When the growing period was completed, 41 days after sowing, plants were harvested and split into root and shoot. Vegetative material was then washed with distilled water, wrapped in paper towels and brought to the laboratory where the following data were recorded: leaf area (LA), was measured with a video image analysis system (Van Lier et al., 1994); root volume (RV), [measured by water displacement]; plant height (PH), [from root crown to insertion point of flag leaf]; number of leaves per plant (NL); root (RDM), shoot (SDM) and total (TDM) dry matter yield; and total P in shoots [P was analyzed by the metavanadate method (Malavolta et al., 1997)].
Three replicates in a completely randomized design were used in the greenhouse. The data collected were analyzed using an ANOVA model, and the Tukey test (P<0.01) was used to compare all eight genotypes
for into each P concentrations in the nutrient solution. Moreover, the 0.01 probability level was used to express the relationships between the following variables: morphological characteristics and P in shoots, both with
substrate-P. In the same way, coefficients of correlation were calculated and used to study the relationships between dry mass yield and the other variables.
RESULTS AND DISCUSSION
P concentration in shoot - Shoot [P] increased with increasing solution [P], with Himeca-303 and Wac having a much lower tissue [P] than the other sorghum hybrids for medium solution [P] (Table 1). For the highest nutrient solution [P] employed here (1 mmol L-1), Criollo-8 and Pioneer were associated to higher shoot [P], but there were no differences between both hybrids. Himeca-303 had low shoot [P] for equivalent substrates [P]s of 0.5 and 1 mmol L-1. In the same way, for phosphate-deficient (-P) medium there were no differences among cultivars in tissue [P]. These results seem to point out that variations in shoot [P] are least when nutrient solution [P] is low and greatest when solution [P] is high, as proposed by Nelson (1980) when foliar P was studied.
Although genotypes presented differential P concentrations in shoots when P was applied to the nutrient solution, all of them, except Himeca-303 and Wac for 0.5 mmol L-1 P, exhibited internal [P] values above those considered adequate (see Bieleski & Ferguson, 1983; Bergmann, 1992; Malavolta et al., 1997), which could lead to toxicities.
Dry matter production - The decrease in shoot [P] upon withdrawal of Pi from the nutrient medium was accompanied by an enhance in root dry matter and a marked decrease in shoot and total dry matter as compared to sorghum plants grown on phosphate-sufficient media (Tables 1 and 2). The observations on the fact that root growth is less sensitive to P deficiency than shoot growth, are consistent with several reports of diverse species (Asher & Loneragan, 1967; Atkinson, 1973; Lynch et al., 1991) and could reflect reduced transport of P from root to shoot (Lindgren et al., 1977), in addition to reduced shoot water availability (Radin & Eidenbock, 1984) and other shoot-specific responses.
Himeca-101 consistently produced the greatest RDM for all solution [P]s. For low and medium [P]s in the nutrient solution, there were differences among hybrids in root, shoot and total DM, but for the highest solution [P], the same yield variables were not altered by hybrid effects. For 0.5 mmol L-1 P, Criollo-1, Criollo-8 and Himeca-101 had greater SDM than the other five genotypes. Also, for 0.5 mmol L-1 P level, Himeca-101 increased the root and shoot dry matter about 200 and 65%, respectively, as compared to the hybrid Pioneer.
(Camacho, 1996), therefore sorghum plants grown in the highest [P] seem to be under toxicity conditions. According to Heldt et al. (1977), optimum [P] to fix CO2 is about 0.5 mmol L-1, and above this level the 14C incorporation into starch is drastically reduced. Contrary to what is expected for soils, phosphorus toxicity is of particular importance in solution culture experiments, in which excessive phosphorus levels are quite common (Marschner, 1986).
Root:shoot regulation has recently also received attention from a purely scientific and from an environmental point of view (Camacho & Caraballo, 1994). In this work, for low and medium solution [P]s clear genotypic differences were found for the RDM/SDM ratio, but none for 1.0 mmol L-1 P (Table 2). For 0 mmol L-1 P solutions strongly increased the RDM/SDM ratio despite reducing RDM, with Criollo-1 exhibiting the best behavior (0.62) and Pioneer showing a lowest value (0.37), while the other six genotypes presented an intermediate performance without any differences among them. An increase in the root:shoot ratio is commonly observed under P-limiting growth conditions (Asher & Loneragan, 1967).
One of the most pronounced effects of phosphate deficiency on plants is the reduction of shoot growth while root growth is unaffected or even stimulated (Freeden et al., 1989). According to the Thornley model of photosynthate partitioning (Marschner et al., 1997), the increase in root/shoot ratio under low phosphate conditions is presumably adaptative: low phosphate plants allocate more of their photosynthates and P to roots at the expense of shoot growth, and these photosynthates are used to increase the uptake capacity of the root for phosphate (Barber, 1979; Freeden et al., 1989). The root growth is enhanced, relatively, under deficiency of phosphorus or any nutrient of high mobility in the phloem, but not under deficiencies of nutrients of low or none redistribution, such as calcium and boron (Marschner et al., 1997). This capacity to divert and increase the proportion of plant resources for root development has been demonstrated to be under genetic control (Gerloff & Gabelman, 1983). Quite the contrary, RDM/SDM ratio diminished about twice when P was applied, but was not altered by cultivar effects for concentrations of 1.0 mmol L-1 P. These results are, in general, in agreement
Table 1 - Effect of three P concentrations on shoot [P], root (RDM) and shoot (SDM) dry matter for eight grain sorghum hybrids.
†C, Criollo; S, Sefloarca; H, Himeca; P, Pioneer; W, Wac.
+Values within a column followed by a common letter are not different at the 0.01 level according to Tukey test.
**Significant at the 0.01.
Shoot [P], g kg-1 RDM, g plant-1 SDM, gplant-1
Hybrid† 0 0.5 1.0 sig 0 0.5 1.0 sig 0 0.5 1.0 sig
--- mmol L-1
---C-1 1.70 a+ 10.20 a 11.53 bc ** 0.57 b 0.39 b 0.42 a ** 0.90 b 2.28 a 1.89 a **
C-8 1.43 a 9.20 ab 12.87 a ** 0.37 c 0.57 b 0.40 a ** 0.77 c 2.32 a 2.04 a **
S-7 2.03 a 9.70 a 10.60 cd ** 0.59 b 0.41 b 0.29 a ** 1.48 a 2.19 b 1.73 a **
S-10 1.77 a 10.00 a 10.97 bc ** 0.45 b 0.33 c 0.32 a ** 0.96 b 1.79 b 1.86 a ** H-101 1.70 a 9.70 a 11.10 bc ** 0.92 a 0.81 a 0.46 a ** 1.88 a 2.77 a 1.91 a **
H-303 1.83 a 8.50 b 10.23 d ** 0.64 b 0.43 b 0.39 a ** 1.34 a 1.98 b 1.71 a **
P-YSB83 1.57 a 10.00 a 12.00 ab ** 0.42 b 0.27 d 0.24 a ** 1.05 b 1.68 b 1.50 a ** W-8228-Br 1.50 a 8.20 b 11.50 bc ** 0.60 b 0.52 b 0.47 a ** 1.37 a 2.03 b 1.87 a **
Table 2 - Effect of three P concentrations on total dry matter (TDM), RDM/SDM ratio, and plant height (PH) for eight grain sorghum hybrids.
†C, Criollo; S, Sefloarca; H, Himeca; P, Pioneer; W, Wac.
+Values within a column followed by a common letter are not different at the 0.01 level according to Tukey test.
**Significant at the 0.01 level; NS: not significant.
TDM, g plant-1 RDM/SDM PH, cm
Hybrid† 0 0.5 1.0 sig 0 0.5 1.0 sig 0 0.5 1.0 sig
--- mmol L-1
---C-1 1.47 b+ 2.65 b 2.31 a ** 0.62 a 0.17 b 0.22 a ** 19 ab 25 a 23 a **
C-8 1.14 c 2.89 a 2.44 a ** 0.48 b 0.25 a 0.20 a ** 16 b 23 a 23 a **
S-7 2.07 a 2.60 b 2.01 a ** 0.40 b 0.19 a 0.17 a ** 21 a 24 a 25 a **
S-10 1.41 b 2.12 b 2.18 a ** 0.47 b 0.18 a 0.17 a ** 19 ab 24 a 25 a **
H-101 2.79 a 3.58 a 2.37 a ** 0.50 b 0.29 a 0.24 a ** 21 a 26 a 24 a **
H-303 1.98 a 2.42 b 2.10 a NS 0.48 b 0.22 a 0.23 a ** 21 a 25 a 24 a **
P-YSB83 1.64 b 1.98 c 1.74 a NS 0.37 c 0.15 b 0.17 a ** 21 a 26 a 25 a **
with the observations of Lynch et al. (1991) and Gourley et al. (1993), showing that P application reduces the RDM/SDM ratio. It seems reasonable to infer that P absorption under P deficiency conditions should be favored in part by a RDM/SDM ratio greater than 0.30.
Effect of P on plant height - Lack of P substantially reduced plant height, with Criollo-8 having a much lower performance than the other seven hybrids (Table 2). Conversely, plant height was higher for medium and high solution [P]s, but was not altered by hybrid effects. Van Iersel et al. (1999) reported that increasing P in the nutrient solution resulted in an increase in stem length
of Catharanthus roseus L.
Any interpretation of P application effects on the growth and development of the plants must be associated to the P effect on the phytohormone balance (Marschner, 1986). Thus, high levels of cytokinin relative to auxin lead to the formation of shoots (Fosket, 1994). The synthesis and export of cytokinin are affected by P supply, although this effect is somewhat less prominent than in the case of N applications (Salama & Wareing, 1979). Under nitrogen and phosphorus deficiencies, the low levels of endogenous cytokinins found in birch seedlings suggest that the growth rates might be limited by the availability of these growth substances under these conditions (Horgan & Wareing, 1980). Both primary and secondary growths are associated with zones in which cells are rapidly dividing (Taiz & Zeiger, 1991) and cytokinin has been indicated as a possible primary plant cell division hormone (Fosket, 1994). By joining the results of this research to those of the literature, we can think that the effect of P on plant- height may be a cytokinin-mediated effect.
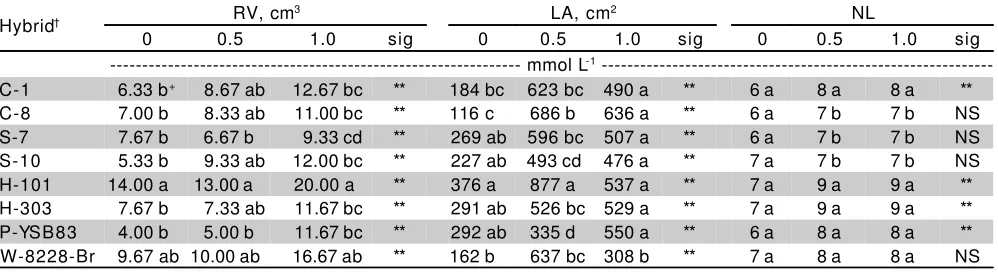
Effect of P on root morphology - For any solution [P] level, both Himeca-101 and Wac had achieved maximum values of RV, but in absolute terms it appeared that Himeca-101 showed best behavior (Table 3). Sefloarca-7 had relatively lower RV than the other cultivars for all three P levels. High RV has been used to identify corn genotypes with great yields (Musick et al., 1965) and this
characteristic is an indication of the greater ability to explore a larger volume of soil or to have thicker roots (Nour & Weibel, 1978). Besides that, when root growth is more vigorous there is a reduction in the “total diffusion distances” by an increased root volume, a greater soil volume is occupied and phosphates in the soil are taken up more easily (Bergmann, 1992).
In this study, Himeca-101 and Wac presented the best behavior, both under deficiency and sufficiency conditions of phosphorus. Thus, these genotypes could be studied in acid soils where P deficiency is an important growth-limiting factor for most crops. Cultivars which can rapidly establish long extensive seedling root systems on the basis of root volume may have a better seedling emergence and establishment because their roots are able to rapidly penetrate the upper soil layers and continue P uptake, thus avoiding low-P stress.
Number of leaves and leaf area - Only the lowest P level reduced the final number of leaves, but differences among hybrids were not observed (Table 3). For the 0 P level, the final number of leaves varied between 6 and 7. The ranking of genotype number of leaves was the same at 0.5 and 1.0 mmol L-1.Both Himeca 101 and 303, consistently produced the greatest number of leaves for medium and high [P]s, but without any differences as compared to Criollo-1, Pioneer and Wac; whereas, Criollo-8 and both Sefloarca 7 and 8,were associated to the worst behavior. On the other hand, number of leaves of Criollo-8, both Sefloarcagenotypes and Wac did not respond to increasing solution [P]s.
From the fact that sorghum cultivars differed in number of leaves, we could state the hypothesis that the effect of P nutrition on leaf appearance depends on the genotype.
Hybrids grown in nutrient solutions without phosphorus substantially reduced LA (Table 3). This result is consistent with earlier studies with diverse plant species (Lynch et al., 1991; Ascencio, 1994; Fernández & Ascencio, 1994; Gutiérrez-Boem & Thomas, 1998). For 0 mmol L-1 P, all sorghum hybrids reduced the LA (45%
Table 3 - Effect of three P concentrations on root volume (RV), leaf area (LA) and number of leaves (NL) for eight grain sorghum hybrids.
†C, Criollo; S, Sefloarca; H, Himeca; P, Pioneer; W, Wac.
+Values within a column followed by a common letter are not different at the 0.01 level according to Tukey test.
**Significant at the 0.01 level; NS: not significant.
Hybrid† RV, cm
3 LA, cm2 NL
0 0.5 1.0 sig 0 0.5 1.0 sig 0 0.5 1.0 sig
--- mmol L-1
---C-1 6.33 b+ 8.67 ab 12.67 bc ** 184 bc 623 bc 490 a ** 6 a 8 a 8 a **
C-8 7.00 b 8.33 ab 11.00 bc ** 116 c 686 b 636 a ** 6 a 7 b 7 b NS
S-7 7.67 b 6.67 b 9.33 cd ** 269 ab 596 bc 507 a ** 6 a 7 b 7 b NS
S-10 5.33 b 9.33 ab 12.00 bc ** 227 ab 493 cd 476 a ** 7 a 7 b 7 b NS
H-101 14.00 a 13.00 a 20.00 a ** 376 a 877 a 537 a ** 7 a 9 a 9 a **
H-303 7.67 b 7.33 ab 11.67 bc ** 291 ab 526 bc 529 a ** 7 a 9 a 9 a **
P-YSB83 4.00 b 5.00 b 11.67 bc ** 292 ab 335 d 550 a ** 6 a 8 a 8 a **
and above) as compared to those of the treatments where P was applied. Although in absolute values, under lack of phosphorus Himeca-101 produced greater LA (376 cm2), this sorghum cultivar did not exhibit significant differences with the hybrids Sefloarca 7 and 10, Himeca-303 and Pioneer.
LA depends on both, NL and the individual leaf area. The former is determined by the rate of leaf appearance and the latter by the rate and duration of leaf expansion (Charles-Edwards et al., 1986; Lynch et al., 1991). Since individual leaf area was very sensitive to P supply (data no shown) and number of leaves was almost not affected by P application (Table 3), it could be speculated that reduced leaf area is primarily associated to reduced leaf expansion, rather than reduced leaf appearance and their morphological determinants. These results are contrary to those presented by Lynch et al. (1991).
Relationships between variables - Table 4 shows the relationships between the following variables: solution P, shoot P, and morphological characteristics, all with dry matter production. All relationships, except for solution P x RDM (r = - 0.38), presented a positive correlation with dry matter. The lowest correlations were found for RDM, all with r ≤ 0.46, but they were significant. Conversely, the highest values were found between SDM and the other variables, but the closest relationships were obtained among SDM and the two following variables: LA (r = 0.85), and PH (r = 0.85). TDM was also positively
correlated (P≤0.01) to LA (r = 0.76) and PH (r = 0.76).
Other correlations are shown in Table 4. These results confirm that RDM is reduced and SDM is enhanced by increasing substrate P concentrations. On the other hand, the positive correlations observed among dry matter yield and other growth characters (PH, LA and NL) may be attributed to the fact that these vegetative characteristics expose the plants to greater light interception and determine the amount of photosynthates available for plant growth and yield (Tenebe et al., 1995).
RDM was better related to LA (r = 0.43) than any morphological variable. Thus, the increased photosynthetically active area enhances the supply of
photosynthates translocated to roots and storage organs; this is a clear evidence for an interdependence between activities of roots and shoots (Salisbury & Ross, 1992). Therefore, P absorption should be controlled in part by activities of the aerial parts. For example, good correlations were observed between the shoot growth and: solution P (r = 0.70) and shoot P (r = 0.73) (Table 4).
Table 4 also shows that PH was a poor indicator for RDM production (r = 0.26). However, it was the best variable, together with LA to predict SDM (r = 0.85) and TDM (r = 0.76) yields. For corn, some studies have concluded that PH is a good indicator to predict TDM production (Camacho & Caraballo, 1994). On the other hand, the low coefficients of correlation found between RV and dry matter production could have been caused by using pots insufficiently deep to allow full expression of the character; however, RV was positively correlated (P≤ 0.01) to SDM (r = 0.49), TDM (r = 0.52) and at P ≤
0.05 to RDM (r = 0.30).
REFERENCES
ASCENCIO, J. Acid phosphatase as a diagnostic tool. Communications in Soil Science and Plant Analysis, v.25, p.1553-1564, 1994.
ASHER, C.J.; LONERAGAN, J.F. Response of plants to phosphate concentration in solution culture: I. Growth and phosphorus content. Soil Science, v.103, p.225-233, 1967.
ATKINSON, D. Some general effects of phosphorus deficiency on growth and development. New Phytologist, v.61, p.101-111, 1973.
BARBER, S.A. Growth requirements for nutrients in relation to demand at the root surface. In: HARLEY, J.L.; RUSSEL, R.S. (Ed.) The soil-root interface. New York: Academic Press, 1979. p.5-20.
BERGMANN, W. Nutritional disorders of plants: development, visual and analytical diagnosis. Jena: Gustav Fischer, 1992. 741p.
BIELESKI, R.L.; FERGUSON, L.B. Physiology and metabolism of phosphate and its compounds. In: PIRSON, A.; ZIMMERMANN, M.H. (Ed.) Encyclopaedia of plant physiology. New York: Springer-Verlag, 1983. v.15, p.422-449.
BOHM, W. Methods of studying root system. Berlin: Springer-Verlag, 1979. 188p.
CAMACHO, R. Avaliação do estado nutricional do fósforo de genótipos de sorgo granífero (Sorghum bicolor L. Moench). Piracicaba, 1996. 110p. Tese (Doutorado) - Escola Superior de Agricultura “Luiz de Queiroz”, Universidade de São Paulo.
CAMACHO, R.; CARABALLO, D. Evaluation of morphological characteristics in venezuelan maize (Zea mays L.) genotypes under drought stress. Scientia Agricola, v.51, p.453-458, 1994.
CAMACHO, R.; MALAVOLTA, E. Bioevaluation of phosphorus status of grain sorghum. Communications in Soil Science and Plant Analysis, v.30, p.2137-2143, 1999.
CHARLES-EDWARDS, D.A.; DOLEY, D.; RIMMINGTON, G.M. Modelling plant growth and development. Sydney: Academic Press, 1986. DOBERMANN, A.; PAMPOLINO, M.F. Indirect leaf area index measurement
as a tool for characterization rice growth at the field scale. Communications in Soil Science and Plant Analysis, v.26, p.1507-1523, 1995.
FERNÁNDEZ, D.S.; ASCENCIO, J. Acid phosphatase activity in bean and cowpea plants grown under phosphorus stress. Journal of Plant Nutrition, v.17, p.229-241, 1994.
FOSKET, D.E. Plant growth and development: a molecular approach. San Diego: Academic Press, 1994. 580p.
FREEDEN, A.L.; RAO, I.M.; TERRY, N. Influence of phosphorus nutrition on growth and carbon partitioning in Glycyne max.Plant Physiology, v.89, p.225-230, 1989.
GERLOFF, G.C.; GABELMAN, W.H. Genetic basis of inorganic plant nutrition. In: LÄUCHLI, A.; BIELESKI, R.L. (Ed.) Encyclopaedia of plant physiology. New York: New Series Springer-Verlag, 1983. v.15B, p.453-480. GOURLEY, C.J.P.; ALLAN, D.L.; RUSELLE, M.P. Differences in response to
available phosphorus among white clover cultivars. Agronomy Journal, v.85, p.296-301, 1993.
Table 4 - Coefficients of correlation for roots (RDM), shoot (SDM) and total (TDM) dry matter as function of: solution [P], shoot [P], number of leaves (NL) per plant, leaf area (LA) per plant, plant height (PH) and root volume (RV).
**and *Significant at the 0.01 and 0.05 levels, respectively.
Variable RDM SDM TDM
Solution [P] -0.38** 0.70** 0.55**
Shoot [P] 0.46** 0.73** 0.55**
NL 0.31* 0.54** 0.47**
LA 0.43** 0.85** 0.76**
PH 0.26* 0.85** 0.76**
GUTIÉRREZ-BOEM, F.H.; THOMAS, G.W. Phosphorus nutrition effects in wheat response to water deficit. Agronomy Journal, v.90, p.166-171, 1998.
HELDT, H.W.; CHON, C.J.; MARONDE, D.; HEROLD, A.; STANKOVIC, Z.C.; WALKER, D.A.; KRAMINER, A.; KIRK, M.R.; HEBER, J. Role of orthophosphate and other factors in the regulation of starch formation in leaves and isolated chloroplasts. Plant Physiology, v.59, p.1146-1155, 1977.
HORGAN, J.M.; WAREING, P.F. Cytokinins and the growth responses of seedlings of Betula pendula Roth, and Acer pseudoplatanus L. to nitrogen
and phosphorus deficiency. Journal of Experimental Botany, v.31, p.525-532, 1980.
JOHNSON, C.M.; STOUT, P.R.; BROYER, T.C.; CARLTON, A.B. Comparative chlorine requirement of different plant species. Plant and Soil, v.8, p.337-353, 1957.
LINDGREEN, D.T.; GABELMAN W.H.; GERLOFF, G.C. Variability of phosphorus uptake and translocation in Phaseolus vulgaris L. under phosphorus stress. Journal of the American Society for Horticultural Science, v.102, p.674-677, 1977.
LYNCH, J.; LÄUCHLI, A.; EPSTEIN, E. Vegetative growth of the common bean in response to phosphorus nutrition. Crop Science, v.31, p.380-387, 1991.
MALAVOLTA, E.; VITTI, G.C.; OLIVEIRA, S.A. de. Avaliação do estado nutricional das plantas: princípios e aplicações. Piracicaba: Potafos, 1997. 319p.
MARSCHNER, H. Mineral nutrition of higher plants. New York: Academic Press, 1986. 674p.
MARSCHNER, H.; KIRKBY, E.; CAKMAK, I. Effect of mineral nutritional status on shoot-root partitioning of photoassimilates and cycling of mineral nutrients. Boron in Agriculture, v.17, p.14, 1997.
MOHR, H.; SCHOPFER, P. Plant physiology. Berlin: Springer-Verlag, 1995. 629p.
MUSICK, G.J.; FAIRCHILD, M.L.; FERGUSON, V.L.; ZUBER, M.S. A method of measuring root volume in corn (ZeamaysL.). Crop Science, v.5,
p.601-602, 1965. Received July 23, 2001
NELSON, L.E. Phosphorus nutrition of cotton, peanuts, rice, sugarcane, and tobacco. In: KHASAWNEH, F.E.; SAMPLE, E.C.; KAMPRATH, E.J. (Ed.) The role of phosphorus in agriculture. Madison: ASA; CSSA; SSSA, 1980. cap.25, p.693-736.
NOUR, A.; WEIBEL, D. Evaluation of root characteristics in grain sorghum. Agronomy Journal, v.70, p.217-218, 1978.
RADIN, J.W.; EIDENBOCK, M.P. Hydraulic conductance as a factor limiting leaf expansion of phosphorus-deficient cotton plants. Plant Physiology, v.75, p.372-377, 1984.
SALAMA, A.M.S. EI-D.; WAREING, P.F. Effects of mineral nutrition on endogenous cytokinins in plants of sunflower (Helianthus annus L.) Journal of Experimental Botany, v.30, p.971-981, 1979.
SALISBURY, F.B.; ROSS, C.W. Plant physiology. Belmont: Wodsworth, 1992. 682p.
TAIZ, L.; ZEIGER, E. Plant physiology. Redwood City: The Benjamin/ Cummings Publishing, 1991. 565p.
TENEBE, V.A.; YUSUF, Y.; KAIGAMA, B.K.; ASENIME, I.O.E. The effects of sources and levels of phosphorous on the growth and yield of cowpea (Vigna unguiculta (L)Walp) varieties. Tropical Science, v.35, p.223-228, 1995.
VAN IERSEL, M.W.; BEVERLY, R.B.; THOMAS, P.A.; LATIMER, J.G.; MILLS, H.A. Nitrogen, phosphorus and potassium effects on pre and post-transplant growth of salvia and vinca seedlings. Journal of Plant Nutrition, v.22, p.1403-1413, 1999.
![Table 1 - Effect of three P concentrations on shoot [P], root (RDM) and shoot (SDM) dry matter for eight grain sorghumhybrids.](https://thumb-ap.123doks.com/thumbv2/123dok/3714026.1478576/3.612.63.561.574.720/table-effect-concentrations-shoot-shoot-matter-grain-sorghumhybrids.webp)
![Table 4 - Coefficients of correlation for roots (RDM), shoot(SDM) and total (TDM) dry matter as function of:solution [P], shoot [P], number of leaves (NL) perplant, leaf area (LA) per plant, plant height (PH)and root volume (RV).](https://thumb-ap.123doks.com/thumbv2/123dok/3714026.1478576/5.612.61.303.638.737/table-coefficients-correlation-function-solution-perplant-height-volume.webp)
