83
Underemployment and Job Mismatch
in Sub-Saharan Africa
Javier Herrera and Sébastien Merceron
Traditional labor market indicators fail to capture the distinctive characteris-tics of low-income countries and the ways in which markets in those countries adjust. Th e absence of unemployment insurance, the importance of informal sector employment, and the weakness of state regulations, among other factors, reduce the relevance of quantity adjustments (measured by the unemployment rate) in these countries, where changes in the quality of employment seem to play an important role.
No offi cial indicator captures this dimension. Th is chapter tries to fi ll this gap by focusing on the measurement of job mismatch and its consequences on rev-enues in Sub-Saharan Africa. Th e chapter posits that a key element of the adjust-ment of supply and demand is found in changes in the quality of employadjust-ment. Individuals who are members of households that do not have the necessary resources to withstand extended unemployment are forced either to create their own jobs or to accept wage jobs whose remuneration, skills match, social secu-rity, job secusecu-rity, and other features are oft en inferior to the features of the job they previously held. None of the labor market indicators captures this situation. Th e chapter is organized into seven sections. Th e fi rst section describes the limitations of traditional unemployment and underemployment indicators given the characteristics of the labor markets in developing countries in gen-eral and in Sub-Saharan Africa in particular. Th e second section examines the literature on “overeducation” and discusses the measurement of job mismatch. Th e third section presents estimates on the extent of job mismatch and identifi es its determinants. Th e fourth section examines the impact of job mismatch on earnings, both in developed countries and in Sub-Saharan Africa. Th e fi fth sec-tion examines nonwage compensasec-tion for overeducasec-tion and undereducasec-tion. Th e sixth section examines wage downgrading as a pathway out of unemploy-ment and economic inactivity. Th e last section summarizes the main fi ndings and analyzes their implications.
84 URBAN LABOR MARKETS IN SUB-SAHARAN AFRICA
The Inadequacy of Standard Unemployment
Indicators in Sub-Saharan Africa
Although work-related issues are central to economic policy debates and to African households’ concerns, no regional labor market diagnoses had been conducted until recently (see the overview for a review). Th e dearth of regional studies mainly refl ects gaps in primary data. Very few African coun-tries have employment indicators (the International Labour Organization [ILO] LABORSTA database presents unemployment rates for just 10 African coun-tries). Where these indicators do exist, diff erences in operational defi nitions, cov-erage, period, and type of primary source (surveys, censuses) make the indicators hard to compare across countries. As a result, diff erent sources produce con-fl icting diagnoses of employment. For example, the World Development Report 2013: Jobs (World Bank 2013) sets the youth unemployment rate in Sub-Saharan Africa at less than 10 percent, the second-lowest in the world (aft er South Asia). Th e Economic Report on Africa 2005 paints a totally diff erent picture, estimating youth unemployment at about 18 percent (UNECA 2005). Th e ILO’s regional report (ILO 2006) also paints a bleak picture of youth unemployment.
Th ere is a huge gap between the classic measure of unemployment on the one hand and underemployment and the reality of the situation as perceived by households in developing countries, in Africa in particular, on the other. Th e forms of labor market imbalances in Sub-Saharan Africa should no longer be assessed solely on the basis of the level of unemployment and the number of hours worked: the specifi cities of labor markets in Africa call for the use of indicators that address both the quantity and quality of jobs.
Th e unemployment rate in Sub-Saharan Africa, as in many other develop-ing countries, is relatively low, comparable to the rate in developed countries. In addition, despite wide macroeconomic fl uctuations, unemployment rates remain fairly stable. African labor markets thus do not appear to adjust either solely or primarily quantitatively.
Unemployment benefi ts exist in only a few African countries, and earnings levels are relatively low. As a result, during downturns, households depend on other households—something traditional measures do not capture. Th e tradi-tional underemployment indicator shows that the employment problem cannot be characterized by the existence of a large contingent of individuals working fewer hours than the statutory working week. In fact, on average, the number of weekly hours actually exceeds the statutory working week.
If the unemployment and underemployment rates in Sub-Saharan Africa are relatively low and stable, why does employment appear to be one of the main challenges perceived by households? How and through what mechanisms do labor markets adjust in Sub-Saharan Africa?
Serious doubts have been raised about the relevance, accuracy, and compa-rability of the classic indicators of unemployment in Sub-Saharan Africa.1 Th e notion of unemployment as defi ned in the developed countries is not applicable in Sub-Saharan Africa because labor market characteristics there diff er. If the ILO defi nition of unemployment is expanded to include extended unemploy-ment, including discouraged workers (people who are no longer actively seek-ing a job because they fear they will not fi nd one), the unemployment rate in Sub-Saharan Africa rises by half to some 16 percent (see chapter 1).
Unemployment and time-related underemployment rates (using the ILO defi nition) are relatively low in urban Sub-Saharan Africa: in the commer-cial capitals of the countries in the West African Economic and Monetary Union (WAEMU), unemployment averages 11.4 percent and time-related underemployment 14.3 percent (see chapter 1).2 However, polls of households reveal that lack of work is their main problem, and more than 40 percent of employed workers in West Africa report being dissatisfi ed with the job they hold (see chapter 3).
Several particularities of the African economies may explain why the stan-dard unemployment indicator is not a useful measure in Sub-Saharan Africa:
• Th ree-quarters of jobs are concentrated in the informal sector. Th ese jobs typically are highly insecure. Th ey provide no social security coverage and poor working conditions.
• Th e absence of unemployment benefi ts and the predominance of family and social networks in job-seeking alters the approach to prospecting. Job-seeking oft en means getting together enough capital to start up a small informal, own-account business, generally with the help of family and friends.
• Th e scale of unpaid family and child labor makes it hard to distinguish between work and nonwork.
• Education plays a diff erent role in access to employment. Unlike in devel-oped countries, the level of education and the unemployment rate are inversely related in Sub-Saharan Africa (see chapter 5).
• Th e seasonal nature of many jobs in Sub-Saharan Africa raises a reference period problem.
Th ese features of African labor markets make the classic labor market evalu-ation indicators unsuitable. Th ere is a pressing need for better indicators that more fully and accurately cover the reality of African employment problems.
Measures of underemployment do a better job of capturing labor market imbalances. Th ey aim to quantify the number of people who are forced to work fewer hours or take a less skilled job in a less productive economic unit to avoid unemployment and who therefore earn less than they could normally earn (Borgen, Amundson, and Harder 1988; Hecker 1992; ILO 1997).3
86 URBAN LABOR MARKETS IN SUB-SAHARAN AFRICA
Th e 16th International Conference of Labour Statisticians (ILO 1998) decided that underemployment refl ects the underutilization of the productive capacity of the employed population. It is to the labor force what the underuse of capital is to business. Time-related underemployment refl ects the quantity of work rather than its quality.
On average, time-related underemployment remains low in Sub-Saharan Africa: 14.3 percent of employed workers in the WAEMU capitals spend less than 35 hours a week at their main job when they would prefer to work more.4 Another 43 percent of employed workers work more than 48 hours a week (48 percent among informal sector workers).
Th e fi rst limitation of this standard time-related underemployment indicator is that people may work a second job to supplement their main job. Only 5.9 per-cent of workers across the West African capitals hold a second job in addition to their main job, however. Th is low rate explains why including hours worked in the second job does very little to change the rate of time-related underemploy-ment, which falls just 0.1 percent on average across WAEMU (0.2 percent in Cotonou, where the rate of multiple jobholding is at the highest, at 9.2 percent).
This notion of time-related underemployment therefore needs to be expanded to include measures of the quality of the work, characterized by such factors as low hourly earnings, the underutilization of professional skills, and low labor productivity resulting from the misallocation of labor resources or a fundamental imbalance between labor and other factors of production.5 When long hours are made necessary by abnormally low labor productivity or hourly earnings, they may also refl ect invisible underemployment.
Minimum wage regulations are generally not relevant in Sub-Saharan Africa. Measuring invisible underemployment in terms of underpayment calls for hourly income norms by type of occupation, rather than just a legal minimum income that is uniform for all individuals.
Invisible underemployment measures the shortfall in productivity, which can be measured at the worker level: individuals may work at jobs that do not require them to use their skills or human capital (Becker 1975). Profes-sional match analysis compares job quality with individuals’ expectations and characteristics.
Job Mismatch
Job mismatch is the deviation between a worker’s skill level and the level required by the job. It covers two situations. Th e terms skill-related under-employment, downgrading, and overeducation refer to workers who are forced to accept jobs for which they are overqualifi ed or that do not match their skills or training. Th e terms underqualifi cation and undereducation refer to workers
who hold jobs for which they are not qualifi ed enough: in a dysfunctional labor market, applicants may be hired based on their social network rather than their abilities.Both concepts are based on norms that may change over time and space.
Th e Economic Literature on Overeducation
Job mismatch exists in developed economies, where many people have many years of education. In France, for example, nearly one in fi ve employees reported that their education did not match their job in 1996, a consequence of the fl ood of graduates (Bodier and Crenner 1997).
Many economists have addressed overeducation. Freeman (1976), one of the earliest, endeavored to explain the downgrading of graduates in the United States by the oversupply of graduates, challenging the principle of an automatic link between qualifi cations and economic success.
Human capital theory posits that workers are paid commensurate with their level of productivity, which is directly dependent on the level of human capital (education, work experience, training, seniority, skills, and all other unobservable competencies) (Becker 1975). In a fl exible labor market, overeducation would be a purely transitional phase of adaptation, during which individuals need to compensate for their lack of other human capital endowments (that is, the lack of experience of young graduate workers) (Groot 1996). Sicherman (1991) fi nds that overeducated workers change jobs more oft en, suggesting that overeducation is part of a phase of adaptation to the fi rst stages of a career. Rubb (2003a) posits that overeducation may be a short-run phenomenon for individuals but a long-run phenomenon for the economy. Individuals who take a break in their careers, such as women who have children, are more likely to hold a job for which they are overeducated because of their lack of experience (Groot and Maassen van den Brink 2000). Older workers off set their lack of training with more experience.
Th e job competition model (Th urow 1975) posits that an individual’s employability is inversely proportional to the training costs required aft er his or her recruitment. He believes that employers’ decisions to hire one individual over another are dictated by the training costs they will have to pay to make the individual operational. Th e more educated individuals are at the point of hir-ing, the lower these costs will be and the greater their chances of being hired. From this point of view, employers may end up hiring individuals with higher levels of education than strictly required for the position; workers therefore fi nd themselves overeducated for their jobs. Candidates in the queues for each job in an environment of high unemployment have to choose between being unemployed and reducing their reservation wage. Professional downgrading (overeducation) is therefore a defense against unemployment and the deci-sion to remain unemployed a defense against downgrading. Th e lengthening of education is therefore making education an essentially defensive investment to keep one’s place in the queue for the desired job. Overeducation in this model
88 URBAN LABOR MARKETS IN SUB-SAHARAN AFRICA
is therefore associated more with macroeconomic circumstances and long-run disequilibria than the human capital life cycle.
Empirical research in developed countries has shown that overeducated individuals earn more than their counterparts with appropriate qualifi cations doing the same job but less than similarly educated individuals employed in jobs for which they are not overqualifi ed (Sicherman 1991; Cohn and Khan 1995; Verdugo and Verdugo 1989; Groot and Maassen van den Brink 2000). As Rubb (2003b p. 621), notes, “On average, the literature fi nds that the premium paid for overeducation is about equal to the penalty for undereducation, but lower than the returns associated with an increase in required education.”
Very little research has been conducted in developing countries, especially Africa, on job mismatch and overeducation. Th e only empirical studies are by Simon and Stark (2007) on overqualifi cation as a result of international migra-tion, by Herrera (2005) on Peru, and by Esteves and Martins (2007) on Brazil.
Measuring Job Mismatch
Th e literature identifi es four main ways of measuring the level of education required for a given job (and therefore overeducation and undereducation) (Hartog 2000). “Subjective” methods are based on workers’ self-assessment. “Objective” methods are based on experts’ job analysis or realized matches.6 Realized matches measure the diff erence between the education attained and the dominant level of education observed for the studied worker’s occupation. It can be defi ned in terms of years of education (a method developed by Clogg [1979] and Clogg and Shockey [1984], called the Clogg indicator) or education levels (an approach developed by de Grip, Borghans, and Smits [1998], called the de Grip indicator). Individuals are overeducated if the number of years (level) of education is greater than or equal to the central value that defi nes the norm. Individuals have an inadequate match if the observed number of years of education is more than one standard deviation from the mean or two standard deviations from the median number of years of education observed in the occupation for the reference population. In the case of education lev-els, the norm is defi ned in terms of the dominant level of education for each occupation.7
Each method has advantages and drawbacks. Self-assessment by workers has the advantage of providing education norms directly at the local level. However, individuals tend to subjectively infl ate the level required for their job and over-estimate the level of their position.
Th e choice of method is dictated above all by the availability of data. Many authors rely on experts’ analysis of job qualifi cations, which provides an objec-tive, clear, and fairly unbiased measurement of the levels of education required by fi rms for a given position. No such evaluations exist in developing coun-tries. Th e method based on realized matches yields the balance between labor
supply and demand; it does not measure the level of education required by fi rms (Hartog 2000). In general, endogenous measurements based on the gen-eral trend (such as the modal, median, and mean values) do not refl ect each job’s required level of education when the economy (or sector) is in a situation of underemployment or overemployment (ILO 1997).
Constructing a Job Mismatch Indicator
Th e compilation of surveys conducted in the capitals of nine African countries covering more than 100,000 people allows for the fi rst-ever large-scale estima-tion of empirical educaestima-tional norms at a detailed (three-digit) occupaestima-tional clas-sifi cation level and a robust deduction of the job mismatch level and profi les. Th e data come from the 1-2-3 surveys conducted in seven West African countries (Benin, Burkina Faso, Côte d’Ivoire, Mali, Niger, Senegal, and Togo) between 2001 and 2002; in the administrative capital (Yaoundé) and economic capital (Douala) of Cameroon (2005); and in the capital of Madagascar (Antanana-rivo 2001–04).8 Th e questionnaires used were identical, and the same collection methodology, data processing, and variable coding were used to facilitate their compilation and consolidate the estimates.
Th e economic and monetary integration of the WAEMU countries studied guarantees strong homogeneousness within the population concerned, worker mobility in the region, and, therefore, the relevance of the norms and indicators developed throughout the region in this study. It allows analysis of questions regarding the impact of the job mismatch on earnings.
Th e focus in this chapter is on employed workers 15 and older living in urban areas. However, it is useful to restrict the reference population to adults old enough to have fi nished their schooling (that is, people 25–44). Th e restricted sample includes 18,000 paid workers, representative of about 3.6 million people aft er weighting. Th e occupations are aggregated into 70 categories covering all the jobs on the labor market in the cities concerned.
Th e realized matches method was used to measure overqualifi cation or underqualifi cation by profession (that is, the distribution of levels of education by occupation was used to estimate an endogenous qualifi cation norm for each of the professions). Doing so entailed fi rst estimating the reference qualifi cation norm for each type of profession. Th e overqualifi cation indictor is measured by the proportion of workers with a qualifi cation level greater than the normative threshold estimated for the profession concerned.
Estimating the Extent of Job Mismatch
For all professions and all cities together, 14.8 percent of workers 15 and older are undereducated based on Clogg’s continuous indicator (25.0 percent based
90
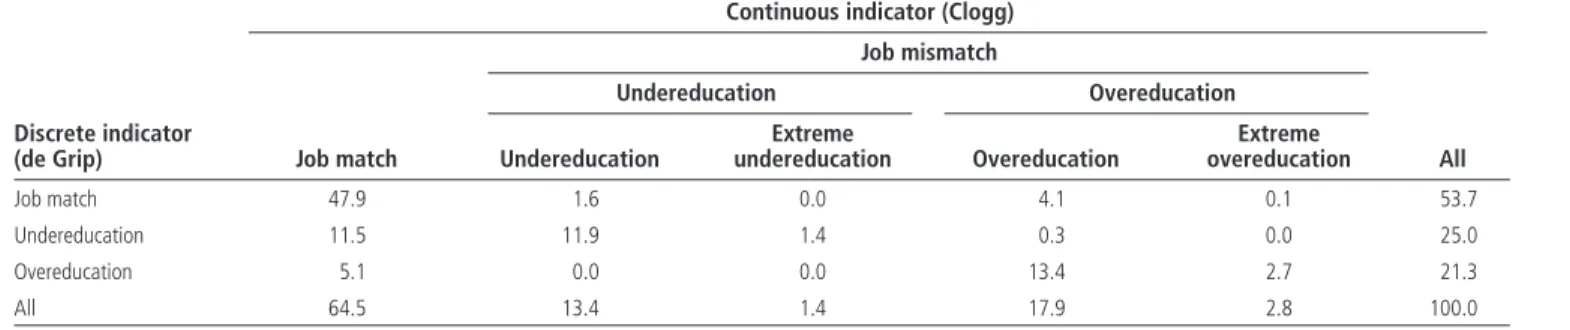
Table 2.1 Clogg and de Grip Measures of Job Mismatch in 10 Cities in Sub-Saharan Africa
(percent)
Discrete indicator (de Grip)
Continuous indicator (Clogg)
Job match Job mismatch All Undereducation Overeducation Undereducation Extreme undereducation Overeducation Extreme overeducation Job match 47.9 1.6 0.0 4.1 0.1 53.7 Undereducation 11.5 11.9 1.4 0.3 0.0 25.0 Overeducation 5.1 0.0 0.0 13.4 2.7 21.3 All 64.5 13.4 1.4 17.9 2.8 100.0
Sources: Based on Phase 1 of the following 1-2-3 surveys: Cameroon 2005 (Développement, Institutions et Mondialisation [DIAL] and National Statistics Institute [NSI]); Democratic Republic of Congo 2005 (DIAL and NSI); Madagascar 2001 (DIAL and Institut National de la Statistique [INSTAT]); West African Economic and Monetary Union (WAEMU) 2001/02 (Observatoire économique et statistique d’Afrique Subsaharienne [AFRISTAT], DIAL, and NSI).
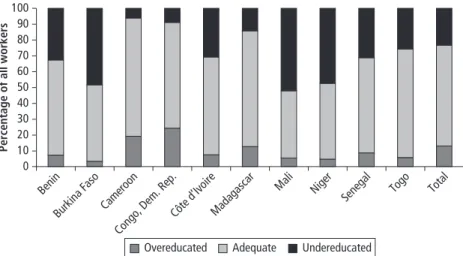
Figure 2.1 Incidence of Job Mismatch (Clogg Indicator) for 10 Countries in Sub-Saharan Africa
Sources: Based on Phase 1 of the 1-2-3 surveys of selected countries (see table 2.1 for details).
0 10 20 30 40 50 60 70 80
Percentage of all workers
90 100
Benin
Burkina Faso Cameroon Côte d’IvoireMadagascar
Mali Niger
Congo, Dem. Rep.
Senegal Togo Total
Overeducated Adequate Undereducated
on de Grip’s discrete indicator) (table 2.1). Th e share of the labor force that is overeducated is 20.7 percent based on the continuous indicator and 21.3 per-cent based on the discrete indicator. For developed countries, Groot (1996) estimates undereducation at 21.8 percent and overeducation at 16.0 percent, Cohn and Khan (1995) estimate undereducation at 12 percent and overeduca-tion at 13 percent, and Verdugo and Verdugo (1989) estimate undereducaovereduca-tion at 9.9 percent and overeducation at 10.9 percent. A meta-analysis of the litera-ture reveals an average incidence of 14.4 percent for undereducation and 23.3 percent for overeducation in Western Europe and the United States (Groot and Maassen van den Brink 2000). Th e estimate for Sub-Saharan Africa using the Clogg method is similar.9
Th e Clogg and de Grip measures of overeducation are similar (20.7 per-cent and 21.3 perper-cent of occupied individuals). A larger discrepancy is evident in undereducation, where the indicators diff er by about 10 percentage points (14.8 percent according to Clogg’s indicator, 25.0 percent according to de Grip’s indicator). Th e correlation coeffi cient between the two indicators is 0.77, which means that both indicators capture the phenomenon fairly well.10
Th e Clogg continuous indicator is more restrictive in its job mismatch mea-surement than the discrete indicator (fi gure 2.1). It estimates that 64.5 percent of people hold jobs that match their level of education. Th e de Grip measure estimates this fi gure at 53.7 percent.
92 URBAN LABOR MARKETS IN SUB-SAHARAN AFRICA
Identifying the Determinants of Job Mismatch
A multivariate nonlinear econometric model is used to identify the eff ect of each explanatory variable on job mismatch aft er controlling for bivariate eff ects caused by the other explanatory variables observed. Th e specifi cation of a mul-tinomial or ordered logit model seemed most appropriate, because it can simul-taneously estimate the probability of overeducation and undereducation. Th e choice of an ordered or unordered model depends on the type of dependent variable and whether there is a possibility of ranking the variable’s categories. As there is no unequivocal order between the dependent variable’s categories, an unordered model is used here.11
Th e explanatory variables in the model cover individual characteristics, household characteristics, and characteristics of the business and the job held. Th e dependent variable is Clogg’s continuous indicator. It was chosen in order to reduce the risk of endogeneity in the model introduced by the presence of qualitative education variables as explanatory variables (education dummy vari-able). Th is education variable sharply increases the model’s explanatory power and reveals that the probability of being overeducated increases with the level of education.12
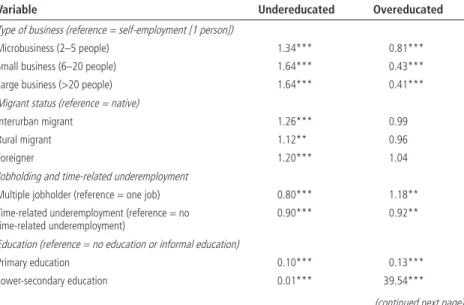
Table 2.2 presents the results of the multinomial model. In most cases, a sig-nifi cant variable for overeducation (such as the size of the business in which the
Table 2.2 Job Mismatch Modeling Results for 10 Cities in Sub-Saharan Africa
(multinomial logit model)
Variable Undereducated Overeducated
Type of business (reference = self-employment [1 person])
Microbusiness (2–5 people) 1.34*** 0.81***
Small business (6–20 people) 1.64*** 0.43***
Large business (>20 people) 1.64*** 0.41***
Migrant status (reference = native)
Interurban migrant 1.26*** 0.99
Rural migrant 1.12** 0.96
Foreigner 1.20*** 1.04
Jobholding and time-related underemployment
Multiple jobholder (reference = one job) 0.80*** 1.18**
Time-related underemployment (reference = no time-related underemployment)
0.90*** 0.92**
Education (reference = no education or informal education)
Primary education 0.10*** 0.13***
Lower-secondary education 0.01*** 39.54***
Upper-secondary education 0.01*** 346.92***
Higher education 0.01*** 726.20***
Position in household (reference = head of household)
Head of household’s spouse 1.01 1.04
Secondary household member 0.88*** 1.06
Marital status and gender
Couple (married or unmarried)(reference = single) 0.70*** 1.04
Male (reference = female) 1.38*** 1.21***
Sector (reference = secondary sector)
Tertiary sector 1.80*** 0.93
Primary sector 1.89*** 1.28***
Sector (reference = public sector)
Informal sector 0.86 1.48***
Formal private sector 0.83* 1.23***
Age Age 0.97*** 1.07*** Age squared 1.001*** 0.999*** Cohort (reference = 50+) Young cohort (10–29) 0.81** 1.01 Medium cohort (30–49) 0.98 1.03
Religion (reference = other)
Christian 0.41*** 2.33***
Muslim 0.43*** 2.67***
Seniority in the business
Seniority in the business 1.00 0.99***
City (reference = aggregate of Douala and Yaoundé)
Abidjan 1.61*** 0.53*** Antananarivo 7.19*** 0.41*** Bamako 1.54*** 0.38*** Cotonou 1.94*** 0.47*** Lomé 0.87 0.93 Niamey 1.47*** 0.33*** Ouagadougou 1.16 0.49*** Constant 1.60 0.001 Number of observations 61,984 61,984
Sources: Based on Phase 1 of the 1-2-3 surveys of selected countries (see table 2.1 for details).
Note: Figures are for working individuals 10 and older. Dakar was dropped because of collinearity.
* significant at the 10 percent level, ** significant at the 5 percent level, *** significant at the 1 percent level.
Table 2.2 (continued)
94 URBAN LABOR MARKETS IN SUB-SAHARAN AFRICA
individual works) is also signifi cant for undereducation. A “confusion matrix” is used to evaluate the quality of the model by comparing the predicted values with the true values of the indicator. Th e correct classifi cation rate—the ratio of the number of correct predictions to the sample size—is 74 percent.13
Several fi ndings emerge from the data in table 2.2:
• Th e probability of being overeducated (undereducated) increases (decreases) as the level of education increases (decreases). Th e higher a worker’s quali-fi cations, the greater his or her risk of being overqualiquali-fi ed for the job he or she holds.
• Internal migrants have a greater probability than nonmigrants of holding a job that requires more education than they have. Th e fact that on aver-age they are less educated than the native population probably refl ects their lower access to the education system, despite recent decentralization and deconcentration eff orts in most African countries.
• Foreign migrants also have a higher probability of being undereducated: the role of social capital (social and community networks of migrants living in the country’s main city) appears to come into play here. Moreover, a selec-tion bias exists for migrants: other unobservable characteristics explain the fact that for a given level of education, migrants are more likely to occupy jobs that require education levels higher than those they have attained. We fi nd no statistically signifi cant support to the stylized fact posited by Simon and Stark (2007) that overeducation in developing countries is the result of international migration.
• Members of the oldest cohort are more likely to be undereducated than mem-bers of younger cohorts, because the qualifi cation norms (level of education) for a given occupation were lower when they entered the labor market.
• Aft er controlling for cohort eff ects (and therefore diff erential access to edu-cation by generation), age increases the chances of being overeducated, in a nonlinear manner (both age and age squared are signifi cant). As age is closely related to potential experience, it may be individuals’ potential expe-rience (and not age) that positively infl uences the probability of being over-educated. Th is paradoxical result would tend to invalidate the stylized fact noted by Sicherman (1991) and Freeman (1976) that individuals become overeducated in order to compensate for the lack of human capital endow-ments, such as experience and training. What is being measured here is the age eff ect within a cohort (age bracket); the cohort eff ect is wholly in line with human capital theory.
• Working in the informal sector increases the chances of being overeducated. Th is fi nding can be explained by the fact that the informal sector does not off er suffi ciently skilled work because of lack of access to technology and capital.
• Men have a higher probability than women of being undereducated or overeducated.
• Overeducation is positively correlated with job dissatisfaction. Th is fi nd-ing comes not from the estimation of the multinomial model but from the simple study of the coeffi cient for the correlation between the dichotomous overeducation variable and the variable covering job satisfaction as reported by the individual. Th e correlation (0.18) is positive. Th e job satisfaction vari-able is not introduced into the model as an explanatory varivari-able because of the high risk of endogeneity: although overqualifi cation can clearly generate job dissatisfaction, job dissatisfaction (measured by the desire to change a job) can infl uence the probability of a job mismatch.
Having a high level of education, being a man, and belonging to a young cohort are correlated with overeducation; having a low level of education, being a migrant, being a woman, and working in a very small business are correlated with undereducation.
Impacts of Job Mismatch: Premium or Penalty?
Does wage or nonwage compensation exist for job mismatch? Are overedu-cated individuals paid more or less than matched individuals, aft er control-ling for the eff ects of other individual characteristics? Do they have more stable jobs?
Impact of Job Mismatch on Earnings in Developed Countries
Human capital is defi ned as the stock of productive capacities an individual acquires (through the accumulation of general and specifi c knowledge, know-how, and so forth) (Becker 1975). Investment in human capital is an individual choice resulting from the cost-benefi t trade-off between the costs (out-of-pocket cost of education and opportunity cost of going to school rather than working) and the future discounted earnings that can be generated by additional educa-tion. Individuals may choose to invest in order to raise their future productivity and therefore their earnings. Human capital theory assumes that individuals are paid in accordance with their productivity level at work and that this marginal productivity is determined more by the components of human capital (educa-tion, training, experience, skills, and so forth) than by the characteristics of the job (Mincer 1974; Becker 1975).
Becker posits that wage growth over a career more or less refl ects the accu-mulation of human capital. He believes it to be concave: gross investment tends to decline with age, because any wage increase raises the opportunity cost and the return diminishes with age, because there are fewer years available in which
96 URBAN LABOR MARKETS IN SUB-SAHARAN AFRICA
to make the investment pay off . Th us, from a human capital point of view, the rates of return on investment in education are expected to be positive: the more an individual has studied, the higher his or her earnings.
Th e results of 11 studies on diff erent countries reviewed by Card (2001) suggest that the marginal returns to education estimated by the instrumental variables method were 6–10 percent. As with any investment, the returns to education diminish: the more an individual studies, the smaller the margin gain in earnings for each additional year of studies. Kuépié, Nordman, and Roubaud (2009; see also chapter 5 of this book) invalidate this assumption for Sub-Saharan Africa, fi nding that private returns to education are convex for workers in the West African capitals. Spence (1973) notes that, as human capital is hard for others to perceive, qualifi cations form a credible signal of the worker’s level of productivity for an employer in a situation of informa-tion asymmetry. Wages in this case are essentially contingent upon the level of qualifi cations.
Impact of Job Mismatch on Earnings in Sub-Saharan Africa
Individual earnings are modeled to identify the eff ect of overeducation and undereducation on the level of earnings, controlling for the classic explanatory eff ects. For this purpose, Mincer’s model can be extended as follows:
lnYs = c + rS + aE + bE2 + ∑d
iXi + f1. UNDER + f2 OVER + u (2. 1) where the Xi cover observable demographic characteristics (gender, ethnic
group, religion, migratory status, father’s socioeconomic group); OVER is a dummy variable taking the value 1 if the individual is overeducated for the job he or she holds and 0 if not; and UNDER is a dummy variable taking the value 1 if the individual is undereducated for the job he or she holds and 0 if not.
Th e estimations of lnY based solely on observed earnings therefore need to take selection bias into account (Heckman 1979). Aft er estimating a selection model (on the probability of working a paid job), we incorporate the Mills ratio into the earnings models to correct for selection bias.
Use of the standard ordinary least squares method is potentially problematic when estimating returns to education (and therefore returns to overeducation), because of the endogenous nature of education (that is, its correlation with the earnings equation residuals because of unobservable individual characteristics). In principle, this endogeneity can be overcome using the instrumental variable procedure, which consists of fi nding variables that are assumed to be correlated with education but not earnings. In practice, no convincing instrument (that had not already been used as an explanatory variable in the model) was found. Earnings Model 1 proposes inserting job mismatch (undereducation and overeducation) dummy variables into Mincer’s equation. Th is log-linear regression model of hourly earnings is initially tested on all adults 25–44. Two
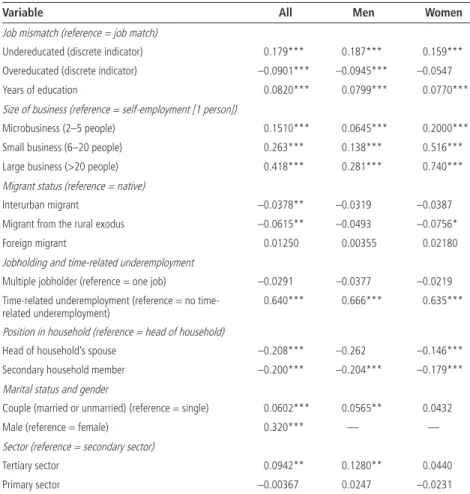
additional estimations are made, for men and for women (table 2.3). Th e model yields the following results:
• A (small) penalty for overeducation and a premium for undereducation is evi-dent aft er controlling for the level of education and selection biases. Overedu-cated individuals earn more than individuals in the same occupation with an appropriate level of education for the job, but they earn less than individuals with the same level of education working in better jobs. Th e penalty or pre-mium associated with the job mismatch is smaller among women than men.
Table 2.3 Heckman-Corrected Mincerian Earnings Equation with Overeducation and Undereducation Variables for Men and Women in 10 Cities in Sub-Saharan Africa
(log of hourly earnings)
Variable All Men Women
Job mismatch (reference = job match)
Undereducated (discrete indicator) 0.179*** 0.187*** 0.159***
Overeducated (discrete indicator) –0.0901*** –0.0945*** –0.0547
Years of education 0.0820*** 0.0799*** 0.0770***
Size of business (reference = self-employment [1 person])
Microbusiness (2–5 people) 0.1510*** 0.0645*** 0.2000***
Small business (6–20 people) 0.263*** 0.138*** 0.516***
Large business (>20 people) 0.418*** 0.281*** 0.740***
Migrant status (reference = native)
Interurban migrant –0.0378** –0.0319 –0.0387
Migrant from the rural exodus –0.0615** –0.0493 –0.0756*
Foreign migrant 0.01250 0.00355 0.02180
Jobholding and time-related underemployment
Multiple jobholder (reference = one job) –0.0291 –0.0377 –0.0219
Time-related underemployment (reference = no time-related underemployment)
0.640*** 0.666*** 0.635***
Position in household (reference = head of household)
Head of household’s spouse –0.208*** –0.262 –0.146***
Secondary household member –0.200*** –0.204*** –0.179***
Marital status and gender
Couple (married or unmarried)(reference = single) 0.0602*** 0.0565** 0.0432
Male (reference = female) 0.320*** — —
Sector (reference = secondary sector)
Tertiary sector 0.0942** 0.1280** 0.0440
Primary sector –0.00367 0.0247 –0.0231
98 URBAN LABOR MARKETS IN SUB-SAHARAN AFRICA
• Th e penalty for overeducation and the premium for undereducation do not off set each other: undereducation is much more profi table than overeduca-tion is costly (in the log-linear model, the parameter corresponding to over-education is twice as high in absolute value as the parameter corresponding to the undereducation dummy variable). Th is fi nding is diff erent from what Groot and Maassen van den Brink (2000) report for developed countries
• Th e penalty (premium) for overeducation (undereducation) is smaller than the returns to high levels of education. Th e returns to education are positive and high (8 percent), for both women and men.
Th e model was also estimated using the number of surplus (defi cit) years of education the individual has above (below) the norm for the years of educa-tion required for the occupaeduca-tion (Model 2 [not shown]). Th is model allows estimation of the returns to years of overeducation. Th e results confi rm that the returns to required education are positive and large: one additional year Sector (reference = public sector)
Informal sector –0.352*** –0.308*** –0.454***
Formal private sector –0.181*** –0.155*** –0.227**
Age
Age 0.0328 0.0341 0.0215
Age squared –0.000348 –0.000310 –0.000244
Religion (reference = other)
Christian 0.0129 –0.0145 0.0278
Muslim 0.0553* 0.0444 0.0491
Seniority in the business
Seniority in the business 0.0199*** 0.0182*** 0.0202***
Selection model: Probability of participation
Cohabiting couple (married or unmarried) (reference = single)
0.313*** 0.349*** 0.207***
Age 0.0281*** 0.0267*** 0.0266***
Male (reference = female) –0.109*** — —
Number of earners in household 0.571*** 0.540*** 0.651***
Number of children in household 0.0514*** 0.0323** 0.0860***
Total number of people in household (excluding visitors) –0.166*** –0.157*** –0.183***
Constant –3.324*** –0.173 –0.157
Sources: Based on Phase 1 of the 1-2-3 surveys of selected countries (see table 2.1 for details).
Note: Figures are for working individuals 25–44.
* significant at the 10 percent level, ** significant at the 5 percent level, *** significant at the 1 percent level.
Table 2.3 (continued)
of required education (which enables the worker to hold a job demanding one more year of schooling) generates a 10.1 percent increase in the hourly earn-ings logarithm, for both men and women. Each year of education beyond the required schooling norm for the occupation generates additional earnings (by 6.2 percent in the hourly earnings logarithm); each year of education short of the normal length of schooling for the occupation decreases earnings (by 5.1 percent in the hourly earnings logarithm). Th e return to years of overeduca-tion is thus positive but lower than the return to years of required educaovereduca-tion. As in Model 1, undereducated individuals earn a premium over their colleagues in the same occupation with the level of education required for the job. Model 2 erases the asymmetry revealed in Model 1 between the overeducation penalty and the undereducation premium: the results for the two components are simi-lar in Model 2. By way of comparison, the meta-analysis conducted by Groot and Maassen van den Brink (2000) estimates the average returns to one year of overeducation in developed countries at 3 percent.
Th e results of the two models bear out the results of Verdugo and Verdugo (1989), Groot (1996), and Hartog (2000) for developed countries: overeduca-tion generates a penalty and undereducaovereduca-tion a premium once the eff ects of required education, selection biases, and other sociodemographic variables are controlled for.
Underemployment and Nonwage Compensation
In developed countries, nonwage benefi ts oft en compensate individuals who are overeducated for the position they hold (for a discussion of compensating diff erential theory, see chapter 4). Th is section examines whether nonwage com-pensation exists in Sub-Saharan Africa in the form of increased job security.
Insecurity (the risk of losing one’s job) can be measured across an array of variables refl ecting the extent of formality linking employee to employer: the existence or absence of a written contract that protects the employee; the existence of a payslip; social security coverage; the steady or unsteady nature of the work done (casual, temporary, or steady); access to a union; and so forth. Th e choice of components for this indicator was determined by the availability of data.
Workers are classifi ed as dependent (wage-earners) or independent (own account, managers, and employers). Th e insecurity score for dependent work-ers is the arithmetic sum of the values of three variables: contract (long-term written contract, short-term written contract, oral contract, no contract); pay-slip; and steadiness (steady, casual, or temporary). For independent workers, the presence of written accounts captures the extent of the business’s formality (and therefore its sustainability). Apprentices were excluded from the analysis.
100 URBAN LABOR MARKETS IN SUB-SAHARAN AFRICA
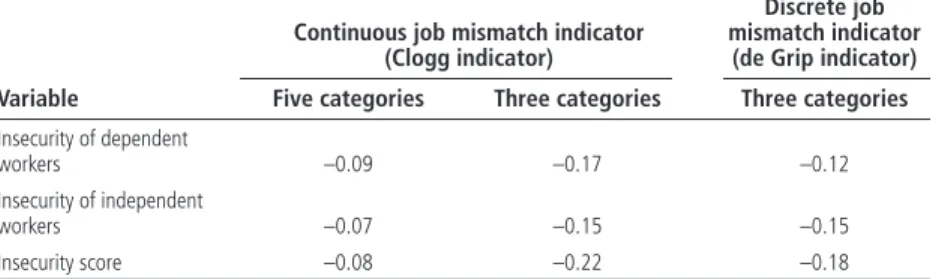
Th e job mismatch indicators (Clogg’s continuous indicator covering three to fi ve categories and de Grip’s discrete indicator covering three categories) and the insecurity score are negatively correlated.14 Th is correlation suggests that overeducated workers are indeed compensated with greater job security (table 2.4).
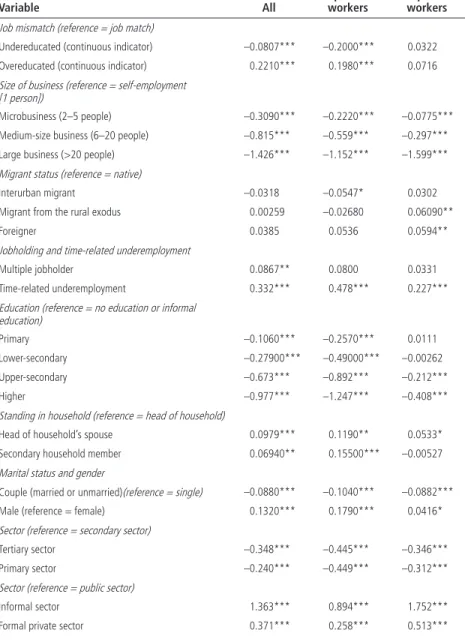
To analyze the net eff ects of job mismatch on insecurity (by controlling for other infl uential variables), it would be preferable to conduct an ordered multinomial logistic regression (because the score values are discrete, whole, and ordered). However, the number of categories in this score (six) makes the analysis and interpretation tricky and the conclusions hazy. For this reason, a simple linear regression of the insecurity score on the classic explanatory vari-ables (from the corrected Mincer equation) and the overeducation and under-education dummy variables (measured by the Clogg continuous indicator, for example) using the ordinary least squares (OLS) method is presented (table 2.5). It would have been desirable to address the possible endogeneity of the job mis-match in the explanation of the level of insecurity using an instrumental variable procedure, but no instrument was found to be conclusive.
Given the construction of the insecurity indicator, it appears preferable to concentrate on a split (dependent/independent) interpretation of the results. Th e results of the regression model show that for dependent workers, other things equal, the insecurity score (and hence the level of job insecurity) increases with overeducation and decreases with undereducation. Th is result means that aft er controlling for the level of completed education (in particu-lar), the level of job security of overeducated workers is actually higher. For independent workers, the explanatory variables associated with job mismatch are not signifi cant. Th is phenomenon is therefore of concern to employees, not employers or self-account workers.
Table 2.4 Correlation Matrix between Job Mismatch and Insecurity Indicators in 10 Cities in Sub-Saharan Africa
Variable
Continuous job mismatch indicator (Clogg indicator)
Discrete job mismatch indicator
(de Grip indicator) Five categories Three categories Three categories
Insecurity of dependent
workers –0.09 –0.17 –0.12
Insecurity of independent
workers –0.07 –0.15 –0.15
Insecurity score –0.08 –0.22 –0.18
Sources: Based on Phase 1 of the 1-2-3 surveys of selected countries (see table 2.1 for details).
Table 2.5 Insecurity Score Equation with Overeducation and Undereducation Variables for Dependent and Independent Workers in 10 Cities in Sub-Saharan Africa
(ordinary least squares)
Variable All
Dependent workers
Independent workers Job mismatch (reference = job match)
Undereducated (continuous indicator) –0.0807*** –0.2000*** 0.0322
Overeducated (continuous indicator) 0.2210*** 0.1980*** 0.0716
Size of business (reference = self-employment [1 person])
Microbusiness (2–5 people) –0.3090*** –0.2220*** –0.0775***
Medium-size business (6–20 people) –0.815*** –0.559*** –0.297***
Large business (>20 people) –1.426*** –1.152*** –1.599***
Migrant status (reference = native)
Interurban migrant –0.0318 –0.0547* 0.0302
Migrant from the rural exodus 0.00259 –0.02680 0.06090**
Foreigner 0.0385 0.0536 0.0594**
Jobholding and time-related underemployment
Multiple jobholder 0.0867** 0.0800 0.0331
Time-related underemployment 0.332*** 0.478*** 0.227***
Education (reference = no education or informal education)
Primary –0.1060*** –0.2570*** 0.0111
Lower-secondary –0.27900*** –0.49000*** –0.00262
Upper-secondary –0.673*** –0.892*** –0.212***
Higher –0.977*** –1.247*** –0.408***
Standing in household (reference = head of household)
Head of household’s spouse 0.0979*** 0.1190** 0.0533*
Secondary household member 0.06940** 0.15500*** –0.00527
Marital status and gender
Couple (married or unmarried)(reference = single) –0.0880*** –0.1040*** –0.0882***
Male (reference = female) 0.1320*** 0.1790*** 0.0416*
Sector (reference = secondary sector)
Tertiary sector –0.348*** –0.445*** –0.346***
Primary sector –0.240*** –0.449*** –0.312***
Sector (reference = public sector)
Informal sector 1.363*** 0.894*** 1.752***
Formal private sector 0.371*** 0.258*** 0.513***
102 URBAN LABOR MARKETS IN SUB-SAHARAN AFRICA
Wage Downgrading as a Pathway Out of
Unemployment or Economic Inactivity
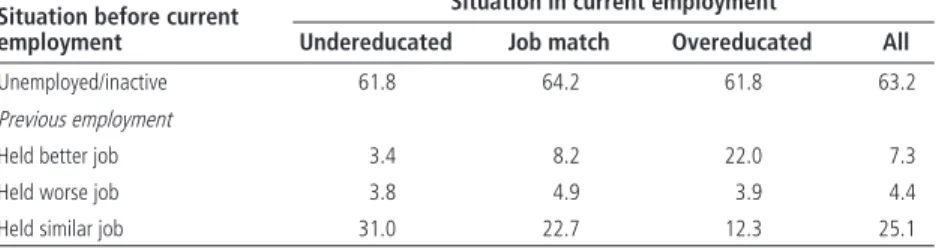
Th e decision to remain unemployed can be interpreted as resistance to down-grading and skill-related underemployment. Conversely, overeducation can be interpreted as resistance to unemployment. Examination of an overeducated jobholder’s previous situation (similar job or unemployment) was used to evalu-ate the likelihood of this hypothesis. Table 2.6 presents the results.
A Chi-squared test rejects (at the 5 percent level) the hypothesis of indepen-dence between the mobility variable change between the employed worker’s previous situation and current employment and the job mismatch indicator (Clogg indicator).
Relative to individuals in a job match situation, proportionally more over-educated individuals were upwardly mobile (that is, moved up socioeconomi-cally since their previous job or completion of studies). Th is fi nding could refl ect the theory of the human capital life cycle, which states that individuals temporarily hold a series of jobs below their level in order to accumulate experi-ence and know-how that prepare them to apply for positions more in keeping with their qualifi cations.
A slightly smaller than average proportion of overeducated workers is unem-ployed or out of the labor force just before holding their current job. Th is fi nd-ing contradicts the economic intuition that overeducation oft en follows a period of unemployment. Th is question calls for further examination of the determi-nants of professional mobility.
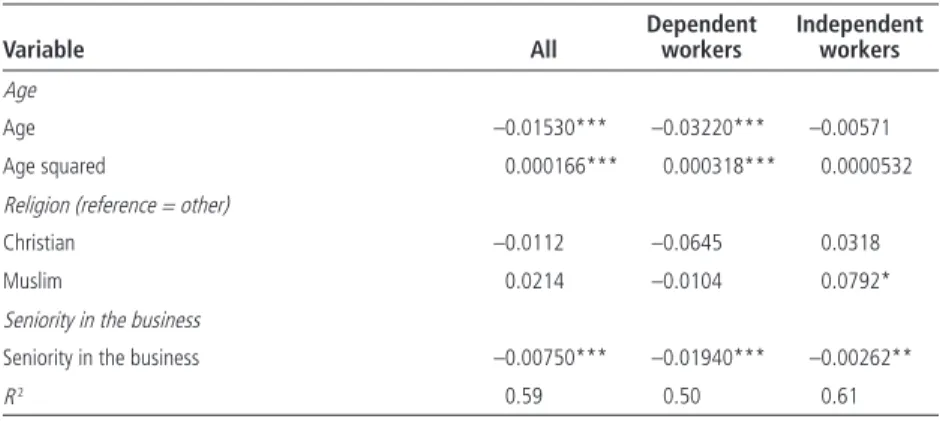
Age
Age –0.01530*** –0.03220*** –0.00571
Age squared 0.000166*** 0.000318*** 0.0000532
Religion (reference = other)
Christian –0.0112 –0.0645 0.0318
Muslim 0.0214 –0.0104 0.0792*
Seniority in the business
Seniority in the business –0.00750*** –0.01940*** –0.00262**
R 2 0.59 0.50 0.61
Sources: Based on Phase 1 of the 1-2-3 surveys of selected countries (see table 2.1 for details).
Note: Figures are for working individuals 15 and older.
* significant at the 10 percent level, ** significant at the 5 percent level, *** significant at the 1 percent level.
Table 2.5 (continued) Variable All Dependent workers Independent workers
Th e long-term unemployed (people unemployed for more than a year) appear to be less particular than the short-term unemployed about the match between the job and their qualifi cations: just 29 percent of the long-term unem-ployed seek a job that corresponds to their training or their trade, as opposed to 37 percent of the short-term unemployed (table 2.7). Th is simple empirical result validates the theory that a mismatch occurs in the event of a strong risk of unemployment and a long period of unemployment: the longer the period of unemployment, the more the unemployed reduce their reservation wage and the skill level of the job they will apply for.
Conclusion
Th e special features of its labor markets—the lack of unemployment benefi ts, the predominance of the informal sector, the prevalence of personal networks to obtain jobs, the low unemployment rate, and so forth—make the classic Table 2.6 Labor Market Status before Current Employment in 10 Cities in Sub-Saharan Africa
(percent)
Situation before current employment
Situation in current employment
Undereducated Job match Overeducated All
Unemployed/inactive 61.8 64.2 61.8 63.2
Previous employment
Held better job 3.4 8.2 22.0 7.3
Held worse job 3.8 4.9 3.9 4.4
Held similar job 31.0 22.7 12.3 25.1
Sources: Based on Phase 1 of the 1-2-3 surveys of selected countries (see table 2.1 for details).
Note: Figures are for working individuals 25–44.
Table 2.7 Type of Job Sought by the Unemployed in 10 Cities in Sub-Saharan Africa, by Length of Unemployment (percent) Job sought Long-term unemployed Short-term unemployed Total unemployed
Job corresponding to trade or training 29.4 36.6 31.0
Job in another trade or sector 16.1 15.7 16.0
Indifferent 54.5 47.7 53.0
Total 100.0 100.0 100.0
Sources: Based on Phase 1 of the 1-2-3 surveys of selected countries (see table 2.1 for details).
104 URBAN LABOR MARKETS IN SUB-SAHARAN AFRICA
indicators of unemployment and time-related underemployment inappro-priate, if not misleading, for understanding labor markets in Sub-Saharan Africa. Th e harmonized job mismatch measurement captures these as yet unmeasured aspects by concentrating on underutilization of productive capacities. Job mismatch should be considered an extension of the under-employment notion.
Overeducation—measured as the gap between individual qualifi cations and the qualifi cations usually required for the job held—is not confi ned to devel-oped countries: it aff ects 21 percent of workers in Sub-Saharan Africa. Men, older people, migrants, workers in the informal sector, the uneducated, and the highly educated are more likely than other workers to fi nd their job mismatched with their education.
Job mismatch aff ects both earnings and job insecurity: other things equal, workers who are overeducated for the work they do have less job security than workers whose qualifi cations match their job and workers who are under-educated for their jobs. Th e job mismatch evolves over the course of a career, with overqualifi cation following economic inactivity, unemployment, or more extreme overeducation.
Th e analysis makes a case for the widespread harmonization of job quality indicators and the extension of the inadequate employment measurement. Th e empirical methods used here need to be compared with other measurement methods, such as the expert job analysis method, which is more focused on business demand for qualifi cations and workers’ own declarations, which are more subjective but easier to set up.
Notes
1. In its 2006 evaluation of African labor markets, the World Bank identifi ed four prob-lems: the dearth of data, lack of comparability, measurement problems, and low relevance for low-income countries.
2. Th e ILO defi nition of unemployment (1997) corresponds to workers who did not work (even one hour) in the seven days preceding the survey, who sought work during the previous month, and who are available to work. Time-related underem-ployment covers gainfully employed workers whose working week is shorter than the statutory working week and who would like to work more.
3. Th is type of situation used to be called disguised unemployment (Robinson 1937). 4. Although Abidjan and Cotonou are not administrative capitals, we refer to them as
capitals because they are the most important economic centers in their countries (Cotonou is also the seat of government).
5. Th is extension used to be called invisible underemployment, which the ILO described as “primarily an analytical concept refl ecting a misallocation of labour resources or a fundamental imbalance between labour and other factors of production. Characteristic symptoms might be low income, underutilization of skill, and low productivity. Analytical studies of invisible underemployment should be directed to the examination and analysis of a wide variety of data, including income and skill
levels (disguised underemployment) and productivity measures (potential under-employment)” (ILO 1982, pp. 52–53).
6. Th urow and Lucas (1972), Hartog (1980), and others use the Dictionary of Occupa-tional Titles (U.S. Department of Labor) to measure overeducation.
7. De Grip developed an algorithm to identify the dominant (qualitative) level of edu-cation for each type of occupation. Depending on the distribution of the types of education within the given occupation, the dominant type of education is either the most commonly occurring or a combination of two or three levels grouped together. Th e algorithm had some fl aws, which are corrected for here (de Grip, Borghans, and Smits 1998).
8. For a description of 1-2-3 surveys, see box O.1 in the overview. Cameroon and Mad-agascar were included because their labor markets are very similar to labor markets in West Africa (see chapter 1).
9. Th e fact that the share of overeducated people in Europe and the United States is similar to the share in Sub-Saharan Africa does not mean that the levels of education are similar. Th e level of education in Africa is still much lower than in the developed countries.
10. If we use the mean instead of the median to estimate the norms when building the continuous indicator, the correlation factor rises to 86 percent.
11. Stata’s test of independence on the logit procedure returns a positive and signifi cant result.
12. Th e fi nal model estimated aims to be as sparing as possible. Th e explanatory vari-ables ultimately chosen for the model are selected by a procedure of gradual elimina-tion of the variables or categories with the least explanatory power.
13. In the absence of an additional test sample, this confusion matrix was constructed from the data used to build the model. Th is evaluation could therefore be criticized for being overly optimistic.
14. Clogg’s fi ve ordered categories are –2 (extreme undereducation), –1 (undereduca-tion), 0 (match), 1 (overeduca(undereduca-tion), 2 (extreme overeducation). De Grip’s three cat-egories are undereducation, job match, and overeducation.
References
Becker, G. S. 1975. Human Capital: A Th eoretical and Empirical Analysis, with Special Ref-erence to Education, 2nd ed. Cambridge, MA: National Bureau of Economic Research. Bodier, M., and E. Crenner. 1997. “Adéquation entre formation et emploi: ce qu’en
pensent les salariés.” INSEE Première 525 (June): 1–4.
Borgen, W. A., N. E. Amundson, and H. G. Harder. 1988. “Th e Experience of Underem-ployment.” Journal of Employment Counseling 25: 149–59.
Card, D. 2001. “Estimating the Return to Schooling: Progress on Some Persistent Econo-metric Problems.” Econometrica 69 (5): 1127–60.
Clogg, C. 1979. Measuring Underemployment: Demographic Indicators for the United States. New York: Academic Press.
Clogg, C., and J. Shockey. 1984: “Mismatch Between Occupational, and Schooling: A Prevalence Measure, Recent Trends, and Demographic Analysis.” Demography 21 (2): 235–57.
106 URBAN LABOR MARKETS IN SUB-SAHARAN AFRICA
Cohn, E., and S. P. Khan. 1995. “Th e Wage Eff ects of Overschooling Revisited.” Labour Economics 2 (1): 67–76.
de Grip, A., L. L. Borghans, and W. Smits. 1998. “Future Developments in the Job Level, and Domain of High–Skilled Workers.” In Towards a Transparent Labor Mar-ket for Educational Decisions, ed. J. Heijke and L. Borghans, 21–57. Aldershot, U.K.: Ashgate.
Esteves, L., and P. Martins. 2007. “Job-Schooling Mismatches and Wages in Brazil.” Queen Mary College, University of London.
Freeman, R. B. 1976. Th e Overeducated Americans. New York: Academic Press. Groot, W. 1996. “Th e Incidence of and Returns to Overeducation in the UK.” Applied
Economics 28: 1345–50.
Groot, W., and H. Maassen van den Brink. 2000. “Overeducation in the Labor Market: A Meta-Analysis.” Economics of Education Review 19 (2): 149–58.
Hartog, J. 1980. “Earnings and Capability Requirements.” Review of Economics and Sta-tistics 62 (2): 230–40.
———. 2000. “Over-Education and Earnings: Where Are We, Where Should We Go?”
Economics of Education Review 19 (2): 131–47.
Hecker, D. E. 1992. “Reconciling Confl icting Data on Jobs for College Graduates.”
Monthly Labour Review 115 (7): 3–12.
Heckman, J. J. 1979. “Sample Selection Bias as a Specifi cation Error.” Econometrica
47: 153–61.
Herrera, J. 2005. “Sobre y subeducacion en el Peru urbano.” In Cambios globales y el mer-cado laboral peruano: comercio, legislación, capital humano y empleo, ed. G. Yamada and M. Jaramillo, 181–227. Lima: Universidad del Pacifi co.
ILO (International Labour Organization). 1982. “General Report.”13th International Conference of Labour Statisticians, Geneva, October.
———. 1993. “Resolution Concerning Statistics of Employment in the Informal Sector.” 15th International Conference of Labour Statistics, Geneva, January.
———. 1997. “Underemployment: Concept and Measurement.” Report I, Meeting of Experts on Labour Statistics, Geneva, October 14–23.
———. 1998. “Report of the Conference.” 16th International Conference of Labour Stat-isticians, Geneva, October 6–15.
———. 2006. “Regional Labour Market Trends for Youth: Africa.” ILO Youth Employ-ment Programme, Geneva, September.
Kuépié M., C. Nordman, and F. Roubaud. 2009. “Education and Earnings in West Africa.” Journal of Comparative Economics 37: 491–515.
Mincer, J. 1974. Schooling, Experience, and Earnings. New York: National Bureau of Eco-nomic Research.
Robinson, J. 1937. Essays in the Th eory of Employment. London: Macmillan.
Rubb, S. 2003a. “Overeducation: A Short or Long Run Phenomenon for Individuals?”
Economics of Education Review 22 (4): 389–94.
———. 2003b. “Overeducation in the Labor Market:” A Comment and Re-analysis of a Meta-analysis.” Economic of Education Review 22 (6): 6121–29.
Sicherman, N. 1991. “Overeducation in the Labor Market.” Journal of Labor Economics
9 (2): 101–22.
Simon, C., and O. Stark. 2007. “Th e Brain Drain, ‘Educated Unemployment,’ Human Capital Formation, and Economic Betterment.” Economics of Transition 15 (4): 629–60. Spence, M. 1973. “Job Market Signaling.” Quarterly Journal of Economics 87 (3): 355–74. Th urow, L. 1975. Generating in Equality: Mechanism of Distribution in the U.S. Economy.
New York: Basic Books.
Th urow, L. C., and R. Lucas. 1972. Th e American Distribution of Income: A Structural Problem. Study for the Joint Economic Committee, U.S. Congress. Washington, DC: Government Printing Offi ce.
UNECA (UN Economic Commission for Africa). 2005. Economic Report on Africa 2005: Meeting the Challenges of Unemployment and Poverty in Africa. Addis Ababa: UNECA. U.S. Department of Labor. Various years. Dictionary of Occupational Titles. Washington,
DC: U.S. Department of Labor.
Verdugo, R., and N. Verdugo. 1989. “Th e Impact of Surplus Schooling on Earnings.”
Journal of Human Resources 24 (4): 629–43.
World Bank. 2006. “Labor Diagnostics for Sub-Saharan Africa: Indicators, Problems, and Data Available.” Technical Note, World Bank, Washington, DC.
Some rights reserved 1 2 3 4 16 15 14 13
Th is work is a product of the staff of Th e World Bank with external contributions. Note that Th e World Bank and the Agence Française de Développement do not necessarily own each component of the content
included in the work. Th e World Bank and the Agence Française de Développement therefore do not
warrant that the use of the content contained in the work will not infringe on the rights of third parties. Th e risk of claims resulting from such infringement rests solely with you.
Th e fi ndings, interpretations, and conclusions expressed in this work do not necessarily refl ect the views of Th e World Bank, its Board of Executive Directors, or the governments they represent, or the
Agence Française de Développement. Th e World Bank does not guarantee the accuracy of the data
included in this work. Th e boundaries, colors, denominations, and other information shown on any map in this work do not imply any judgment on the part of Th e World Bank concerning the legal status of any territory or the endorsement or acceptance of such boundaries.
Nothing herein shall constitute or be considered to be a limitation upon or waiver of the privileges and immunities of Th e World Bank, all of which are specifi cally reserved.
Rights and Permissions
Th is work is available under the Creative Commons Attribution 3.0 Unported license (CC BY 3.0) http:// creativecommons.org/licenses/by/3.0. Under the Creative Commons Attribution license, you are free to copy, distribute, transmit, and adapt this work, including for commercial purposes, under the following conditions:
Attribution—Please cite the work as follows: De Vreyer, Philippe, and François Roubaud, Editors. 2013.
Urban Labor Markets in Sub-Saharan Africa. Africa Development Forum series. Washington, DC: World
Bank. doi:10.1596/978-0-8213-9781-7. License: Creative Commons Attribution CC BY 3.0
Translations—If you create a translation of this work, please add the following disclaimer along with the
attribution: Th is translation was not created by Th e World Bank and should not be considered an offi cial World Bank translation. Th e World Bank shall not be liable for any content or error in this translation. All queries on rights and licenses should be addressed to the Offi ce of the Publisher, Th e World Bank, 1818 H Street NW, Washington, DC 20433, USA; fax: 202-522-2625; e-mail: [email protected]. ISBN (paper): 978-0-8213-9781-7
ISBN (electronic): 978-0-8213-9782-4 DOI: 10.1596/978-0-8213-9781-7
Cover image: ©Michelle Saint-Léger, IRD, 2013.
Cover design: Debra Naylor, Naylor Design, Inc.
Library of Congress Cataloging-in-Publication Data
Vreyer, Philippe De.
Urban labor markets in sub-Saharan Africa/Philippe De Vreyer and François Roubaud.
p. cm.
Includes bibliographical references and index.
ISBN 978-0-8213-9781-7 — ISBN 978-0-8213-9782-4 (electronic)
1. Labor market—Africa, Sub-Saharan. 2. Africa, Sub-Saharan—Economic conditions. 3. City dwellers—Employment—Africa, Sub-Saharan. I. Roubaud, François. II. World Bank. III. Title.
HD5837.A6V74 2013
331.120967—dc23
2012050217
Th e French translation of this book is copublished by Agence Française de Développement and Institut
de Recherche pour le Développement (IRD). Th e IRD, a French public research institute emphasizing
interdisciplinarity, has focused its research for more than 65 years on the relationship between man and its environment in Africa, Asia, Latin America, the Mediterranean, and the French tropical overseas ter-ritories. Its research, training, and innovation activities are intended to contribute to the social, economic, and cultural development of southern countries. For further information: www.editions.ird.fr.