REGULAR ARTICLE
DETERMINATION OF ALCOHOL CONTENTS OF FERMENTATED BLACK TAPE KETAN BASED ON DIFFERENT FERMENTATION TIME USING SPECIFIC
GRAVITY, REFRACTIVE INDEX AND GC-MS METHODS
Muchtaridi Muchtaridi1*, Ida Musfiroh1, Nunu Nugraha Hambali1, Wiwiek Indrayati1
Address: 1Department of Pharmacochemistry, Faculty of Pharmacy, Universitas Padjadjaran, Jl. Raya Bandung-Sumedang Km.21 Jatinangor, Sumedang, Indonesia
Phone number : +62-227798927
*Corresponding author: [email protected]
ABSTRACT
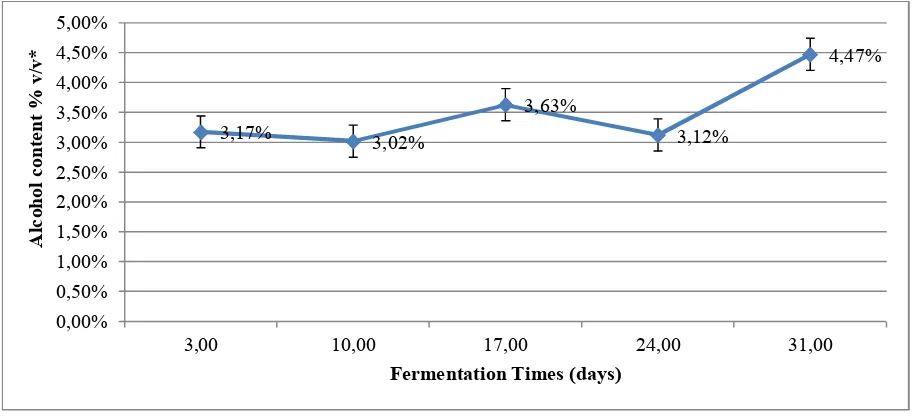
Tape ketan is the product of fermentation process using black glutinous riceas basic ingredients, which then fermented for two to three days and finally produced tape ketan, organic acid and alcohol. The purpose of this research was to determine alcohol contents of fermentated black tape ketan based on different fermentation time with three diferent methods. Methods used are specific gravity, refractive index and GC-MS. Alcohol concentration obtained by using specific gravity method at 3, 10, 17, 24, and 31 days of fermentation, respectively, are 3.17% v / v; 3.02% v / v; 3.63% v / v; 3 , 12% v / v; and 4.47% v / v, using the method of refractive index is 3.90% v / v; 3.69% v / v; 4.31% v / v; 3.80% v / v and 5.04% v / v, and using GC-MS method was 4.30 % v/v; 4.23 % v/v; 5.01 % v/v; 4.75 % v/v; and 5.34 % v/v.The variation of fermentation time obviously did not influence the produce of alcohol contents statistically.
INTRODUCTION
Fermentated food is agricultural product (Akoh et al., 2008) which has been processed action of microorganisms (bacteria, yeast, and mycelia fungi)into desired food product (Nout, 2003). This product will have more attractive characteristic compared with is original source. The advantages of processed fermentated food is that it can increase economical value. This food play an important role in the diet of people in many parts of the world, even not only provide important sources of nutrients but have also great potential in maintaining health and preventing diseases (Kabak and Dobson, 2011).
The types of fermentated food are various and has been famous since years in Indonesia (Beuchat, 2008). The processing of fermentated food mostly produced at home industries scale, because it is cheap and simple. One of this fermentated product is tape ketan.Tape ketan is a traditional food originated from West Java (Sastramiharja, 1986). Tape ketan is often made at the time of Eidfor a meal the guests who come to stay in touch in Sundanese people. It is the product of fermentation process using cooked black sticky riceas basic ingredients, which fermentated for two to three days and finally produced tape ketan, acid and alcohol (Cronk et al., 1977). Previous research of tape ketan by other country authors has been published since long time ago. Cronk et al. (1979) describe well of this product. Tape ketan is fermented by using culture A. rouxii, S. cerevisiae, and P. Anomale
(Cronk et al., 1977, Siebenhandl et al., 2001). The other Inodnesian tape, the lactic acid bacteria (LAB) are among the integral microflora of yeast of Balinnese tape (Sujaya et al., 2002). Tape ketan ready for consumption after fermentation at 30°C for 36 to 48 h, however tape ketan will produce the highest concentration of ethanol until 8% (v/v) by the mold plus
E. burtonii at 144 h, even Cronk et al.also detected isobutanol, amyl alcohol, and isamyl alcohol in tape ketan produced after 36 hours at 30oC. The level of alcohol total will reach up 600 mg/L (6 % v/v) after 8 days (Cronk et al., 1979).
MATERIAL AND METHODS
Materials
Materials used in this research were black ketan rice of Oryza sativa forma glutinosa
(determined by Department of Biology of FMIPA UNPAD). Yeast used for the process of fermentation were market yeast which consisted of Amylomyces rouxii, Candida pelliculosa, Bacillus, and Sacharomyces (determined by PT. Biofarma, Bandung), alcohol p.a (Merck), alcohol analysis grade, sulfuric acid p.a. (Bratachem), potassium dichromate (Bratachem), NaOH p.a. (Merck), and iodium solid p.a. (Merck).
The process of making black tape ketan
Three kilograms of black sticky rice (Oryza sativa forma glutinosa) were used as the basic ingredient to produce three samples (A, B, C, and D ) with same treatment to purpose repeating sample of black tape ketan with the same treatment, but it was produced at different time and at 30 (A, B, and C) and (D) 25oC (room temperature). Amylomyces rouxii, Candida pelliculosa, Bacillus, and Sacharomyces were used as the yeasts. Each sample was divided into five different parts and was treated with various fermentation time (3, 10, 17, 24, 31 days).
Separation of alcohol with distillation methods
Qualitative analysis of alcohol in the distillate
Qualitative analysis of alcohol were conducted by : a) color reaction using potassium dichromate 3,5 % in sulphuric acid, b) iodoform reaction, c) mass spectrometry at 70 eV, 40-550 amu.
Quantitative analysis of alcohol in the distillate
Specific gravity methods
This method was conducted at 20 oC. Alcohol in the distillate was determined using
tables expressing relation between specific gravity with alcohol rate (Association Official Agricultural of & Analytical Chemists International, 2000, New York, USA). To be able to determine alcohol content in sample, alcohol content in the distillate has to be converted before. The distillation methods was showed as mention above (Horwitz, 2000).
Refractive index methods
The refractive index method was based on condensation refractive index. The instrument used was refractometer (Abbe) with measurement area between 1,3000 up to 1,7000. Alcohol content in the distillate was obtained by measuring the refractive index of distillate which then was interpolated to make calibration curve.Determination of the refractive index which is not carried out at 20 ° C should be corrected first by using the equation:
n20
D = Refractive Index Sample (n) + 0,0004 (T- 20C) (Horwitz, 2000)
n20
D -refractive index correction
T - observation temperature
GC-MS
programming from 50oC/4 minutes to 150oC/5 min (10oC/ min). Identification of the
substances was carried out by mass spectral data with those from the MS data system Willey-229 lib., Nist-62 lib., and Nist-12 library.
Recovery
Recovery of the three methods were calculated on the basis of comparation between alcohol standard and alcohol in distillate (25 mL alcohol standard was added into 25 mL distilled water, then the mixture was distilled). All treatment from distillation to separation of alcohol was conducted in similar conditions.
pH
The pH range of black tape ketan samples were 3.83 to 4.56, thereby optimal pH which needed by yeast for growth which lied between 4.0-4.5 had been fulfilled (Siebenhandl et al., 2001).
RESULTS AND DISCUSSION
All distillates gave positive results when reacted with K2Cr2O7-H2SO4 which produced
greenish blue colour. There showed the existence of alcohol compound. (Thompson, 1990). Identification of alcohol using iodoform reaction showed positive result which proven by the arousing of characteristic iodoform odour and the formation of colored precipitation. When the precipitate was placed under microsope we could obtain hexagonal crystal or flowered form crystal. Pursuant to result identify with reaction of K2Cr2O7 - H2SO4 and reaction
forming of iodoform, hence it could be concluded that there were alcohol compounds in black
tape ketan samples. Fragmentation of Mass Spectrometry showed that peak number2 was ethanol with ion molecule m/z 46 (C2H5OH+), 31 (CH2OH+), 29 (CH3CH2+), 28 (CH3CH+),
and 18 (H2O+).
Table 1 Determination of Alcohol Levels with Specific gravity method
Black tape ketan sample*
Fermentati on Duration**
Specific gravity in
distillate
Specific gravity
in sample alcohol % v/v distillate
% v/v alcohol sample**
*
Recovery
A
0 0.9950+ 2.0 10-4 1.1743+1.5 10-4 3.4 +0.10 4.01+0.02
81 % 1 0.9947+1.5 10-4 1.1749+1.1 10-4 3.61+0.09 4.26+0.02
2 0.9949+ 2.2 10-4 1.1762+ 2.4 10-4 3.47+0.12 4.10+0.03
3 0.9955+3.1 10-4 1.1798+1.4 10-4 3.05+0.19 3.61+0.03
4 0.9938+5.0 10-4 1.1682+3.2 10-4 4.26+0.21 5.01+0.08
B
0 0.9971+1.5 10-4 1.1834+1.5 10-4 1.95+0.11 2.31+0.01
1 0.9975+3.2 10-4 1.1866+3.5 10-4 1.68+0.18 2.00+0.02
2 0.9956+ 2.4 10-4 1.1742+ 2.1 10-4 2.98+0.13 3.51+0.02
3 0.9966+4.1 10-4 1.1833+1.8 10-4 2.29+0.20 2.72 +0.03 4 0.9940+1.6 10-4 1.1640+1.2 10-4 4.11+0.12 4.81+0.01
C
0 0.9960+3.1 10-4 1.1794+1.7 10-4 2.70+0.17 3.20 +0.02
1 0.9965+3.4 10-4 1.1795+1.4 10-4 2.36+0.15 2.79 +0.03
2 0.9959+ 2.3 10-4 1.1761+3.8 10-4 2.77+0.13 3.27 +0.01
3 0.9962+5.5 10-4 1.1784+ 2.5 10-4 2.57+0.24 3.04 +0.09
4 0.9955+2.2 10-4 1.1746+4.1 10-4 3.05+0.18 3.60 +0.01 * A, B, and C was three sample of black tape ketan which produced with the same treatment,
But it was produced at different moment
**Fermentation Time : 0= 3 days ; 1= 10 days ; 2= 17 days ; 3= 24 days ; 4= 31 days *** % alcohol in sample was determined according to equation as mention below:
% v/v alcohol in sample = (% / ( ) ( ) )
In the Table 1, black tape ketan A contained alcohol in the range of 3.61 % v/v to 5.01 % v/v, with the highest alcohol content equal to 5.01 % v/v when fermentated for 31 days. In the sample B, the concentration of alcohol ranged from 2.00 % v/v to 4.81 % v/v, with the highest alcohol content equal to 4.81 % v/v when fermentated for 31 days, while sample C were 2.79 % v/v until 3.60 % v/v with the highest alcohol content equal to 3.60 % % v/v when fermentated for 31 days
This research proved that the highest alcohol content in the three black tape ketan
* Alcohol contents (%) are mean averages of samples A, B, and C in same fermentation times
Figure 1 Curves of Alcohol Content to Fermentation Time with Specific Gravity
In the Fig. 1, determination of alcohol content with specific gravity method showed the existence of enough difference mean from content alcohol differed to fermentation time, but result of processing of statistical showed that (α= 0.01) there were not significant difference between alcohol content with fermentation time. This matter indicated that obtained alcohol content of fermentation process of making of black tapeketan had rate which was constant relative, when fermentation of 3 days. So that though, the fermentation time was lengthened, yielded alcohol content did not increase significantly. Belitz and Grosch (1999) explain that the primary fermentation starts within a day and reaches its maximum after 3-4 days, and after the end of main fermentation, which last 5-7 days (Belitz and Grosch, 1999). On the basis of previous researches (Sumarmi, 2002), fermentation time of 0 until 48 hour (day second) do not identify existence of alcohol content. However, when among 72 hours (third day) until 168 hours (7th day) obstetrical of alcohol range from 1.52 % v/v until
4.22 % v/v. Pursuant to the mentioned, the result of this research correlated with research result conducted by Sumarmi (2002).
Hartoto and Sastramiharja (1987) explain that alcohol content periodically reach constant rate, this matter is caused decreasing of glucose content and tolerance of microorganism the lowness to yielded alcohol, so that activity of microorganism become to be pursued. The inhibition of activity of microorganism at fermentation process, possibility is caused by alcohol accumulation at shares intra cell able to yield poisonous cell and cause change of cell membrane structure causing to degradation of cell membrane function (Torija et al., 2003).
3,17% 3,02% 3,63% 3,12%
4,47%
0,00% 0,50% 1,00% 1,50% 2,00% 2,50% 3,00% 3,50% 4,00% 4,50% 5,00%
3,00 10,00 17,00 24,00 31,00
A
lc
oh
ol
c
on
te
nt
%
v
/v
*
Determination of alcohol content using refractive index methods pursuant to refractive index of sample, then it was interpolated into calibration curve. The result of analysis was shown at Table 2.
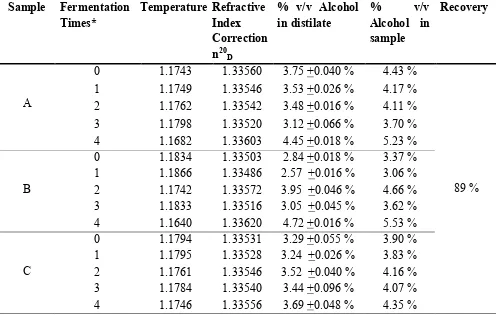
Table 2 Determination of Alcohol Levels with Refractive Index Methods* Sample Fermentation
Times* Temperature Refractive Index Correction n20
D
% v/v Alcohol
in distilate % Alcohol in v/v sample
Recovery
A
0 1.1743 1.33560 3.75 +0.040 % 4.43 %
89 %
1 1.1749 1.33546 3.53 +0.026 % 4.17 %
2 1.1762 1.33542 3.48 +0.016 % 4.11 %
3 1.1798 1.33520 3.12 +0.066 % 3.70 %
4 1.1682 1.33603 4.45 +0.018 % 5.23 %
B
0 1.1834 1.33503 2.84 +0.018 % 3.37 %
1 1.1866 1.33486 2.57 +0.016 % 3.06 %
2 1.1742 1.33572 3.95 +0.046 % 4.66 %
3 1.1833 1.33516 3.05 +0.045 % 3.62 %
4 1.1640 1.33620 4.72 +0.016 % 5.53 %
C
0 1.1794 1.33531 3.29 +0.055 % 3.90 %
1 1.1795 1.33528 3.24 +0.026 % 3.83 %
2 1.1761 1.33546 3.52 +0.040 % 4.16 %
3 1.1784 1.33540 3.44 +0.096 % 4.07 %
4 1.1746 1.33556 3.69 +0.048 % 4.35 %
*Fermentation Time : 0= 3 days ; 1= 10 days ; 2= 17 days ; 3= 24 days ; 4= 31 days. Linear Equation: Y = 0,00062 X + 1.3327; Coefisisen corelation : r = 0,99
*** Percentage of alcohon in sample was determined according to equation as mention below:
% v/v alcohol in sample = (% / ( ) ( ) )
The results were given in Table 2 indicated that black tape ketan of A had alcohol content of range from 3.70 % v/v until 5.23 % v/v with highest alcohol content equal to 5.23 % v/v obtained when ferment fourth. Alcohol contained by black tap eketan of B were 3.06 % v/v until 5.53 % v/v with highest alcohol content obtained by when ferment fourth, that is equal to 5.53 % v / v, while tape ketan of C had alcohol content ranging from 3.83 % v / v until 4.35 % v / v. The data of Table 2 indicated that highest alcohol content of black
Figure 2 Curve of Alcohol Content to Fermentation Time with Refractive Index Methods
As does at specific gravity methods, alcohol determination with refractive index method showed the existence of difference of obstetrical result of enough alcohol mean difference time of fermentation, but statistically indicates that difference of ferment time did not give difference significantly to yielded alcohol content.
Prior to determine of alcohol by using GC-MS methods, standard curve was obtained. The peak area were exposed to different concentrations of alcohol (% v/v) (10ppm or 0.001 %, 25ppm or 0.0025 %, 50ppm or 0.0050 %, 75 ppm or 0.0075 %, 100 ppm or 0.010 %, 125 ppmor 0.013 %, 150 ppmor 0.015 %, and 200 ppm or 0.020 %. Alcohol content in sample was calculated according to linear regression equation from the data (Peak Area = 3832.4(ppm) + 753433, r2 = 99.38 %) by Microsoft office XL 2007 as shown on Fig. 3.
3,293 3,113 3,650 3,203
4,287 0,000 1,000 2,000 3,000 4,000 5,000 6,000
3 10 17 24 31
A lc oh ol C on te nt % (v /v )
Fermentation Times (days)
y = 3832,4x + 753433 R² = 0,9938
0 200000 400000 600000 800000 1000000 1200000 1400000 1600000
0 50 100 150 200 250
Pe ak ar ea of G C
The result data of analysis alcohol in sample can be seen at Table 3. The peak area of alcohol in sample was insided into regresion equation as mention above thus obtain level of alcohol in sample. Recovery of GC analysis method (89 %) showed that this method has a fairly good accuracy, where the method has capable to be extracted well alcohol from sample.
Table 3 Determination of alcohol content with GC-MS Methods
Black
TapeKetan Fermentation Time** Peak Area
% v/v Alcohol in
Sample**
Recovery
A
0 3043213255 4.04
91 %
1 3263296009 4.33
2 3430255339 4.55
3 4022202058 5.34
4 4113270784 5.46
B
0 3020446074 4.01
1 3157049162 4.19
2 3301241312 4.38
3 3984256755 5.29
4 4128448905 5.48
C
0 3020446074 4.01
1 3141871041 4.17
2 3407488158 4.52
3 3900777089 5.18
4 3840064606 5.10
* Fermentation Time : 0= 3 days ; 1= 10 days ; 2= 17 days ; 3= 24 days ; 4= 31 days.
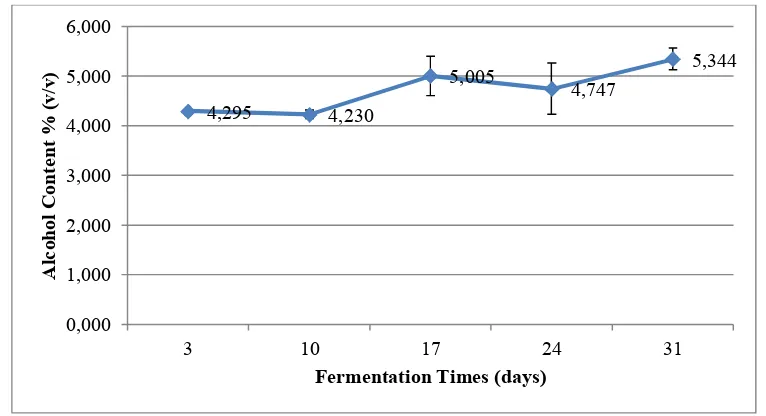
In GC-MS methods, alcohol was detected at retention time of range 2-3 minutes, while alcohol content determined at 3, 10, 17, 24, and 31 day fermentations time were 4.295 % v/v; 4.23 % v/v; 5.005 % v/v; 4.747 % v/v; and 5.344 % v/v, respectively. Recovery analysis of this method was found be higher than in other methods. In this study, GC-MS is most reliability tools for analysis alcohol. In the previous research, GC also is applied in analysis of alcohol in wine fermented by Okunowo and Osuntoki (2007). They determine that ethanol is predominant in fermented product (Okunowo and Osuntoki, 2007).
Pietsworski (2012). SPE-headspace could trap volatile compounds such as alcohol thus headspace iss more efficient in the extraction of the volatile compounds of fermented apple when taking into consideration the cost effectiveness (de Arruda Moura Pietrowski et al., 2012).
Figure 4 Curve of alcohol levels to fermentation time with GC-MS methods
Alcohol content obtained of fermentation result at making of black tape ketan had rate which is constant relative. Alcohol content of constant reached when fermented 3 day. Cronk et al. described that alcohol level of tape ketan would be increase more than 2 % after 2 days (48 hours), and reach up to more than 4 % after 4 days (96 hours). In other their publication, Cronk et al explained that total alcohol of tape ketan reach up 6 % or 600 mg/L after 8 days
(Cronk et al., 1979).
Our results of determination by specific gravity methods yielded alcohol level of range 3.02 % v/v until 4.47 % v/v; whereas the concentration of alcohol identified by refractive index methods was3.69 % v/v until 5.04 % v/v, and GC-MS methods determined of alcohol with range 4.29 % v/v until 5.30 % v/v. Whereas, Cronk et al. claimed that alcohol level will increase to 8% after 6 days and we found that alcohol level was around 4-5 % after 10 days
(Cronk et al., 1977). However, the alcohol content depends on some factor including microorganism types and environment research
Ardhana and Fleet (1989) showed that in the yeast of tape are Amylomyces rouxii, Candida pelliculosa, Saccharomyces cerevisiae, and bacteria from family of Bacillus and
Acetobacter. Microorganism identified of yeast of tape which be used this research correlated with previous research (Ardhana and Fleet, 1989, Cronk et al., 1977, Siebenhandl et al.,
4,295 4,230
5,005 4,747 5,344
0,000 1,000 2,000 3,000 4,000 5,000 6,000
3 10 17 24 31
A
lc
oh
ol
C
on
te
nt
%
(v
/v
)
2001), however it did not find Acetobacter. In Balinnese tape, yeast or ragi starter consist Pediococcus, Weissella and Enterococcus consistently during the tape fermentation; however the Lactobcillus sp. started to grow after 24 h fermentation then its population likely decrease afterwards (Sujaya et al., 2010). It is similar microorganisms contained in Vietnamese tape or banh men (Thanh et al., 2008). In this study, bacteria from family LAB (lacto bacillus) also was detected.
We found clearly that alcohol level of tape ketan after more than 3 days was more than 1 %. Previous and our study might provide answers to some hitherto unsolved questions about
halal status of tape ketan. Alcohol of tape ketan is categorized as khamr, its use could be regarded haram, regardless if it could intoxicate or not. The ruling concerning 'khamr' is that even the most very small amount of it is haram, regardless of whether it intoxicates or not
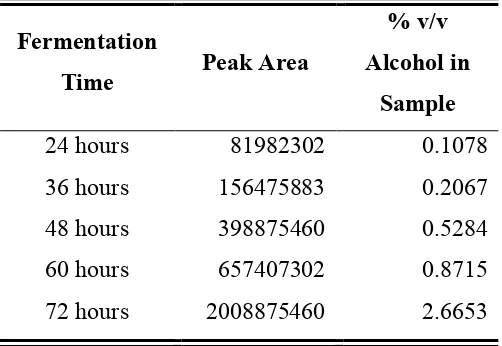
(Kramer et al., 2007). However, it is not fair if we decide that the tape ketan is haram. Previous study showed that alcohol level of tape ketan less than 1 % between 2-3 days, furthermore Muslim can consume tape ketan at this 2-3 days fermentation. In other hand, we determined alcohol content in tape ketan of sample D in different time with sample A, B, and C that found alcohol level in the sample D less than 1 % at 25oC of 1-3 days fermentation
using Amylomyces rouxii, Candida pelliculosa, Bacillus, and Sacharomyces as shown Table 4 using GC-MS method, even this data is supported by Cronk et al. studies that levels of alcohol in the tape ketan does not reach over 1% at 25 oC with a fermentation time of 2-3 days (Cronk et al., 1977).
Table 4 Alcohol Levels of Tape Ketan (Sample D) Using GC-MS methods in Making 25 oC
Fermentation
Time Peak Area
% v/v Alcohol in
Sample
24 hours 81982302 0.1078
36 hours 156475883 0.2067
48 hours 398875460 0.5284
60 hours 657407302 0.8715
CONCLUSION
The result of determination of alcohol content with specific gravity methods was obtained that alcohol content in black tape ketan with fermentation time 3 until 31 days successively, that was 3.17 % v/v until 4.47 % v/v; while with refractive index methods of alcohol in black tape ketan successively, that was : 3.90 % v/vuntil 5.04 % v/v, and with method of GC-MS each 4.295until 5.34 % v/v, respectively. Based on recovery data, the third methods has good accuracy to determine alcohol level in black tape ketan. Highest alcohol content to three types of determination methods obtained at fermentation for 31 days.
REFERENCES
AKOH, C. C., CHANG, S. W., LEE, G. C. & SHAW, J. F. 2008. Biocatalysis for the production of industrial products and functional foods from rice and other agricultural produce. in J Agric Food Chem,vol. 56, 2008, p. 10445-51.
ARDHANA, M. M. - FLEET, G. H. 1989. The microbial ecology of tape ketan fermentation. In Int J Food Microbiol vol. 9, 1989, p. 157-65.
BELITZ, H. D. & GROSCH, W. 1999. Food Chemistry, Berlin, Springer-Verlag, p. 916. BEUCHAT, L. R. 2008. Indigenous Fermented Foods. In Biotechnology. Wiley-VCH Verlag GmbH, chapther. 13, p. 528-529
CRONK, T. C., MATTICK, L. R., STEINKRAUS, K. H. & HACKLER, L. R. 1979. Production of higher alcohols during indonesian tape ketan fermentation. In Appl Environ Microbiol, vol. 37, 1979, p 892-6.
CRONK, T. C., STEINKRAUS, K. H., HACKLER, L. R. & MATTICK, L. R. 1977. Indonesian tape ketan fermentation. In Appl Environ Microbiol, vol. 33, 1977, p. 1067-73. DE ARRUDA MOURA PIETROWSKI, G., DOS SANTOS, C. M., SAUER, E., WOSIACKI, G. & NOGUEIRA, A. 2012. Influence of Fermentation with Hanseniaspora sp. Yeast on the Volatile Profile of Fermented Apple. In J Agric Food Chem, vol. 60, 2012, p. 9815-21.
KABAK, B. & DOBSON, A. D. 2011. An introduction to the traditional fermented foods and beverages of Turkey. In Crit Rev Food Sci Nutr, vol. 51, 2011, p. 248-60.
KRAMER, A., BELOW, H., BIEBER, N., KAMPF, G., TOMA, C. D., HUEBNER, N. O. & ASSADIAN, O. 2007. Quantity of ethanol absorption after excessive hand disinfection using three commercially available hand rubs is minimal and below toxic levels for humans. In
BMC Infect Dis, vol. 7, 2007, p. 117.
SASTRAMIHARJA, I. 1986. Pengantar Rekayasa Mikroba Bagian II, Bandung, ITB, p. 58-60
SIEBENHANDL, S., LESTARIO, L. N., TRIMMEL, D. & BERGHOFER, E. 2001. Studies on tape ketan--an Indonesian fermented rice food. In Int J Food Sci Nutr, vol. 52, 2001, p. 347-57.
SUJAYA, I. N., AMACHI, S., SAITO, K., YOKOTA, A., ASANO, K. & TOMITA, F. 2002. Specific enumeration of lactic acid bacteria in ragi tape by colony hybridization with specific oligonucleotide probes. In World Journal of Microbiology and Biotechnology, vol. 18, 2001, p. 263-270.
SUJAYA, I. N., NOCIANITRI, K. A. & ASANO, K. 2010. Diversity of bacterial flora of Indonesian ragi tape and their dynamics during the tape fermentation as determined by PCR-DGGE. In. Int J Food Res, vol. 17, 2010, p. 239-245.
SUMARMI, A. 2002. Penetapan kadar etanol dalam tape ketan menggunakan metode kromatografi gas. Thesis, ITB.
THANH, V. N., MAI LE, T. & TUAN, D. A. 2008. Microbial diversity of traditional Vietnamese alcohol fermentation starters (banh men) as determined by PCR-mediated DGGE. In Int J Food Microbiol, vol. 128, 2008, p. 268-73.
THOMPSON, S. 1990. Small Scale Experiment for General Chemistry, New Jersey Prentice Hall.