Ž .
Aquaculture 186 2000 293–310
www.elsevier.nlrlocateraqua-online
Replacement of fish meal in diets for Australian
silver perch, Bidyanus bidyanus: I. Digestibility of
alternative ingredients
Geoff L. Allan
a,), Scott Parkinson
a, Mark A. Booth
a,
David A.J. Stone
a, Stuart J. Rowland
b, Jane Frances
a,
Rebecca Warner-Smith
aa
NSW Fisheries, Port Stephens Research Station, Taylors Beach, NSW, 2316, Australia b
NSW Fisheries, Grafton Research Centre, Locked Bag 3, Grafton, NSW, 2460, Australia
Accepted 30 November 1999
Abstract
Ž .
Apparent digestibility coefficients ADCs for dry matter, nitrogen, energy and individual amino acids for 29 commonly used feed ingredients were determined for silver perch, a native Australian freshwater species currently being cultured in Australia, Taiwan and China. ADCs were determined using faeces collected following settlement. Results from 11 experiments are reported. Each experiment included a reference diet and test diets, which were composed of 69.3%
Ž .
reference diet, 29.7% test ingredient and 1% chromic oxide inert indicator . Ingredients tested included Australian, Danish and Peruvian fish meals, blood meal, meat and bone meals from beef
Ž
and lamb, poultry meal, feather meal, soybean and canola meals both expeller and solvent
.
extracted for each , full fat soybeans, peanut meal, cottonseed meal, linola, two species of lupins, field peas, faba beans, chick peas, vetch, cow peas, wheat gluten, corn gluten meal, two cultivars of wheat, millrun and sorghum.
ADCs for dry matter, energy and nitrogen were highest for fish meal, although several other ingredients, including some animal meals and gluten from wheat and corn, had similar ADCs for dry matter and energy. Digestible protein from these ingredients was in the range 52–86% compared with 63–69% for fish meals. Silver perch were capable of digesting protein very effectively in almost all ingredients tested. Amino acid availability reflected nitrogen digestibility except for Peruvian fish meal and the two meat and bone meals, for which the availability of some amino acids was lower, possibly indicating protein damage during processing. Oilseeds and
)Corresponding author. Tel.:q61-249-821232; fax:q61-249-821107.
Ž .
E-mail address: [email protected] G.L. Allan .
0044-8486r00r$ - see front matterq2000 Elsevier Science B.V. All rights reserved.
Ž .
( ) G.L. Allan et al.rAquaculture 186 2000 293–310
294
Ž .
legumes also tended to have lower ADCs for some amino acids e.g., sulphur amino acids than for other amino acids. Differences in ADCs for nitrogen and individual amino acids indicate the need for individual amino acid availability data.
The data provided a useful starting point for least-cost formulation of diets for silver perch. q2000 Elsevier Science B.V. All rights reserved.
Keywords: Nutrition; Bidyanus bidyanus; Digestibility; Meat meal; Legumes; Oilseeds; Cereals
1. Introduction
The shift to more intensive culture practices has contributed to a global increase in
Ž
aquaculture production of about 12% per annum from 1984 to 1997 Tacon and
.
Dominy, 1999 . This shift has only been possible because of the increased availability of formulated diets. In Asia, the demand for aquaculture diets increased more than fourfold
Ž . Ž .
between 1986 and 1990 Akiyama, 1991 and Tacon and Dominy 1999 predicted the
Ž .
global market for aquaculture diets was over 11 million t metric tonnes in 1997. Marine based ingredients, especially fish meals are highly sought after as the protein source of choice for many formulated aquaculture diets. Fish meals provide high contents of essential amino and fatty acids, are low in carbohydrates, are usually well digested and, provided they are fresh, contain few anti-nutritional factors. However, production of fish meal already uses approximately 35% of the total global fish catch
ŽTacon and Dominy, 1999 . As about 4 kg of wet fish is needed to produce 1 kg dry fish.
meal, if diets contain more than 17% fish meal andror the food conversion ratio exceeds 1.5:1, aquaculture entails a net loss of fish protein.
Ž
The search for alternatives to fish meal is an international research priority Manzi,
.
1989; Hardy and Kissil, 1997 . In Australia, very little fish meal is produced, although abundant supplies of lower value agricultural protein sources, such as animal meals, oilseeds, grain legumes and cereals are available. For example, about 460 000 t of meat meal, 860 000 t of canola, 1.4 million tonnes of lupins, 300 000 t field peas and 19.4
Ž
million tonnes of wheat, are produced annually Australasian Agribusiness Services,
.
1993; ABARE, 1998 .
The determination of digestibility is the first step in evaluating the potential of an ingredient for use in the diet for an aquaculture species. In this study, digestibility coefficients for 29 commercially available ingredients in Australia were researched. Silver perch is a native Australian freshwater finfish, which is being cultured due to its rapid growth, high production in static earthen ponds and excellent eating qualities.
2. Materials and methods
2.1. Fish
Ž .
Juvenile silver perch Bidyanus bidyanus were obtained from the NSW Fisheries
Ž .
( )
G.L. Allan et al.rAquaculture 186 2000 293–310 295
10 000-l concrete or 10 000-l fibreglass tanks for at least 1 week prior to each experiment. During this time, fish were fed once daily to apparent satiation on the same
Ž . Ž
reference diet SP35 used in subsequent digestibility studies Allan and Rowland,
.
1992 . Before each experiment, fish were treated with 5 grl NaCl to ensure they were
Ž .
free of ectoparasites and to prevent fungal infection Rowland and Ingram, 1991 . They were then weighed individually or in groups and placed into digestibility tanks via random interspersion. Any fish that became ill or died during the experiment were replaced with fish acclimated on the same dietary treatment in order to maintain stocking densities.
During all handling procedures fish were anaesthetised in a bath of 25 mgrl
ethyl-p-aminobenzoate for 5 min. Once in the laboratory, all fish were maintained on the reference diet SP35 and allowed to acclimatise to experimental conditions for 5 to 7 days prior to the introduction of chromic oxide marked diets. Faecal collection com-menced after fish had been fed experimental diets for at least 3 days.
2.2. Diets
Ž . Ž .
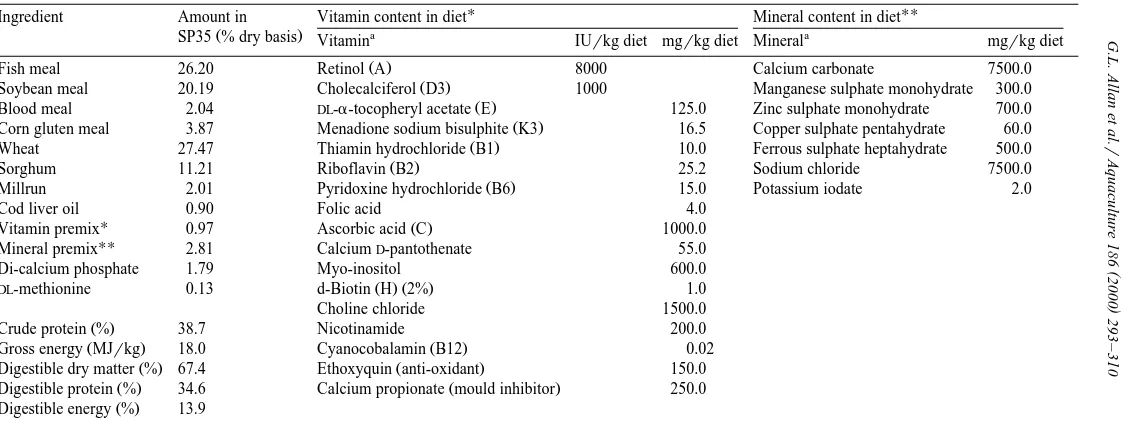
All experimental diets were composed of 69.3% reference diet SP35 Table 1 and
Ž .
29.7% test ingredient Tables 2 and 3 on a dry weight basis. Chromic oxide was used as an inert marker and incorporated into the reference and experimental diets at 1% inclusion level. All ingredients and the reference diet were ground to ensure a maximum
Ž .
particle size of 710 mm, then thoroughly mixed in a Hobart mixer Troy, OH, USA .
Approximately 400 ml distilled waterrkg dry mix was added to the dry mix prior to
Ž .
being pelleted through a meat mincer Barnco Australia, Leichhardt, NSW, Australia with a 1-, 1.5- or 2-mm die, depending on size of experimental fish. Pellets were dried at
-358C in a convection drier for approximately 6 h until the moisture content was
between 10% and 15%.
2.3. Laboratory facility
Twenty-seven 170-l cylindro-conical digestibility tanks, as described in Allan et al.
Ž1999 , were used in each experiment. Photo-period was set for a 12-h light. rdark cycle, Ž
beginning the light phase at 0600 h. During each experiment, nine treatments eight
.
experimental diets and the reference diet were established. In all cases, three treatment
Ž .
replicates ns3 were randomly allocated to digestibility tanks.
Fish were fed their respective diets once each morning using spring operated, conveyor belt feeders for a period of 3 h. Faeces were then allowed to settle overnight
Žapproximately 18 h after tanks and collection chambers were thoroughly cleaned to.
Ž .
remove any uneaten feed and accumulated waste Allan et al., 1999 . Faecal samples were collected each morning prior to feeding, dried under a vacuum at room temperature
Ž . Ž .
for 24 h 208C, silica gel and then frozen -158C . Daily faecal samples from each
()
G.L.
Allan
et
al.
r
Aquaculture
186
2000
293
–
310
296
Table 1
Ž .
Typical composition of commercial silver perch diet SP35
U UU
Ingredient Amount in Vitamin content in diet Mineral content in diet
a a
Ž .
SP35 % dry basis Vitamin IUrkg diet mgrkg diet Mineral mgrkg diet
Ž .
Fish meal 26.20 Retinol A 8000 Calcium carbonate 7500.0
Ž .
Soybean meal 20.19 Cholecalciferol D3 1000 Manganese sulphate monohydrate 300.0
Ž .
Blood meal 2.04 DL-a-tocopheryl acetate E 125.0 Zinc sulphate monohydrate 700.0
Ž .
Corn gluten meal 3.87 Menadione sodium bisulphite K3 16.5 Copper sulphate pentahydrate 60.0
Ž .
Wheat 27.47 Thiamin hydrochloride B1 10.0 Ferrous sulphate heptahydrate 500.0
Ž .
Sorghum 11.21 Riboflavin B2 25.2 Sodium chloride 7500.0
Ž .
Millrun 2.01 Pyridoxine hydrochloride B6 15.0 Potassium iodate 2.0
Cod liver oil 0.90 Folic acid 4.0
U Ž .
Vitamin premix 0.97 Ascorbic acid C 1000.0
UU
Mineral premix 2.81 CalciumD-pantothenate 55.0
Di-calcium phosphate 1.79 Myo-inositol 600.0
Ž . Ž .
DL-methionine 0.13 d-Biotin H 2% 1.0
Choline chloride 1500.0
Ž .
Crude protein % 38.7 Nicotinamide 200.0
Ž . Ž .
Gross energy MJrkg 18.0 Cyanocobalamin B12 0.02
Ž . Ž .
Digestible dry matter % 67.4 Ethoxyquin anti-oxidant 150.0
Ž . Ž .
Digestible protein % 34.6 Calcium propionate mould inhibitor 250.0
Ž .
Digestible energy % 13.9
a
( )
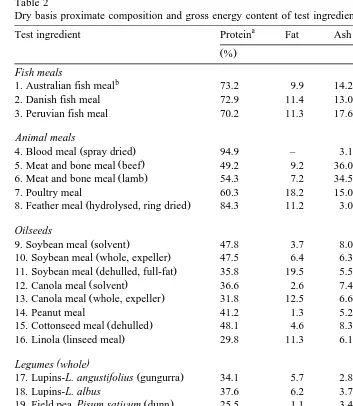
G.L. Allan et al.rAquaculture 186 2000 293–310 297 Table 2
Dry basis proximate composition and gross energy content of test ingredients
a
Test ingredient Protein Fat Ash GE Expt.
Ž .% ŽMJrkg.
Fish meals
b
1. Australian fish meal 73.2 9.9 14.2 21.3 6
2. Danish fish meal 72.9 11.4 13.0 21.5 6
3. Peruvian fish meal 70.2 11.3 17.6 20.9 7
Animal meals
7. Poultry meal 60.3 18.2 15.0 22.7 4
Ž .
8. Feather meal hydrolysed, ring dried 84.3 11.2 3.0 24.9 4
Oilseeds
Ž .
9. Soybean meal solvent 47.8 3.7 8.0 17.0 2
Ž .
10. Soybean meal whole, expeller 47.5 6.4 6.3 20.9 2
Ž .
11. Soybean meal dehulled, full-fat 35.8 19.5 5.5 23.3 2
Ž .
12. Canola meal solvent 36.6 2.6 7.4 19.9 2
Ž .
13. Canola meal whole, expeller 31.8 12.5 6.6 21.8 2
14. Peanut meal 41.2 1.3 5.2 19.7 11
Ž .
15. Cottonseed meal dehulled 48.1 4.6 8.3 19.9 10
Ž .
16. Linola linseed meal 29.8 11.3 6.1 21.2 2
( )
Legumes whole
Ž .
17. Lupins-L. angustifolius gungurra 34.1 5.7 2.8 17.9 3
18. Lupins-L. albus 37.6 6.2 3.7 20.9 3
Ž .
19. Field pea Pisum satiÕum dunn 25.5 1.1 3.4 17.0 1
Ž .
20. Faba bean Vicia faba fijord 27.7 1.3 3.6 17.3 1
Ž .
21. Chick pea Cicer arietinum desi 20.8 4.7 3.4 19.4 1
Ž .
22. Vetch V. satiÕa blanch flur 30.9 0.9 3.3 17.9 1
23. Cow peas Vigna unguiculata 25.2 2.3 3.7 18.8 8
Cereals
Water for use in all experiments was sourced directly from the fresh water treatment
Ž .
plant 0.5 grl salinity at PSRC. In the laboratory, this water was adjusted to the desired
Ž .
()
G.L.
Allan
et
al.
r
Aquaculture
186
2000
293
–
310
298
Table 3
Dry matter amino acid composition of test ingredients
Ž .
Test ingredient Amino acid %
Lys Met Cys Thr Arg Gly Ser His Ile Leu Phe Tyr Val Pro Ala Glu Asp
Fish meals
a
1. Australian fish meal 6.9 2.3 1.0 3.9 6.0 5.1 3.6 2.7 3.6 5.9 3.3 2.7 4.0 3.4 5.0 10.2 7.6
2. Danish fish meal 6.2 2.2 0.8 3.6 5.9 5.1 3.6 1.9 3.4 5.6 3.0 2.3 3.8 3.2 4.8 10.2 6.7
3. Peruvian fish meal 5.5 2.0 0.7 3.2 5.1 4.8 3.0 2.3 3.5 5.3 2.9 2.3 3.7 3.5 4.6 9.4 6.2
Animal meals
Ž .
4. Blood meal spray dried 8.0 1.5 1.4 5.4 3.9 4.1 6.1 5.6 0.9 12.0 6.6 3.0 8.2 3.7 7.9 9.4 10.3
Ž .
5. Meat and bone meal beef 2.5 0.7 0.3 1.6 3.9 7.7 2.1 0.8 1.3 2.7 1.5 1.1 2.0 5.0 3.9 5.7 3.3
Ž .
6. Meat and bone meal lamb 3.5 1.1 0.7 2.1 4.3 6.7 2.4 1.2 1.8 3.5 1.9 1.5 2.4 4.6 4.0 7.0 3.8
7. Poultry meal 4.0 1.5 1.0 2.8 4.5 5.9 3.1 1.7 2.9 4.7 2.6 2.1 3.3 4.0 4.3 9.1 5.5
Ž .
8. Feather meal hydrolysed, ring dried 2.3 0.7 6.8 4.7 6.7 7.1 11.4 1.1 4.9 8.0 4.6 2.7 7.3 9.3 4.6 10.3 6.6
Oilseeds
Ž .
9. Soybean meal solvent 3.3 0.7 0.9 2.1 3.7 2.1 2.9 1.3 2.5 3.8 2.6 1.9 2.6 2.6 2.1 9.3 5.8
Ž .
10. Soybean meal whole, expeller 3.0 0.8 1.0 2.1 3.7 2.1 2.9 1.3 2.4 3.8 2.5 1.8 2.5 2.5 2.1 9.2 5.7
Ž .
11. Soybean meal dehulled, full-fat 2.3 0.6 0.8 1.5 2.6 1.5 2.2 0.9 1.7 2.8 1.8 1.3 1.8 1.8 1.5 6.6 4.1
Ž .
12. Canola meal solvent 2.0 0.9 1.1 1.7 2.2 1.9 1.8 1.0 1.7 2.7 1.5 1.1 2.1 2.4 1.6 6.7 2.5
Ž .
13. Canola meal whole, expeller 1.7 0.9 1.1 1.5 2.1 1.7 1.7 0.9 1.5 2.3 1.3 1.0 1.8 2.1 1.5 6.2 2.4
14. Peanut meal 1.7 0.5 0.7 1.5 7.2 3.1 2.9 1.2 2.0 3.5 2.8 2.1 2.3 3.4 2.2 10.9 6.4
Ž .
15. Cottonseed meal dehulled 2.1 1.0 1.1 1.8 6.0 2.0 2.4 1.4 1.7 3.0 2.7 1.5 2.1 2.2 1.9 10.7 4.8
Ž .
()
G.L.
Allan
et
al.
r
Aquaculture
186
2000
293
–
310
299
( )
Legumes whole
Ž .
17. Lupins-L. angustifolius gungurra 1.4 0.2 0.6 1.3 4.0 1.4 2.1 0.9 1.4 2.4 1.3 1.4 1.3 1.6 1.2 8.2 3.8
18. Lupins-L. albus 1.5 0.3 0.9 1.5 4.1 1.5 2.3 0.9 1.7 2.8 1.4 1.8 1.6 1.7 1.3 8.4 4.3
Ž .
19. Field pea P. satiÕum dunn 1.7 0.3 0.5 0.8 2.5 1.0 1.3 0.6 1.1 1.7 1.1 0.8 1.2 1.1 1.1 4.3 2.9
Ž .
20. Faba bean V. faba fijord 1.5 0.3 0.5 0.8 2.8 1.0 1.4 0.6 1.1 1.8 1.1 0.8 1.2 1.3 1.1 4.2 2.8
21. Chick pea C. arietinum 1.5 0.4 0.5 0.8 2.0 0.8 1.3 0.5 1.0 1.6 1.2 0.6 1.0 1.0 0.9 3.6 2.5
Ž .
22. Vetch V. satiÕa blanch flur 1.7 0.3 0.5 0.8 2.4 1.1 1.4 0.6 1.2 1.9 1.1 0.8 1.3 1.2 1.2 5.1 3.4
23. Cow peas Vig. unguiculata 1.8 0.4 0.3 1.0 2.2 1.1 1.4 0.8 1.2 2.0 1.4 0.9 1.3 1.3 1.1 4.7 3.0
Cereals
24. Wheat gluten 1.7 1.3 2.1 2.8 3.4 3.3 5.3 2.0 3.7 6.7 5.1 3.5 3.9 12.2 2.5 35.6 3.3
25. Corn gluten meal 1.1 1.6 1.4 2.2 2.0 1.6 3.6 1.1 3.0 11.3 4.1 3.4 3.1 5.8 5.8 14.6 4.2
Ž .
26. Wheat 1 Aust. Std. Wheat 0.3 0.2 0.4 0.3 0.5 0.5 0.6 0.2 0.4 0.8 0.5 0.3 0.5 1.1 0.4 3.3 0.6
Ž .
27. Wheat 2 high protein 0.3 0.3 0.5 0.4 0.6 0.5 0.7 0.3 0.5 1.0 0.6 0.5 0.6 1.4 0.5 4.4 0.7
28. Millrun 1.0 0.5 0.6 0.8 1.5 1.1 1.1 0.4 0.7 1.4 0.8 0.6 1.0 1.3 1.1 4.1 1.6
29. Sorghum 0.3 0.3 0.3 0.5 0.6 0.4 0.7 0.3 0.6 1.8 0.7 0.6 0.7 1.2 1.2 3.1 1.0
a
( ) G.L. Allan et al.rAquaculture 186 2000 293–310
300
then supplied to experimental tanks at a flow rate of approximately 600 mlrmin.
Effluent water drained from experimental tanks via standpipes and 20–25% of this water was discarded. The rest was collected in a common sump and recirculated through a 2000-l biological filter for re-use in the laboratory. Each digestibility tank contained two air stone diffusers. During all experiments, dissolved oxygen was maintained above 5.0
mgrl, pH between 7.2 and 8.5 and water temperature between 23.28C and 28.08C.
Ž . Ž .
Nitrite NO –N and ammonia total ammonia–N was measured weekly following2
Ž .
methods described in Allan et al. 1990 , and levels did not exceed 0.2 and 0.3 mgrl,
respectively.
2.5. Chemical analyses
All chemical analyses of feed and faecal samples were done in duplicate. Dry matter,
Ž .
ash and energy bomb calorimetry were determined using procedures described in
Ž .
AOAC 1990 . Nitrogen was determined using Kjeldahl or semi-micro Kjeldahl methods
ŽAOAC, 1990 and crude protein content estimated by multiplying nitrogen by 6.25..
Ž .
Chromic oxide was determined by the method described in Scott 1978 . Amino acids were analysed following acid hydrolysis using high pressure liquid chromatography and
Ž .
Waters Pico-Tag Waters, Lane Cove, NSW, Australia . Sulphur amino acids were determined separately following performic acid digestion, and tryptophan, which is lost
Ž .
during acid hydrolysis, was not determined Cohen et al., 1989 .
2.6. Digestibility determinations
Ž .
Apparent digestibility coefficients ADCs for dry matter, energy, nitrogen and
availability of amino acids for the reference and test diets were calculated by the
Ž . w Ž .x
formula, ADC % s100= 1y FrD=DCrrFCr where F is the percent of nutrient
or energy in faeces, D is the percent of nutrient or energy in diet, DC is the percent ofr
Ž
chromic oxide in diet and FCr is the percent of chromic oxide in faeces Cho and
. Ž .
Kaushik, 1990 . Then, ADCs availability for ingredients were determined after the individual contribution of nutrients or energy from the reference diet and test ingredients
Ž . Ž
were considered. The following formula was applied: ADING % s NutrTD=ADTDy
. Ž .
0.69=NutrRD=ADRD r0.29=NutrING , where ADING is apparent digestibility
Žavailability of nutrient or energy in the test ingredient, Nutr. TD is the nutrient or energy
Ž .
concentration in test diet, ADTD is the apparent digestibility availability of the nutrient or energy in the test diet, NutrRD is the nutrient or energy concentration in the reference
Ž .
diet, ADRD is the apparent digestibility availability of nutrient or energy in the
reference diet and NutrING is the nutrient or energy concentration in the test ingredient
ŽSugiura et al., 1998 ..
3. Results
Ž .
( )
G.L. Allan et al.rAquaculture 186 2000 293–310 301
crude protein than oilseeds, legumes or cereals. Lysine was highest in blood meal and fish meals, followed by some of the other terrestrial animal meals, oilseeds, legumes and cereals. Gross energy value for all ingredients ranged from 16.1, for meat and bone
Ž .
meals beef , to 24.9 MJrkg, for feather meal.
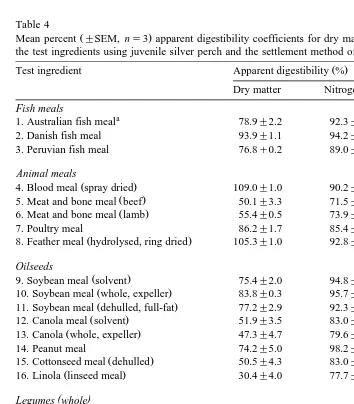
Digestibility coefficients for dry matter, protein and energy and availability
coeffi-Ž .
cients for amino acids are tabulated Tables 4 and 5 . Occasionally, values over 100%
Table 4
Ž .
Mean percent "SEM, ns3 apparent digestibility coefficients for dry matter, nitrogen and gross energy of the test ingredients using juvenile silver perch and the settlement method of faeces collection
Ž .
Test ingredient Apparent digestibility %
Dry matter Nitrogen Energy
Fish meals
a
1. Australian fish meal 78.9"2.2 92.3"0.4 89.6"2.2 2. Danish fish meal 93.9"1.1 94.2"0.8 98.0"0.5
3. Peruvian fish meal 76.8q0.2 89.0"1.6 88.6"0.6
Animal meals
Ž .
4. Blood meal spray dried 109.0"1.0 90.2"0.7 99.9"1.0
Ž .
8. Feather meal hydrolysed, ring dried 105.3"1.0 92.8"0.7 101.0"0.5
Oilseeds
Ž .
9. Soybean meal solvent 75.4"2.0 94.8"0.6 78.0"1.6
Ž .
10. Soybean meal whole, expeller 83.8"0.3 95.7"0.1 84.1"0.3
Ž .
11. Soybean meal dehulled, full-fat 77.2"2.9 92.3"1.7 79.8"2.0
Ž .
12. Canola meal solvent 51.9"3.5 83.0"1.2 58.1"2.7
Ž .
13. Canola whole, expeller 47.3"4.7 79.6"3.0 58.6"2.6
14. Peanut meal 74.2"5.0 98.2"6.0 77.0"3.5
Ž .
15. Cottonseed meal dehulled 50.5"4.3 83.0"1.0 53.1"3.0
Ž .
16. Linola linseed meal 30.4"4.0 77.7"1.2 44.3"2.8
( )
Legumes whole
Ž .
17. Lupins-L. angustifolius gungurra 52.4"3.0 97.1"0.9 51.2"1.0 18. Lupins-L. albus 66.8"0.4 95.9"0.9 70.1"1.6
21. Chick pea C. arietinum desi 50.8"0.8 82.2"1.7 54.8"0.7
Ž .
22. Vetch V. satiÕa blanch flur 43.5"3.2 71.2"3.0 52.8"1.0 23. Cow peas Vig. unguiculata 42.6"8.5 96.5"1.4 44.7"5.9
Cereals
24. Wheat gluten 90.6"2.0 99.8"0.7 94.0"1.1
25. Corn gluten meal 113.4"0.7 95.4"0.7 104.5"0.3
()
G.L.
Allan
et
al.
r
Aquaculture
186
2000
293
–
310
302
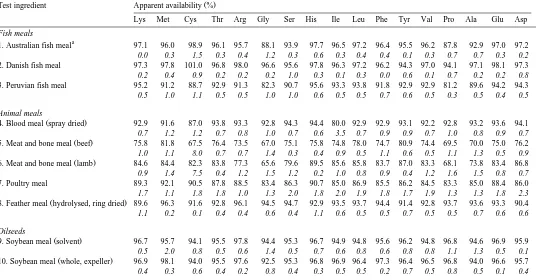
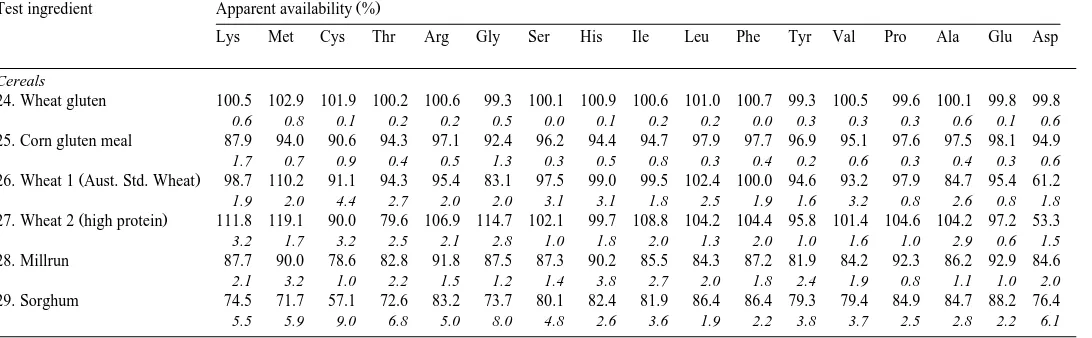
Table 5
Ž .
Mean percent "SEM in italics, ns3 apparent availability coefficients of amino acids in test ingredients as fed to juvenile silver perch using the settlement method of faeces collection
Ž .
Test ingredient Apparent availability %
Lys Met Cys Thr Arg Gly Ser His Ile Leu Phe Tyr Val Pro Ala Glu Asp
Fish meals
a
1. Australian fish meal 97.1 96.0 98.9 96.1 95.7 88.1 93.9 97.7 96.5 97.2 96.4 95.5 96.2 87.8 92.9 97.0 97.2
0.0 0.3 1.5 0.3 0.4 1.2 0.3 0.6 0.3 0.4 0.4 0.1 0.3 0.7 0.7 0.3 0.2
2. Danish fish meal 97.3 97.8 101.0 96.8 98.0 96.6 95.6 97.8 96.3 97.2 96.2 94.3 97.0 94.1 97.1 98.1 97.3
0.2 0.4 0.9 0.2 0.2 0.2 1.0 0.3 0.1 0.3 0.0 0.6 0.1 0.7 0.2 0.2 0.8
3. Peruvian fish meal 95.2 91.2 88.7 92.9 91.3 82.3 90.7 95.6 93.3 93.8 91.8 92.9 92.9 81.2 89.6 94.2 94.3
0.5 1.0 1.1 0.5 0.5 1.0 1.0 0.6 0.5 0.5 0.7 0.6 0.5 0.3 0.5 0.4 0.5
Animal meals
Ž .
4. Blood meal spray dried 92.9 91.6 87.0 93.8 93.3 92.8 94.3 94.4 80.0 92.9 92.9 93.1 92.2 92.8 93.2 93.6 94.1
0.7 1.2 1.2 0.7 0.8 1.0 0.7 0.6 3.5 0.7 0.9 0.9 0.7 1.0 0.8 0.9 0.7 Ž .
5. Meat and bone meal beef 75.8 81.8 67.5 76.4 73.5 67.0 75.1 75.8 74.8 78.0 74.7 80.9 74.4 69.5 70.0 75.0 76.2
1.0 1.1 8.0 0.7 0.7 1.4 0.3 0.4 0.9 0.5 1.1 0.6 0.5 1.1 1.3 0.5 0.9 Ž .
6. Meat and bone meal lamb 84.6 84.4 82.3 83.8 77.3 65.6 79.6 89.5 85.6 85.8 83.7 87.0 83.3 68.1 73.8 83.4 86.8
0.9 1.4 7.5 0.4 1.2 1.5 1.2 0.2 1.0 0.8 0.9 0.4 1.2 1.6 1.5 0.8 0.7
7. Poultry meal 89.3 92.1 90.5 87.8 88.5 83.4 86.3 90.7 85.0 86.9 85.5 86.2 84.5 83.3 85.0 88.4 86.0
1.7 1.1 1.8 1.8 1.0 1.3 2.0 1.8 2.0 1.9 1.8 1.7 1.9 1.3 1.3 1.8 2.3
Ž .
8. Feather meal hydrolysed, ring dried 89.6 96.3 91.6 92.8 96.1 94.5 94.7 92.9 93.5 93.7 94.4 91.4 92.8 93.7 93.6 93.3 90.4
1.1 0.2 0.1 0.4 0.4 0.6 0.4 1.1 0.6 0.5 0.5 0.7 0.5 0.5 0.7 0.6 0.6
Oilseeds
Ž .
9. Soybean meal solvent 96.7 95.7 94.1 95.5 97.8 94.4 95.3 96.7 94.9 94.8 95.6 96.2 94.8 96.8 94.6 96.9 95.9
0.5 2.0 0.8 0.5 0.6 1.4 0.5 0.7 0.6 0.8 0.6 0.8 0.8 1.1 1.3 0.5 0.1
Ž .
10. Soybean meal whole, expeller 96.9 98.1 94.0 95.5 97.6 92.5 95.3 96.8 96.9 96.4 97.3 96.4 96.5 96.8 94.0 96.6 95.7
()
G.L.
Allan
et
al.
r
Aquaculture
186
2000
293
–
310
303
Ž .
11. Soybean meal dehulled, full-fat 94.5 95.7 96.5 94.0 95.4 88.5 93.7 94.2 92.0 92.2 93.1 93.6 91.2 94.7 91.4 94.5 92.3
0.9 1.8 1.5 0.6 0.7 2.5 0.7 0.7 0.7 0.8 0.8 0.6 1.1 1.7 1.4 0.4 0.5
Ž .
12. Canola meal solvent 86.2 89.2 79.8 87.9 91.7 85.0 85.9 91.7 84.6 87.8 88.0 89.8 84.6 84.8 86.0 91.4 82.5
0.7 1.5 3.5 0.6 0.7 2.0 1.3 1.0 1.0 1.2 1.0 0.8 1.1 1.2 1.7 0.9 1.9
Ž .
13. Canola meal whole, expeller 85.5 85.2 79.8 85.5 91.2 82.0 81.9 90.3 84.5 86.1 87.3 86.6 84.9 82.0 83.7 90.6 82.0
1.8 3.9 3.4 1.5 1.6 3.7 2.1 1.1 2.4 2.2 2.3 2.3 2.1 2.9 3.3 1.1 2.0
14. Peanut meal 89.5 97.8 97.5 90.3 96.3 85.8 91.7 94.7 91.9 92.3 94.1 96.7 92.5 90.8 91.9 95.2 94.7
2.7 2.6 2.6 2.3 0.8 3.3 1.6 1.6 2.1 2.0 1.6 3.4 1.9 4.8 2.3 0.9 0.8
Ž .
15. Cottonseed meal dehulled 60.4 74.4 79.3 77.7 91.3 77.1 81.0 87.4 74.3 75.1 82.5 82.8 76.8 82.7 75.5 88.6 84.7
0.6 5.3 2.6 1.1 0.4 1.6 1.9 2.0 1.5 1.1 0.9 1.0 1.5 1.8 1.2 0.7 1.9
Ž .
16. Linola linseed meal 80.6 89.1 74.2 78.8 91.6 74.2 81.3 79.5 84.6 80.9 85.5 83.3 82.6 72.3 78.6 86.9 79.8
1.4 0.9 1.9 1.7 0.9 1.6 1.1 1.5 1.3 0.8 1.4 1.4 1.5 1.7 1.7 0.7 1.0
Legumes
Ž .
17. Lupin-L. angustifolius gungurra 99.7 87.4 79.5 98.3 99.3 107.4 93.0 102.2 96.7 96.6 97.8 96.1 97.0 98.5 102.5 95.8 90.0
2.1 23.1 2.0 2.1 0.9 3.5 2.5 2.8 2.3 2.5 2.7 2.5 2.7 4.4 2.8 1.4 2.1
18. Lupin-L. albus 99.2 102.2 84.8 97.9 99.3 107.8 94.3 100.3 94.9 95.7 96.3 95.4 95.5 99.5 102.5 96.2 93.3
0.5 4.5 4.4 0.5 0.5 2.7 0.9 2.3 1.0 1.0 1.0 0.4 1.5 1.6 1.9 1.0 1.1
Ž .
19. Field pea P. satiÕum dunn 86.1 67.8 60.8 74.5 88.9 69.2 72.8 79.2 78.0 78.8 79.8 78.5 75.9 70.6 76.8 84.7 81.8
1.3 5.6 1.4 1.8 1.0 1.5 0.8 3.3 2.4 2.4 1.7 1.0 1.8 0.2 1.8 0.7 1.3
Ž .
20. Faba bean V. faba fijord 88.7 81.9 81.5 82.3 93.5 78.3 85.0 86.9 83.1 87.4 85.4 83.3 82.9 84.6 83.6 88.7 84.5
0.4 2.2 0.7 1.8 0.9 0.4 0.7 2.4 1.2 2.8 1.0 0.8 1.0 0.5 1.6 0.5 0.4 Ž .
21. Chick pea C. arietinum desi 76.1 75.4 64.1 57.6 80.6 56.9 65.3 73.3 60.8 65.8 66.0 61.8 58.4 60.4 59.3 71.9 66.5
1.0 2.6 3.4 2.0 0.7 2.5 1.2 1.8 1.5 1.2 1.3 2.1 1.5 1.6 1.4 0.6 0.9
Ž .
22. Vetch V. satiÕa blanch flur 64.9 42.0 48.4 42.1 75.9 51.8 53.3 63.2 58.4 60.1 50.2 52.0 56.0 50.4 53.8 69.6 66.9
1.8 2.6 10.3 1.2 0.4 1.6 1.7 1.2 1.0 0.6 1.1 1.3 0.5 1.2 1.8 0.2 1.4
23. Cow peas Vig. unguiculata 76.3 83.8 86.6 78.9 85.2 65.1 85.1 85.7 73.7 76.9 73.0 70.6 75.8 90.4 76.8 83.3 83.7
1.6 1.9 5.0 1.5 1.2 3.6 1.5 1.9 2.3 1.8 2.2 2.8 1.8 1.6 2.1 1.0 1.3
()
G.L.
Allan
et
al.
r
Aquaculture
186
2000
293
–
310
304
Ž )
Table 5 continued
Ž .
Test ingredient Apparent availability %
Lys Met Cys Thr Arg Gly Ser His Ile Leu Phe Tyr Val Pro Ala Glu Asp
Cereals
24. Wheat gluten 100.5 102.9 101.9 100.2 100.6 99.3 100.1 100.9 100.6 101.0 100.7 99.3 100.5 99.6 100.1 99.8 99.8
0.6 0.8 0.1 0.2 0.2 0.5 0.0 0.1 0.2 0.2 0.0 0.3 0.3 0.3 0.6 0.1 0.6
25. Corn gluten meal 87.9 94.0 90.6 94.3 97.1 92.4 96.2 94.4 94.7 97.9 97.7 96.9 95.1 97.6 97.5 98.1 94.9
1.7 0.7 0.9 0.4 0.5 1.3 0.3 0.5 0.8 0.3 0.4 0.2 0.6 0.3 0.4 0.3 0.6
Ž .
26. Wheat 1 Aust. Std. Wheat 98.7 110.2 91.1 94.3 95.4 83.1 97.5 99.0 99.5 102.4 100.0 94.6 93.2 97.9 84.7 95.4 61.2
1.9 2.0 4.4 2.7 2.0 2.0 3.1 3.1 1.8 2.5 1.9 1.6 3.2 0.8 2.6 0.8 1.8
Ž .
27. Wheat 2 high protein 111.8 119.1 90.0 79.6 106.9 114.7 102.1 99.7 108.8 104.2 104.4 95.8 101.4 104.6 104.2 97.2 53.3
3.2 1.7 3.2 2.5 2.1 2.8 1.0 1.8 2.0 1.3 2.0 1.0 1.6 1.0 2.9 0.6 1.5
28. Millrun 87.7 90.0 78.6 82.8 91.8 87.5 87.3 90.2 85.5 84.3 87.2 81.9 84.2 92.3 86.2 92.9 84.6
2.1 3.2 1.0 2.2 1.5 1.2 1.4 3.8 2.7 2.0 1.8 2.4 1.9 0.8 1.1 1.0 2.0
29. Sorghum 74.5 71.7 57.1 72.6 83.2 73.7 80.1 82.4 81.9 86.4 86.4 79.3 79.4 84.9 84.7 88.2 76.4
5.5 5.9 9.0 6.8 5.0 8.0 4.8 2.6 3.6 1.9 2.2 3.8 3.7 2.5 2.8 2.2 6.1
a
( )
G.L. Allan et al.rAquaculture 186 2000 293–310 305
were recorded. This may have been due to minor errors in measurement, which are compounded in calculations used to estimate digestibility coefficients, possible interac-tions between nutrients in the reference diet and test ingredients or differential leaching of some nutrients within ingredients. The exact values calculated are presented here
although it should be noted that values )100% were rounded off to 100% for
subsequent least-cost diet formulation. For dry matter, digestibility values exceeding 75% were recorded for fish meals, blood meal, poultry products, soybean and gluten from wheat and corn. Values for all other ingredients were above 50% except for
Ž . Ž . Ž . Ž .
expeller canola 47.3% , linola 30.4% , vetch 43.5% , high protein wheat 36% and
Ž .
sorghum 36.4% . Protein was generally well digested in most ingredients with only
Ž .
meat meal and bone meal from lamb and beef , expeller canola, linola and vetch yielding protein digestibility coefficients below 80%.
Dry matter digestibility coefficients were reliable indicators for energy digestibility for all ingredients, except for meat meal and bone meals, which had low dry matter
Ž . Ž .
digestibility due to high ash content but high energy digestibility, and canola expeller ,
Ž
linola and vetch, which also had low dry matter digestibility due to poor protein
.
digestibility but high energy digestibility.
In general, amino acid availability reflected crude protein digestibility; however, for some ingredients, there were some major differences in availability of different amino acids. For the fish meals, Peruvian fish meal had lower availability of glycine and proline compared with the availability of the other amino acids. Availability of amino acids for the other fish meals were similar. For the animal meals, amino acid availability was quite different for blood meal and the two meat and bone meals, but similar for the poultry ingredients. Isoleucine availability was relatively low for blood meal while glycine, proline and cystine were low for meat and bone meal. Among the oilseeds,
Ž .
differences in availability were evident for canola cystine was lowest , cottonseed meal
Žlysine was lowest and linola proline was lowest . For the legumes, cystine availability. Ž .
was relatively low for lupins and field peas, glycine for faba beans, while chick peas and cow peas had several amino acids, which were less available. Among the cereals, availability of amino acids were similar, except for sorghum where cystine was less available than the other amino acids.
4. Discussion
The preference for fish meal as the major protein source in formulated feeds for aquaculture is easily understood by the very high digestibility of dry matter, energy, nitrogen and the availability of amino acids. Results for silver perch agree well with
Ž
high digestibility coefficients recorded for other species including salmonids Cho et al.,
.
1982; Hajen et al., 1993a; Gomes et al., 1995; Smith, 1995; Sugiura et al., 1998 , red
Ž . Ž .
drum McGoogan and Reigh, 1996 , hybrid striped bass Sullivan and Reigh, 1995 ,
Ž . Ž .
channel catfish Robinson, 1989; Wilson, 1991 , European eel Schmitz et al., 1984 ,
Ž . Ž
tilapia Hanley, 1987; El-Sayed and Teshima, 1991; Luquet, 1991 and carp Jauncey,
.
1982 .
Digestibility of several other ingredients, including some animal meals, and protein
Ž .
( ) G.L. Allan et al.rAquaculture 186 2000 293–310
306
Ž
ingredients with relatively high total protein content e.g., blood meal, poultry offal
.
meal, feather meal and gluten meal , total digestible dry matter, and digestible energy were similar to fish meals and digestible nitrogen was in the range 85–99%, compared with 89–94% for fish meals. The disadvantage of these well digested, high protein ingredients, compared with fish meal, was that the essential amino acid contents, profile and availability of these ingredients were inferior to fish meals.
Silver perch were capable of digesting protein very effectively in almost all
ingredi-Ž
ents tested. This finding supports results with most species Cho et al., 1982; Ash, 1985;
.
Sullivan and Reigh, 1995; McGoogan and Reigh, 1996 . Nitrogen digestibility coeffi-cients over 90% were recorded for ingredients such as fish meal, soybean meal, peanut
Ž .
meal, lupins and wheat in which protein content is in the range 15–73%. Ash 1985 also reported that protein digestibility was unaffected by the protein content. However, a positive correlation between protein digestibility and ingredient protein content has been
Ž
reported for other species including trout and red drum Serrano et al., 1992; Smith et
.
al., 1995; McGoogan and Reigh, 1996 .
In the present study, relatively low protein digestibility coefficients were recorded for
Ž
some plant ingredients with known anti-nutritional components, such as vetch Petterson
. Ž .
and Mackintosh, 1994 and canola Evans, 1985 , and some of the terrestrial animal meals. Excessive heat during the rendering process can damage proteins, especially
Ž
lysine, and contribute to low nitrogen digestibility of animal meals Carpenter and
. Ž .
Booth, 1973 . Opstvedt et al. 1984 found cooking pollock or mackerel reduced protein digestibility and amino acid availability for rainbow trout and postulated that this was due to heat-induced denaturation and cross-linkage. In addition, digestibility of protein from bone, feathers and connective tissue may not be as well digested as protein from
Ž . Ž .
muscle NRC, 1993 . McGoogan and Reigh 1996 reported that protein digestibility with red drum was highest for ingredients with less than 2% fibre, but beyond this level,
Ž .
fibre content as indicative of carbohydrate content and protein digestibility were not
Ž .
related. Conversely, Hepher 1985 reported that protein digestibility was negatively
Ž .
correlated with the dietary carbohydrate content, and Falge et al. 1978 proposed that
Ž .
high contents of carbohydrates reduce proteolytic enzyme activity. Wee 1992 con-cluded that undigested carbohydrate passed rapidly out of the gut taking some undi-gested protein with it, thus affecting protein digestibility. Our nitrogen digestibility coefficients of over 99% for wheat, with only 12–15% protein and over 80%
carbo-Ž . Ž . Ž .
hydrates Novus, 1992 suggests that neither Falge et al.’s 1978 nor Wee’s 1992
Ž .
hypothesis apply to silver perch. Storebakken et al. 1998 reported that increased
Ž .
dietary carbohydrate 10–20% reduced dry matter, energy and fat digestibility but had little effect on protein digestibility for rainbow trout. Recent research indicates silver
Ž
perch are relatively effective at digesting and utilising starch Stone et al., unpublished
.
data and this may explain the apparent lack of a relationship between carbohydrate content and nitrogen digestibility for silver perch.
( )
G.L. Allan et al.rAquaculture 186 2000 293–310 307
protein. The meat and bone meals have lower availability coefficients for lysine than any other fish or animal meals tested. This may indicate heat damage to lysine during the
Ž .
rendering process Carpenter and Booth, 1973; Opstvedt et al., 1984 or possibly
reduced digestibility of protein in bone fragments. The same pattern of amino acid availability coefficients was not evident for poultry offal meal or feather meal.
Ž
For blood meal, the imbalance in isoleucine and leucine very low isoleucine and
. Ž .
very high leucine was compounded by the poor availability of isoleucine 80.0%
Ž .
compared with leucine 92.9% . For canola meal and cotton seed meal, plus several legumes, the availability coefficients for the sulphur amino acids tended to be lower than for most other amino acids, compounding the problem of low sulphur amino acid
Ž .
content Swick, 1995 .
In common with most studies, dry matter and energy digestibility coefficients for
Ž
silver perch were lower for plant ingredients with high carbohydrate contents Cho et al., 1982; Robinson, 1988; Wilson, 1991; Hajen et al., 1993a; Gomes et al., 1995; Sullivan
.
and Reigh, 1995; McGoogan and Reigh, 1996 . Digestibility of carbohydrate in fish is
Ž .
affected by the type of carbohydrate and the digestive system in the fish Wee, 1992 . Digestibility decreases with an increase in carbohydrate structural complexity and some
Ž .
species are also poorly equipped to absorb digested carbohydrates Wee, 1992 . Clearly, removing or reducing the carbohydrate component, as in the wheat or corn gluten meals,
Ž . Ž
results in major increases in dry matter and energy digestibility Table 4 . Allan et al. in
.
press found dehulling lupins removed a significant amount of non-starch polysaccharide and improved dry matter and energy digestibility for this grain legume fed to silver perch.
Ž
Most fish studied have efficient lipid digestibility Cho et al., 1982; Sargent et al.,
.
1989; Sullivan and Reigh, 1995 and results reported here for silver perch indicate the energy from lipids in the fish meals, poultry offal and feather meals, and the wheat and corn gluten meals, were well digested. Lower values of digestibility coefficients for the two meat and bone meals may indicate lower digestibility of saturated lipids in these
Ž .
ingredients. McGoogan and Reigh 1996 also recorded low energy digestibility coeffi-cients for meat and bone meal for red drum.
Comparison of digestibility coefficients for any ingredients between species is compromised because of differences in methodology used. Although several authors have reported close agreement in digestibility coefficients derived using different
Ž .
methods of obtaining faeces e.g., Cho et al., 1982; Hajen et al., 1993b , others have
Ž .
found large discrepancies Smith et al., 1980 . Provided the same method is used for different ingredients for a single species, the comparison between ingredients is valid and these data are critical if diets are to be formulated from a variety of ingredients with
Ž
balanced digestible energy and digestible nutrient contents Cho and Kaushik, 1990; Cho
.
et al., 1982; Gomes et al., 1995 . As the assumption that digestibility coefficients
Ž
calculated separately for different ingredients are additive for silver perch Allan et al.,
.
( ) G.L. Allan et al.rAquaculture 186 2000 293–310
308
Acknowledgements
We wish to thank the following NSW Fisheries staff for assistance with breeding silver perch, running experiments and preparing the manuscript: Charlie Mifsud, David Glendenning, Paul Robertson, Tanya Sushames, Jo Pickles and Helena Heasman. Ken
Ž .
O’Brien and Wendy Peasley NSW Agriculture carried out biochemical analysis. The manuscript was critically reviewed by Drs. John Nell and Wayne O’Connor. The research was part of the Australian Fisheries Research and Development Sub-Program
Ž .
on fish meal replacement 93r120 . Additional support was also provided by the
Australian Centre for International Agricultural Research, the Australian Grains Re-search and Development and the Australian Meat ReRe-search.
References
Ž .
Australian Bureau of Agricultural and Resource Economics ABARE , 1998. Australian Fisheries Statistics. Australian Bureau of Agricultural and Resource Economics, Canberra, ACT, Australia.
Akiyama, D.M., 1991. Future consideration for the aquaculture feed industry. In: Akiyama, E.M., Tan, R.K.H.
ŽEds. , Proceedings of Aquaculture Feed Processing and Nutrition Workshop, Thailand and Indonesia,.
September 19–25. American Soybean Association, Singapore, pp. 5–9.
Allan, G.L., Gleeson, V.P., Evans, A.J., Stone, D.A.J., in press. Replacement of fish meal in diets for Australian silver perch, Bidyanus bidyanus: II. digestibility of lupins. Aquaculture.
Allan, G.L., Maguire, G.B., Hopkins, S.J., 1990. Acute and chronic toxicity of ammonia to juvenile
Metapenaeus macleayi and Penaeus monodon and the influence of low dissolved-oxygen levels.
Aquacul-ture 91, 265–280.
Ž .
Allan, G.L., Rowland, S., 1992. Development of an experimental diet for silver perch Bidyanus bidyanus . Austasia Aquacult. 6, 39–40.
Allan, G.L., Rowland, S.J., Parkinson, S., Stone, D.A.J., Jantrarotai, W., 1999. Nutrient digestibility for juvenile silver perch: development of methods. Aquaculture 170, 131–145.
Ž .
Association of the Official Analytical Chemists AOAC , 1990. Official Methods of Analysis of the Association of Official Analytical Chemists. 15th edn. AOAC, Arlington, VA, USA.
Ž .
Ash, R., 1985. Protein digestion and absorption. In: Cowey, C.B., Mackie, A.M., Bell, J.G. Eds. , Nutrition and Feeding in Fish. Academic Press, New York, pp. 69–93.
Australasian Agribusiness Services, 1993. The meat meal and tallow industry and its markets. Main report prepared for the Meat Research.
Carpenter, K.J., Booth, V.H., 1973. Damage to lysine in food processing: its measurement and its significance. Nutr. Abstr. Rev. 43, 424–451.
Cho, C.Y., Kaushik, S.J., 1990. Nutritional energetics in fish: energy and protein utilisation in rainbow trout
ŽSalmo gairdneri . World Rev. Nutr. Diet. 61, 132–172..
Cho, C.Y., Slinger, S.J., Bayley, H.S., 1982. Bioenergetics of salmonid fishes: energy intake, expenditure and productivity. Comp. Biochem. Physiol. 73B, 25–41.
Cohen, S.A., Tarven, T.L., Meys, M., 1989. The pico tag method. In: A Manual of Advanced Techniques for Amino Acid Analysis. Waters, Milford, MA, 123 pp.
El-Sayed, A.-F.M., Teshima, S.I., 1991. Tilapia nutrition in aquaculture. Rev. Aquat. Sci. 5, 247–265. Evans, M., 1985. Nutrient composition of feedstuffs for pigs and poultry, Queensland Department of Primary
Industries, Brisbane, Qld, Australia, 135 pp.
( )
G.L. Allan et al.rAquaculture 186 2000 293–310 309 Gomes, E.F., Rema, P., Kaushik, S.J., 1995. Replacement of fish meal by plant proteins in the diet of rainbow
Ž .
trout Oncorhynchus mykiss : digestibility and growth performance. Aquaculture 130, 177–186. Hajen, W.E., Higgs, D.A., Beames, R.M., Dosanjh, B.S., 1993a. Digestibility of various feedstuffs by
Ž .
post-juvenile chinook salmon Oncorhynchus tshawytscha in sea water: 1. Validation of technique.
Aquaculture 112, 321–332.
Hajen, W.E., Higgs, D.A., Beames, R.M., Dosanjh, B.S., 1993b. Digestibility of various feedstuffs by
Ž .
post-juvenile chinook salmon Oncorhynchus tshawytscha in sea water: 2. Measurement of digestibility. Aquaculture 112, 333–348.
Hanley, F., 1987. The digestibility of foodstuffs and the effects of feeding selectivity on digestibility
Ž .
determinations in tilapia, Oreochromis niloticus L . Aquaculture 66, 163–179. Hardy, R.W., Kissil, G.W.M., 1997. Trends in aquaculture feeding. Feed Mix 5, 31–34. Hepher, B., 1985. Nutrition of Pond Fishes. Cambridge Univ. Press, Cambridge, UK, 388 pp.
Ž . Ž .
Jauncey, K., 1982. Carp Cyprinus carpio L. nutrition — a review. In: Muir, J.F., Roberts, R.J. Eds. , Recent Advances in Aquaculture. Croom Helm, London, UK, pp. 217–263.
Ž .
Luquet, P., 1991. Tilapia, Oreochromis spp. In: Wilson, R.P. Ed. , Handbook of Nutrient Requirements of Finfish. CRC Press, Boca Raton, FL, pp. 169–179.
Manzi, J.J., 1989. Aquaculture research priorities for the 1990s. World Aquacult. 20, 29–32.
Ž
McGoogan, B.B., Reigh, R.C., 1996. Apparent digestibility of selected ingredients in red drum Sciaenops
.
ocellatus diets. Aquaculture 141, 233–244.
Ž .
National Research Council NRC , 1993. Nutrient Requirements of Fish. National Academy Press, Washing-ton, DC, 114 pp.
NOVUS, 1992. Raw Material Compendium: A Compendium of Worldwide Data Sources. Novus, Brussels, 511 pp.
Opstvedt, J., Miller, R., Hardy, R., Spinelli, J., 1984. Heat-induced changes in sulfhydryl groups and disulfide
Ž
bonds in fish protein and their effect on protein and amino acid digestibility in rainbow trout Salmo
.
gairdneri . J. Agric. Food Chem. 32, 929–935.
Petterson, D.S., Mackintosh, J.B., 1994. The Chemical Composition and Nutritive Value of Australian Grain Legumes. Grains Research and Development, Canberra, ACT, Australia, 68 pp.
Robinson, E.H., 1988. Nutritional requirements of red drum: a review. Contrib. Mar. Sci. 30, 11–20. Robinson, E.H., 1989. Channel catfish nutrition. Rev. Aquat. Sci., 365–391.
Rowland, S.J., Ingram, B.A., 1991. Diseases of Australian native fishes. In: Fisheries Bulletin 4 NSW Fisheries, Sydney, NSW, Australia.
Ž .
Sargent, J., Henderson, R.J., Tocher, D.R., 1989. The lipids. In: Halver, J.E. Ed. , Fish Nutrition. Academic Press, San Diego, CA, pp. 153–218.
Schmitz, O., Greuel, E., Pfeffer, E., 1984. Digestibility of crude protein and organic matter of potential sources
Ž .
of dietary protein for eels Anguilla anguilla L. . Aquaculture 41, 21–30.
Scott, K., 1978. Cause and control of losses of chromium during nitric, perchloric acid oxidation of aquatic sediments. Analyst 103, 754.
Ž
Serrano, J.A., Nematipour, G.R., Gatlin, D.M., 1992. Dietary protein requirement of the red drum Sciaenops
.
ocellatus and relative use of dietary carbohydrate and lipid. Aquaculture 101, 283–291.
Smith, P., 1995. Aquatic Feed Industry and its Role in Sustainable Aquaculture. In: Proc. Feed Ingredients Asia ’95, Singapore, 19–21 September. pp. 1–11.
Smith, R.R., Peterson, M.C., Allred, A.C., 1980. Effect of leaching on apparent digestion coefficients of feedstuffs for salmonids. Prog. Fish-Cult. 42, 195–199.
Smith, R.R., Winfree, R.A., Rumsey, G.W., Allred, A., Peterson, M., 1995. Apparent digestion coefficients and metabolizable energy of feed ingredients for rainbow trout Oncorhynchus mykiss. J. World Aquacult. Soc. 26, 432–437.
Storebakken, T., Shearer, K.D., Refstie, S., Lagocki, S., McCool, J., 1998. Interactions between salinity, dietary carbohydrate source and carbohydrate concentration on the digestibility of macronutrients and
Ž .
energy in rainbow trout Oncorhynchus mykiss . Aquaculture 163, 347–359.
Sugiura, S.H., Dong, F.M., Rathbone, C.K., Hardy, R.W., 1998. Apparent protein digestibility and mineral availabilities in various feed ingredients for salmonid feeds. Aquaculture 159, 177–202.
Sullivan, J.A., Reigh, R.C., 1995. Apparent digestibility of selected feedstuffs in diets for hybrid striped bass
( ) G.L. Allan et al.rAquaculture 186 2000 293–310
310
Swick, R.A., 1995. Considerations in Using Common Asian Protein Meals. In: Proceedings of Feed Ingredients Asia ’95, Singapore, 19–21 September. pp. 121–138.
Tacon, G.J., Dominy, W.G., 1999. Overview of world aquaculture and aquafeed production. In: Book of Abstracts. World Aquaculture ’99, 26 April–2 May 1999, Sydney, Australia. World Aquaculture Society, Baton Rouge, LA, 853 pp.
Ž .
Wee, K.L., 1992. Aquaculture nutrition research in Australia. In: Allan, G.L., Dall, W. Eds. , Proceedings of Aquaculture Nutrition Workshop, Salamander Bay, 15–17 April, 1991. pp. 243–244, NSW Fisheries Brackish Water Fish Culture Research Station, Salamander Bay, NSW, Australia, 1992.
Ž .