A 3D GIS METHOD APPLIED TO CATALOGING AND RESTORING:
THE CASE OF AURELIAN WALLS AT ROME
M. Canciani a, V. Ceniccola b, M. Messi c, M. Saccone a, M. Zampilli a.
a Dipartimento di Architettura, Università Roma Tre, Piazza della Repubblica n.10, Roma, Italy (marco.canciani, mauro.saccone, michele.zampilli)@uniroma3.it
b
[email protected] c [email protected]
KEY WORDS: Aurelian Walls, laser scanning, continuous model, texturing model, 3D Geographic Information Systems (GIS).
ABSTRACT:
The project involves architecture, archaeology, restoration, graphic documentation and computer imaging. The objective is development of a method for documentation of an architectural feature, based on a three-dimensional model obtained through laser scanning technologies, linked to a database developed in GIS environment.
The case study concerns a short section of Rome’s Aurelian walls, including the Porta Latina. The city walls are Rome’s largest single architectural monument, subject to continuous deterioration, modification and maintenance since their original construction beginning in 271 AD. The documentation system provides a flexible, precise and easily-applied instrument for recording the full appearance, materials, stratification palimpsest and conservation status, in order to identify restoration criteria and intervention priorities, and to monitor and control the use and conservation of the walls over time.
The project began with an analysis and documentation campaign integrating direct, traditional recording methods with indirect, topographic instrument and 3D laser scanning recording. These recording systems permitted development of a geographic information system based on three-dimensional modelling of separate, individual elements, linked to a database and related to the various stratigraphic horizons, the construction techniques, the component materials and their state of degradation. The investigations of the extant wall fabric were further compared to historic documentation, from both graphic and descriptive sources.
1. THE STUDY CONTEXT:
THE AURELIAN WALLS AT PORTA LATINA
1.1 Project background
The Aurelian Walls have long been viewed as one of the grand monuments of Rome, representing both the physical city and the concept of community, thus for many decades they have been the subject of constant and varied works for maintenance and restoration. The current report is a summary of the thesis: “Integrated documentation and research methods for the Aurelian Walls at Porta Latina”, presented for the degree of Master of Architecture at the University of Rome ‘Tre’ in October 2012*∗. The thesis research enters under an agreement with the Rome Capital Superintendency for Cultural Properties, in which the University is assisting in research and development of new methods of documentation, cataloguing and monitoring for the walls, in support of long-term conservation. This work is conducted in particularly close cooperation with the Rome Department of Monuments - Excavation, Restoration and Development.
1.2 The Aurelian Walls
The Aurelian walls represent the longest city walls in existence, an imposing work of roughly 19 linear kilometres, originally built with 381 rectangular towers and 14 gates. The walls were constructed over the years between 271 and 279 AD, under the emperors Aurelian and Probus, in response to threats of barbarian invasion. They surrounded the entire occupied areas of the city, offering protection to over a million inhabitants and 1400 hectares of territory and structures.
The Aurelian construction phase consisted of a cement masonry wall (opus caementicium), between 3.5 and 4.0 metres thick, with vertical and upper surfaces in terracotta brick and tile, topped by a crenulated defensive walkway. The original height, excluding walkway, was 7.8 to 8.0 metres. The original construction also included crenulated towers at 30 metre intervals, in rectangular plan, which protruded horizontally a further 3 metres. Three types of gates were constructed, depending on the associated road: i) twin arched openings, with surfacing in travertine and a defensive system based on two semi-circular towers; ii) a single arched opening, with surfacing in travertine and protection by two semi-circular towers; iii) a single arch in simple brick surfacing, situated in the wall between two of the regular rectangular towers. There are also numerous postern doors and lesser rectangular gates, with discharging arch types of construction.
Minor modifications were carried out in a second building phase under Maxentius, followed by more important changes under Honorius, beginning in 401 AD. These modifications brought the walls to a total height of 18 metres, including a vaulted upper defensive gallery, open on the side facing the city. At this time the height of the “standard” towers was doubled; the gates were equipped with double doors and the gate towers were improved.
Beginning in the 8th century, maintenance and renovation of the walls and gates was conducted under papal administrations. These works are clearly indicated by the many papal coats of arms still embedded in the surfaces. In the 16th century, new
* Faculty of Architecture, Università di Roma Tre, Advanced Bachelor’s (Master’s) in Architecture-Restoration: thesis by Veronica Ceniccola, Armando Di Gregorio, Martina Messi, Maria Clotilde Pismataro. Thesis committee chairs: Michele Zampilli, Marco Canciani; committee members: Mauro Saccone, Alberta Ceccherelli. Thesis defence 11 October 2012.
bastions were added to update the defensive engineering, and during the renaissance and baroque eras the architectural appearance of many gates was reworked.
The walls remained as the boundary between urban Rome and the surrounding countryside until the reunification of Italy. However, under the new urban plans of 1873 and 1888 the city began to expand beyond. In some cases the new openings for roadways were developed as significant architectural projects, while others were simply brutal truncations. Large sections of the walls were also demolished, in some cases leaving major gates as isolated monuments, in place of the continuity of the entire original wall system.
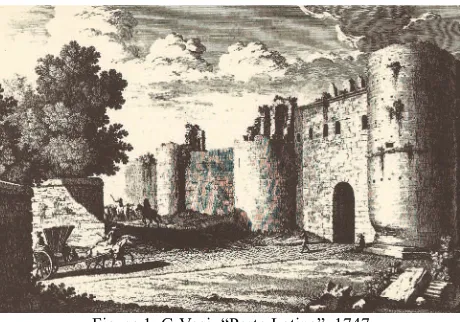
Figure 1. G.Vasi, “Porta Latina”, 1747.
The south tower is half destroyed, the northern one presents swabbed embrasure and the lower part degraded
1.3 Porta Latina and the adjacent walls
Figure 2. Porta Latina, 2012, geometric survey on photographic base ortho-rectified.
The current study concerns Porta Latina and the roughly 100 metres of wall between towers J19 and J20**. This gate is one of the best conserved of the original Aurelian walls. It was blocked off and closed at various times, particularly during the entire period from 1808 to 1911, however it has also received many changes over the centuries.
The entirety of the gate surfaces are executed in travertine blocks. The upper crenulated volumes, enclosing a defensive chamber with five arched windows, were added under Honorius. The gate is flanked by two semi-circular towers, one of which is constructed on a massive rectangular base in stone.
It is readily apparent that the gate arch has been lowered since the original Aurelian phase: a cross of Constantine on the keystone (a sign also found elsewhere on the Aurelian walls) is a clear indicator that the work was conducted under Honorius. The section of wall under consideration includes one of the best preserved sections of the Honorian defensive gallery, open and visible towards the “city” side. The exterior wall surfaces show a variety of repairs and engineering interventions dating to different periods.
2. THE 3D GIS SYSTEM
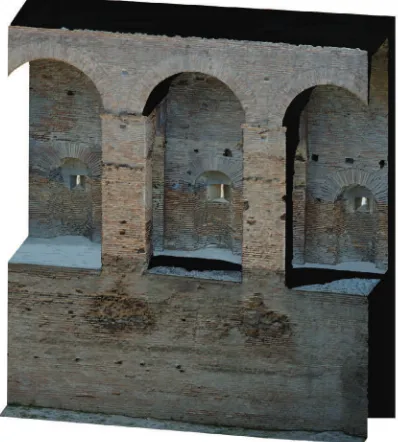
Figure 3. portion of 3D model: triangulated surface reconstruction.
Figure 4. portion of 3D model: color projection on the
triangulated surface.
2.1 Related works
Recent years have seen the development of many computerised systems for organising the data gathered in the recording and documentation of historic structures. One of the crucial problems is the definition of “base units”, meaning base elements presenting homogenous characteristics, for the association of further data. Some operators (Centofanti 2011, Brusaporci 2012) adopt architectural information systems (AIS) and divide the process in two phases: a 3D model is first constructed using traditional software (e.g. AutoCAD, Autodesk 3DS Max, Rhinoceros), and then integrated with 3D GIS/AIS. In this second phase, individual elements of the 3D model are converted to “feature classes” (base units) and then connected to the database. This method permits integration of the 3D model with the database, however it is limited by the characteristics of the base unit, which can contain either too much or too little information. For example, at a scale of 1:100 or 1:200, windows can be selected as a base unit, but at 1:50 or 1:20 scale it is necessary to document each sill, jamb, lintel, and moulding. Thus there is a risk of rendering the system impractical with a base category that is too “small” (such as a single window element) or too “large”, thus making it incapable of documenting important information for restoration purposes: for example below “window” level, not all windows will present the same levels of damage and deterioration.
Other operators (Drapp 2009), apply a methodology much closer to that of the current study, resolving the problem of the base unit by instead defining a minimum stratigraphic unit (MSU), a concept deriving from archaeology. In this approach, the initial phase of measured documentation and data collection is followed by study and identification of the MSUs, which become the base unit for linkage with the entire database. This solution permits application of traditional GIS systems (e.g. Quantum GIS) for both plan and elevation data, as seen in the current study.
2.2 Integration of data sources and management
The information system is based on three inter-related stages of research and knowledge advancement: 1) substantial archival-historical research; 2) 3D documentation integrating image and range-based methods of data collection, with direct traditional documentation of details; 3) in-depth data analysis and study to identify the construction phases and conservation conditions, leading to the definition of intervention criteria.
1. The first stage of archival-historical research involved in-depth search and study to identify contributing information sources, including previously unpublished and little-known materials, such as an 1883 drawing of the interior wall surfaces discovered in the collections of the Italian Army Engineering Office (Figure 5). This stage permitted the development of a reasonably complete historical “framework” of the transformations of the wall sections under study.
and achieves notable correspondence to the actual object in terms of both accuracy of measurement and quantity of information. This model is used in all stages of further modelling and imaging, and becomes the principle vehicle for further investigation and support to decision-making.
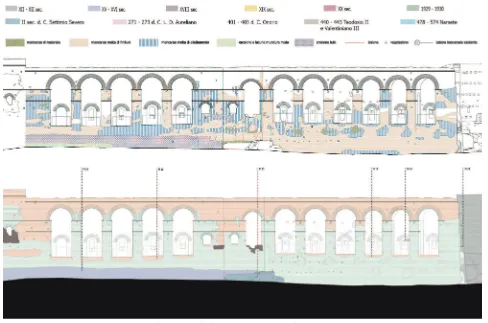
3. The annotation, analysis and interpretation of the stratigraphic units, construction techniques, component materials, feature conditions and deterioration were largely based on traditional direct measurement and observation. The analysis of the extant monument was constantly related to the graphic and textual historic documentation. A chronological table of the historic stages of works and interventions was prepared, with related graphic colour coding to be applied to depictions of surface areas. This provides a complete framework for the organisation and understanding of the complex information obtained through direct and indirect physical documentation, and permits ready visual recognition of the successive strata of works and interventions.
The data and knowledge assembled from these three stages constitute the core of the geographic information system.
2.3 Application of 3D GIS
The gate, towers and adjacent walls all present complex stratification, requiring in-depth analysis of all surfaces in order to describe and identify the specific construction phases. Graphic documentation was conducted using different techniques, in part due to restrictions on accessibility, and in all cases accompanied by compilation of detailed record sheets, in order to describe and identify all the “surface” construction types.
The surface analysis record sheet is divided into two parts: i) information on the original construction techniques (raw materials, material preparation, types and composition of mortars, component shape, stratigraphic sequencing, etc.); ii) documentation of condition (weathering, structural instability, etc.) with indications of degree of damage and urgency for intervention. The record sheets were structured so as to provide logical input to a database, constructed using Microsoft Access. Next, base mapping was developed, composed of thematic layers inter-related by geo-referencing: a vector map, a historic map from the Italian Army Engineering Corps, the reflectance ortho-imagery and ortho-photography for the wall section under
study. On the basis of this map, further vector layers could be added, containing the boundaries of the minimum stratigraphic units (MSUs), meaning the distinct, homogenous areas, not subject to further sub-division, identified in terms of construction and degradation typology.
Figure 6. The compositions are of two types: synthesis on the entire wall and specific, tabs on individual MSUs
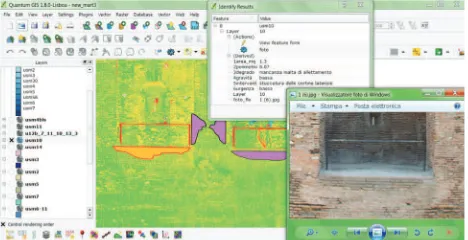
Figure 7. QGIS project with conservation condition data viewing.
The MSUs were defined by means of visual observation, annotated in the record sheets and in the direct recording, and using automatic and semi-automatic elaboration from images produced by laser scanning and photogrammetry (e.g. reflectance ortho-imagery). Each MSU thus delimited was assigned attributes linking it to the database, which in turn contains all the related information for the unit, in the form of alpha-numeric and graphic data. The software adopted is Quantum GIS, an open-source desktop geographic information system application, known from previous experience to be suitable for this type of data management.
The overall GIS information system contains spatial and characterising data, which can be analysed through database questioning using defined search criteria, thus permitting identification of MSUs and broader areas with shared characteristics.
The geo-referencing system permits precise comparison between the historic documentation, past stratigraphic studies and the documentation of the extant features, thus leading to development of a summary chronology of all the construction and maintenance interventions over the entire history of the walls and gate, using colour coded imaging to indicate the proposed succession of phases. Similarly, drawing on the same resources and inputs, the GIS system is also used to map the current conservation condition, including weathering and structural instability that presents active, current risks.
3. CONCLUSIONS
The principle features of the methodology are:
1. the use of historic sources and maps as the first source of information;
2. use of 3D modelling during all elaboration and imaging stages as a three-dimensional map of the features and processes under analysis;
3. use of a geographic information system as the “motor” for production of thematic maps of varying degrees of complexity;
4. ability to “scale” the level of definition within the GIS, thus adapting the processes from broad to detailed levels in order to define specific elements in the desired detail.
The current case study serves as a model for potential information gathering and planning processes to be extended to the entire Aurelian walls. The project methodology is designed for: low cost, precision, practicality and thoroughness.
The low costs for this procedure, relative to traditional documentation, are primarily obtained by dispensing with the need for scaffolding or mechanised platforms to reach the entire wall areas under assessment.
Precision is obtained through the instrumentation, which permits measured dimensioning of all the features and details recorded.
Thoroughness is obtained through the geo-referenced superimposition of very different types of information: from historic documentation, contemporary and historic photography, partial surveys and measurement, maps of varying types, descriptive record sheets, etc. In addition, a standardised legend permits ready integration of data recorded by different individuals, with different forms of training and research interests.
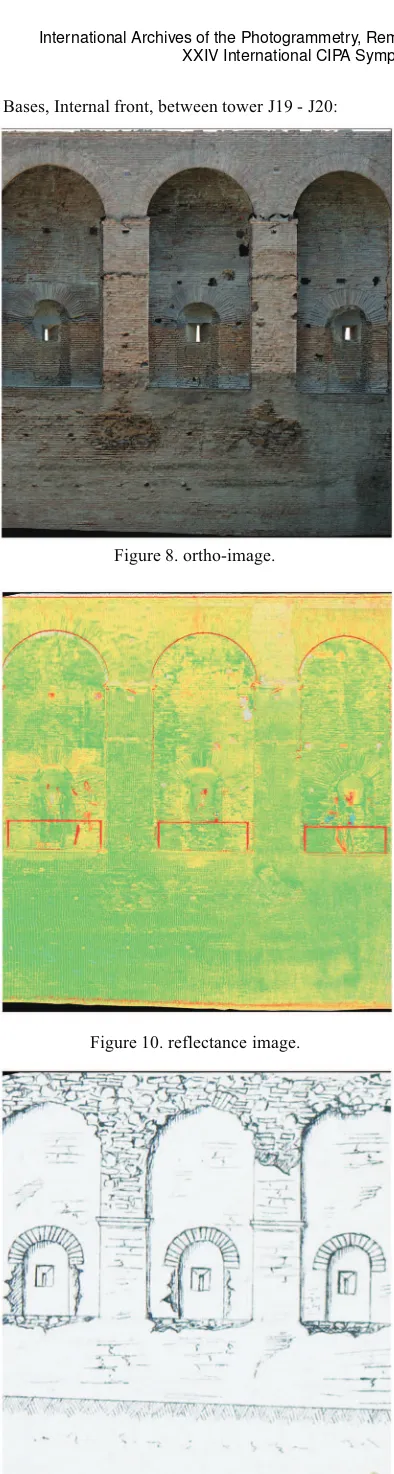
These characteristics make it possible to thoroughly define the restoration interventions required, prior to the actual opening of the restoration work site. Until now, this level of advance planning has almost never been possible, thus resulting in frequent surprises and delays during execution of the works, with many problems for the contractors, city and state Figure 8. ortho-image.
Figure 10. reflectance image.
administrations in terms of management, legal agreements, financing and administration, and ultimately with very possibilities of unsatisfactory work.
The practicality of the system is fundamental. The integrated documentation and recording, with periodic updating, offers the public administration a highly useful instrument for monitoring the conservation status of this and other cultural properties, controlling weathering and instability and programming interventions in targeted, timely and effective manner, from basic maintenance to major consolidation and restoration works.
4. REFERENCES
4.1 Selected bibliography
A. Nibby, 1820. Le mura di Roma, Rome.
J. A. Richmond, 1930. The City Wall of Imperial Rome, Oxford.
L. Cassanelli, G. Delfini, D. Fonti, 1974. Le mura di Roma. L’architettura militare nella storia urbana, Rome.
L. De Carlo, P. Quattrini, 1995. Le mura di Roma, tra realtà e immagine, Rome.
R. Coates-Stephens, 1998. The walls and aqueducts of Rome in the early Middle Ages, A.D. 500-1000, Journal of Roman Studies 88: 166-78.
Hendrik W. Dey , 2011. The Aurelian Wall and the Refashioning of Imperial Rome, AD 271–855, Cambridge.
A. Carandini, 2012. Atlante di Roma antica, Milan.
M. Centofanti, R. Continenza, S. Brusaporci, I. Trizio, 2011. The Architectural Information System Siarch3d-Univaq For Analysis And Preservation Of Architectural Heritage. The international archives of the photogrammetry remote sensing and spatial information sciences, vol. XXXVIII-5/W16, ISSN: 1682-1777.
S. Brusaporci,M., Centofanti, 2012. Sistemi Informativi Architettonici per la gestione, tutela e fruizione dell’edilizia storica, in Atti della 16a Conferenza Nazionale ASITA.
P. Drap, J. Seinturier, J.C. Chambelland, E. Pruno, 2009. Going To Shawbak (Jordan) And Getting The Data Back: toward a 3D GIS dedicated to medieval archaeology. In proceedings of 3D Arch 2009, 3D Virtual Reconstruction and Visualization of ComplexArchitectures Trento, Commission V, WG V/4.
4.2 Selected iconography
G. Vasi, 1747. Delle magnificenze di Roma antica e moderna, Book I: Le Porte e le Mura di Roma, incisioni, Rome.
Rossini L., Vedute di Roma nell'800; i mitici luoghi della capitale papalina nelle stampe del più famoso vedutista dell'800 romano, Dino Audino Editore, Rome, 1996.
ISCAG, Cartella XCI.B.6490, 1883. Figure 12 walls between towers J19 and J20.