QUALITY ASSURANCE ON FORCE MEASUREMENT OF 1 MN LEVER-TYPE FORCE STANDARD MACHINE THROUGH SYSTEM CHECK
JAMINAN MUTU PENGUKURAN GAYA PADA MESIN STANDAR GAYA TIPE LENGAN 1 MN MELALUI CEK SISTEM
Hafid, Dinar Nurcahyono
Pusat Riset dan Pengembangan SDM-BSN
Komplek Puspiptek Gd. 435, Setu Tangerang-Selatan, Indonesia, [email protected]
ABSTRACT
The 1 MN lever-type force standard machine operated by Deputy for National Measurement Standards-National Standardization Agency (SNSU-BSN) is the national standard for calibration of force measuring instruments from 2 kN to 1 MN measurement range. One of the assurances to ensure that the machine works well is through a system check. System check is carry out by comparing the force value generated by the machine to the force generated by the deadweight at capacity of 10 kN and 20 kN. In this paper, data is collected from the system check results from 2007 to 2016. Data processing is carried out by comparing the result and examining the variants similarities. Results showed that the |En| number results for all data spread from 0.00 to 0.91 with average 0.35 and variance of the system check results has variants similarities based on Fisher-test. These results indicate that the 1 MN lever-type force standard machine still has a good performance.
Keywords: force standard machine, lever-type force standard machine, system check.
ABSTRAK
Mesin standar gaya tipe lengan 1 MN yang dioperasikan oleh Deputi Standar Nasional Satuan Ukuran – Badan Standardisasi Nasional (SNSU-BSN) merupakan standar nasional untuk kalibrasi alat ukur gaya dengan rentang pengukuran 2 kN – 1 MN.
Salah satu jaminan mutu bahwa mesin masih bekerja dengan baik adalah melalui pengecekan sistem. Pengecekan sistem dilakukan dengan membandingkan besarnya gaya yang dihasilkan oleh mesin dengan gaya yang dihasilkan oleh beban deadweight pada kapasitas 10 kN dan 20 kN. Pengambilan data dilakukan berdasarkan hasil
pengecekan sistem dari tahun 2007 sampai dengan tahun 2016. Pengolahan data dilakukan dengan melakukan pemeriksaan kesamaan varian dan menghitung penyimpangan maksimum terhadap nilai rata-rata dari data hasil pengecekan sistem.
Hasil penelitian menunjukkan bahwa variansi hasil pengecekan sistem menunjukkan adanya kesamaan varian berdasarkan Fisher-test dan penyimpangan terbesar terhadap nilai rata-rata adalah 0.010% yang berarti tidak lebih besar dari ketidakpastian relatif mesin sebesar 0.015%. Hasil ini menunjukkan bahwa mesin standar gaya tipe lengan 1 MN ini masih memiliki performa baik.
Kata kunci: mesin standar gaya, mesin standar gaya tipe lengan, pengecekan sistem.
1.INTRODUCTION
Force measurements are widely carried out in factories, machineries and building constructions for maintaining quality control.
Nowadays, the importance of ensuring traceability of force measurements has risen because of the widespread adoption of quality control methods. As a result, calibrations of force measuring devices are more frequently required than before.
Deputy for National Measurement Standards-National Standardization Agency (SNSU-BSN) has 1 MN lever type force standard machine as the national standard for force calibration with measuring range 2 kN – 1 MN. This force standard machine has been installed since 1986 and has calibration period every 10 years. During this 10 years calibration period, the force standard machine can be change due to frequency of use or other factors. So the quality assurance
is needed to assure the stability of the machine.
The quality assurance of the one MN lever type force standard machine has been conducted by using linearity test every 2 years, crosscheck every 3 years and system check every month. The system check is the most important method needed to know promptly the measurement condition of the machine. In this paper, the quality assurance method using system check will be explained.
System check of the force standard machine is carried out by comparing the force generated by the machine with the force generated by deadweight. The reference standard in this comparison is the force value of the deadweight with nominal force of 10 kN and 20 kN. Parameters that are used to show that the force standard machine is still in a good performance are En
number from comparison result and Fisher test can be used to examine the variant similarities of the data collected.
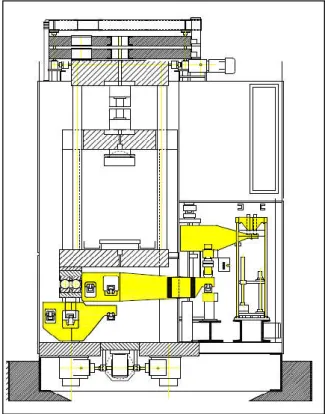
2. ONE MEGANEWTON LEVER-TYPE FORCESTANDARDMACHINE
The lever type force standard machine is a secondary force standard machine with Calibration and Measurement Capability (CMC) in relative uncertainty of 1×10⁻⁵ up to 5×10⁻⁴ [3]. This force standard machine uses the principle of arm’s length comparison to get a big force using small force. Comparison of the arm’s length is usually called transmission ratio.
Working system of the 1 MN lever type force standard machine can be seen in Figure 1. This force standard machine is using 5 arms and has 4 types of transmission ratio, which are 1:200, 1:500, 1:800 and 1:1000 [8], the force generated by the lever type force standard machine can be expressed by Equation 1 below.
R g
m F
w a
loc
1 …………..[1]
where, m = Mass of the weight gloc = Local gravitation ρa = Density of the air ρw = Density of the weight R = Transmission ratio
In Figure 1, the mass (m) of the weight will generate output force (F) whose
magnitude depends on the transmission ratio used. The output force is the force value that is used to perform load cell calibration, so that this force value is what needs to be checked by doing system check.
Figure 1. Working system of the 1 MN lever type force standard machine
3.SYSTEMCHECKOF1MNLEVER- TYPEFORCESTANDARDMACHINE System check is done by comparing machine measurement at 10 kN and 20 kN measuring point with 10 kN and 20 kN deadweight. The deadweight used to produce 10 kN force has a mass of 1 022.505 kg with uncertainty of 0.0005% [2]. Meanwhile, to produce 20 kN force 2 pieces of 10 kN deadweight is used.
The equations used to calculate the force generated by the deadweight are as follows:
w a
gloc
m
F
1 ……….. [2]
The density of weight has been measured by PTB (German) of 7820.1 kg /m3 [8].
Local gravity has been measured by KRISS (Korea) of 9.78137 m /s2 [2]. The air density of the room is 1.19047 kg /m3 which is calculated based on the following Equation 3 [6].
15 . 273
) 020582 .
0 00252 . 0 ( 464554 .
0
T
T h
p
a
… [3]
where, p = air pressure (mmHg) h = relative humidity (%RH) T = temperature (°C)
The force value generated by the deadweight (calculated with Equation 2) is used as the reference value in the system check process. Therefore, the force value generated by the force standard machine will be said well if comparison result with a force value generated by the deadweight is good with En number less than 1.
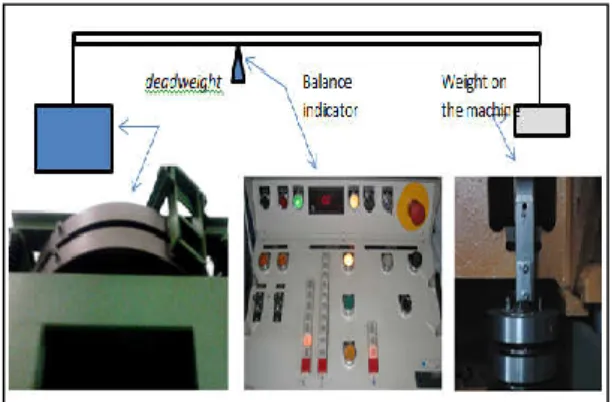
System check is performed on 3 lever transmission ratio of the machine: 1:200, 1:500 and 1:1000. System check process is started by setting the system at equilibrium condition that can be determined by monitoring the balance indicator before loading. After balance, the machine is operated to generate a 10 kN or 20 kN force at one side and then the deadweight is also operated at the same capacity of 10 kN or 20 kN at the other side of the lever. The value of
the balance indicator when both side of the force is given is taken as a result of system check. After the loading, then the load is released again to obtain an equilibrium condition as before. The equipment used in the system check process is shown in Figure 2.
Figure 2. System check component of 1 MN lever type force standard machine
The balance indicators used on the machine have been characterized using a mass. The relationship between the indicator value and the mass given is stated with following equation [4]:
y = 0.0 625 x - 0.4622……… [4]
Where, y = value of the indicator (digit) x = mass that is given (gram)
By using Equation 4 and Equation 2 then the value on the balance indicator can be converted into force unit, so that its relative value can be determined to the amount of the loading given.
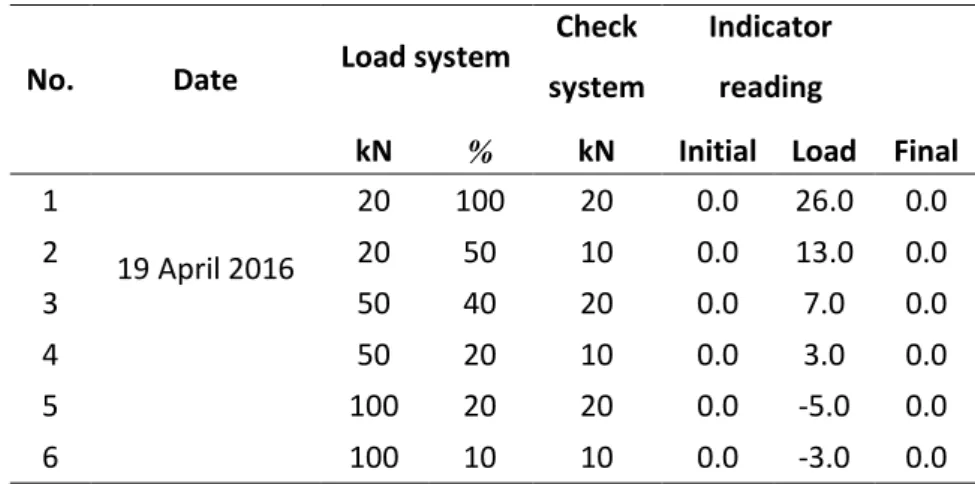
Examples of system check results can be seen in Table 1. In the table of the system check results are shows the date when the
system check was performed, the selection of the machine’s loading system used, the selection of the deadweight used, and the balance indicator reading as a results of the system check that has been performed.
To guarantee the measurement results then the system check process is carried out periodically about once a month. The results
of system check are used as one of the parameters to state that the machine is still working properly or not. If during the calibration period the system check results indicate a larger deviation than the uncertainty, then the machine needs to be calibrated even if it is still within its calibration period.
Table 1. System check results
No. Date Load system Check system
Indicator reading
kN % kN Initial Load Final 1
19 April 2016
20 100 20 0.0 26.0 0.0
2 20 50 10 0.0 13.0 0.0
3 50 40 20 0.0 7.0 0.0
4 50 20 10 0.0 3.0 0.0
5 100 20 20 0.0 -5.0 0.0
6 100 10 10 0.0 -3.0 0.0
4.RESULTANDDISCUSSION
System check results obtained from February 27, 2007 until April 19, 2016 can be seen in Table 2. The amount of
data calculated in this table is from 59 times system check process.
Table 2. Summary of system check results
R Capacity Indicator reading (digit) (kN) Average Max Min Stdev
1 : 200 10 13.9 16.6 7.0 2.2
1 : 200 20 26.7 36.0 14.6 4.1
1 : 500 10 3.4 7.8 -2.0 2.5
1 : 500 20 9.3 19.2 -2.0 5.2
1 : 1000 10 -3.0 0.0 -8.5 1.6
1 : 1000 20 -3.7 0.4 -14.7 3.1
For each transmission ratio (R), data is taken at two different loading points, 10 kN and 20 kN. It aims to know the comparison results of both loading points.
Comparison cannot be done with indicator reading value directly, because it shows different force values.
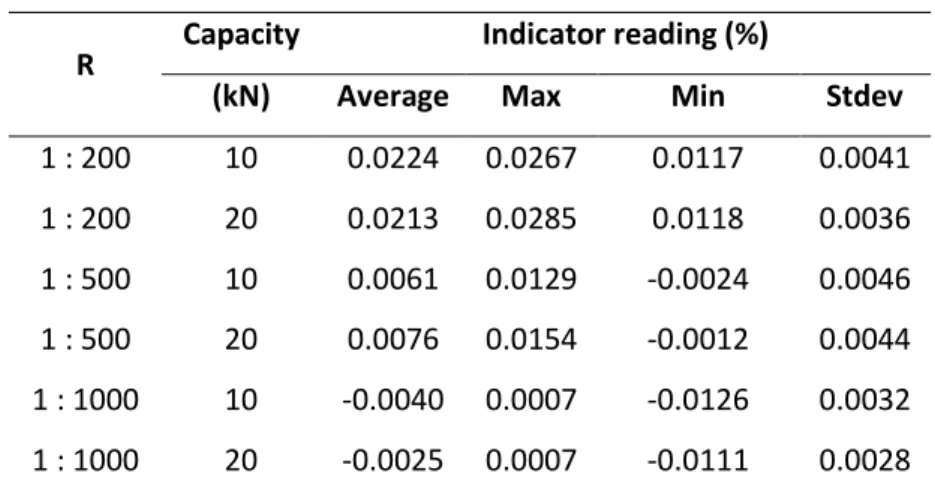
It needs to be converted into relative units. The conversion calculation of the indicator reading in the unit of digit to the unit of gram can be done by using Equation 4. The calculation of force value can be done by using Equation 2, and finally it can be converted to relative value. The conversion result of indicator reading in relative units can be seen in Table 3.
In ideal conditions the data distribution on the same transmission ratio will indicate the existence of a common variance. An examination of the variants similarity can be done using Fisher-test in Equation 5 [7]. Variants are considered equal if the conditions in Eq. 5 are not met.
) ,
2 (
95 . 2 0
2
small big small
big v f f
stdev stdev
…….. [5]
Where, stdevbig is for bigger variant,
small
stdev is for smaller variant and )
,
95(
.
0 fbig fsmall
v is fractile distribution of variant ratio with degree of freedom (fbig,fsmall).
Table 3. Summary of system check results in relative unit
R Capacity Indicator reading (%)
(kN) Average Max Min Stdev
1 : 200 10 0.0224 0.0267 0.0117 0.0041 1 : 200 20 0.0213 0.0285 0.0118 0.0036 1 : 500 10 0.0061 0.0129 -0.0024 0.0046 1 : 500 20 0.0076 0.0154 -0.0012 0.0044 1 : 1000 10 -0.0040 0.0007 -0.0126 0.0032 1 : 1000 20 -0.0025 0.0007 -0.0111 0.0028 The system check results that have been
taken are considered close to the calibration result value as reference value [5]. Therefore, the comparison is carried out between the system check value with
reference value. The parameter use for comparison is En number result [1]. The control chart for system check for each capacity and transmission ratio can be seen in the following figure:
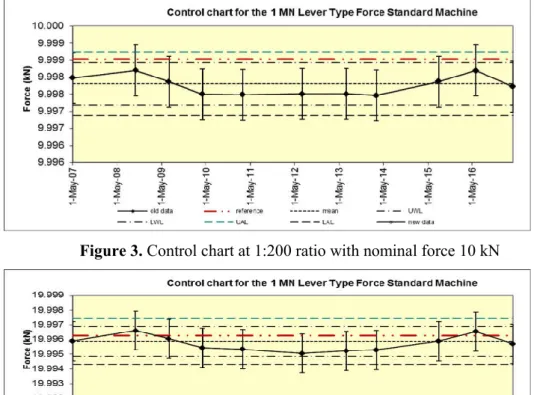
Figure 3. Control chart at 1:200 ratio with nominal force 10 kN
Figure 4. Control chart at 1:200 ratio with nominal force 20 kN
Figure 5. Control chart at 1:500 ratio with nominal force 10 kN
Figure 6. Control chart at 1:500 ratio with nominal force 20 kN
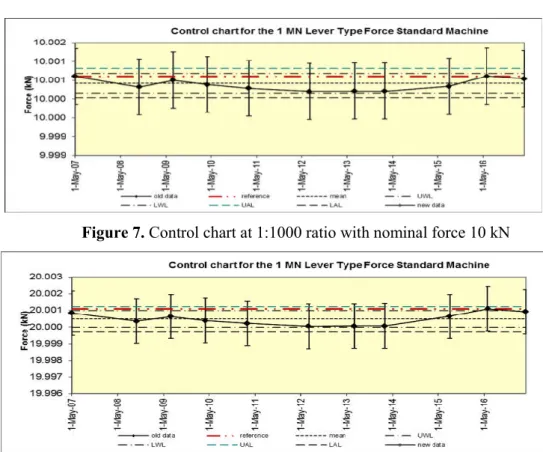
Figure 7. Control chart at 1:1000 ratio with nominal force 10 kN
Figure 8. Control chart at 1:1000 ratio with nominal force 20 kN
Each displayed force value point shown in Figure 3 to Figure 8 is an average value of one year system check results, and the error bar is the uncertainty result. The uncertainty is calculated from force value of the deadweight and resolution of indication. The
|En| number results for all data spread from 0.00 to 0.91 with average 0.35. This shows that the machine is still in stable condition.
5. CONCLUSION
System check, can be used as one of the quality assurance in determining the 1 MN lever type force standard machine measurement capability, together with two
other tests. The results of system check can show that the machine is considered in stable condition.
6.ACKNOWLEDGEMENT
On this occasion the author would like to thank to all parties involved in the completion of this paper, especially the counselors and colleagues from Pusrisbang SDM BSN and SNSU-BSN.
7.REFERENCES
PT001, A. P. L. A. C. (2008). Calibration interlaboratory comparisons. Asia Pacific Laboratory Accreditation
Cooperation-Proficiency Testing Committee
Choi, I.M., & Lee, H.Y. (2012). Report of Absolute Gravity Measurement at KIM-LIPI Indonesia. KRISS.
EURAMET. (2010). EURAMET/cg-04/v.01 Uncertainty of Force Measurements.
Hafid. (2007). Pengecekan sistem mesin standar gaya lever amplification berkapasitas 1000 kN di Puslit KIM-LIPI. Pertemuan dan Presentasi Ilmiah Kalibrasi, Instrumentasi dan Metrologi (PPI KIM).
Hafid, & Darmayanti, N.T.E. (2014).
Pengembangan sistem kalibrasi internal mesin standar gaya tipe lengan 1 MN. Instrumentasi, pp 53- 61.
Park Y.K., Kim M.S., Kim J.H., Song H.K,
& Kang D.I. (2007). Development of a 200 N deadweight force standard
machine. Asia-Pacific Symposium on Mass, Force and Torque (APMF).
Rochim, T. (2006). Perancangan penelitian dan analisis data statistika.
Bandung: ITB.
Sawla, A. (1986). Report on the measurement carried out for the acceptance of the 1 MN force standard machine recently installed at the LIN-LIPI. Braunschweig : PTB.