Consumption Expenditure of Indonesia Population
BADAN PUSAT STATISTIK
Preface
The population consumption pattern of a country can reflect the socio-economic conditions of a region/ country. Data consumption can be made in reference to predict indicators
of the population welfare
In general, this presentation aims to give a description about
expenditure and consumption pattern in Indonesia.
1. Average of per capita monthly expenditure by area of residence;
2. Average of per capita monthly expenditure by group of goods;
3. Average of per capita daily calorie consumption by area of residence;
4. Average of per capita daily calorie consumption of food materials and finished food;
5. Average of per capita daily protein intake;
6. Proportion of population below the poverty line;
7. Prevalence of population with moderate or severe food insecurity;
8. Percentage prevalence of undernourishment (PoU).
INDICATORS ARE PRODUCED
XGLOBAL AND NATIONAL INDICATORS (1)
X1.SDG’s
a. Goal 1: Alleviate all forms of poverty
Global Indicator 1.1.1: The proportion of population living below the international poverty line, by sex, age group, employment status, and geographic location (urban / rural)
Global Indicator 1.2.1: The proportion of people living below the national poverty line, by sex and age group
b. Goal 2: Stop Hunger, Increase Food Security and Nutrition, and Promote Sustainable Agriculture
Global Indicator: 2.1.1: Prevalence of Malnutrition (PoU)
3. Neraca (balance sheet)
Household consumption indicators a. Gross Domestic Product(GDP);
b. Household balance sheet
GLOBAL AND NATIONAL INDICATORS (2)
X2. RPJMN
a. Reduce poverty
b. Increase economic growth
Preface
Consumption of Calorie and Protein
Consumption Expenditure Consumption
Data
Preface
Consumption of Calorie and Protein
Consumption Expenditure Consumption
Data
Kelompok Barang Commodity Group
Perkotaan Urban
Perdesaan Rural
Perkotaan+Perdesaan Urban+Rural
(1) (2) (3) (4)
A. MAKANAN / FOOD
1. Padi-padian / Cereals 54853 68895 61455
2. Umbi-umbian / Tubers 5012 6611 5764
3. Ikan/udang/cumi/kerang/
Fish/shrimp/common squid/shells 43206 37402 40478
4. Daging / Meat 31054 18150 24987
5. Telur dan susu / Eggs and milk 36385 21435 29357
6. Sayur-sayuran / Vegetables 43178 41517 42397
7. Kacang-kacangan / Legumes 12007 10401 11252
8. Buah-buahan / Fruits 27531 17574 22850
9. Minyak dan Kelapa / Oil and coconut 13398 13803 13588
10. Bahan minuman / Beverages stuffs 16773 17421 17078
11. Bumbu-bumbuan / Spices 10052 9210 9656
12. Konsumsi lainnya
Miscellaneous food items 11768 9941 10909
13. Makanan dan minuman jadi
Prepared food and beverages 220882 118177 172600
14. Rokok / Cigarettes 63984 67391 65586
JUMLAH MAKANAN
TOTAL OF FOOD 590082 457927 527956
TABEL 5. RATA-RATA PENGELUARAN PER KAPITA SEBULAN (RUPIAH) MENURUT KELOMPOK BARANG DAN DAERAH TEMPAT TINGGAL, MARET 2017
TABLE 5. MONTHLY AVERAGE EXPENDITURE PER CAPITA (RUPIAHS) BY COMMODITY GROUP AND URBAN RURAL CLASSIFICATION, MARCH 2017
TABLE 5. MONTHLY AVERAGE EXPENDITURE PER CAPITA (RUPIAHS) BY COMMODITY GROUP AND URBAN RURAL CLASSIFICATION, MARCH 2017 (ADVANCED)
Kelompok Barang Commodity Group
Perkotaan Urban
Perdesaan Rural
Perkotaan+Perdesaan Urban+Rural
(1) (2) (3) (4)
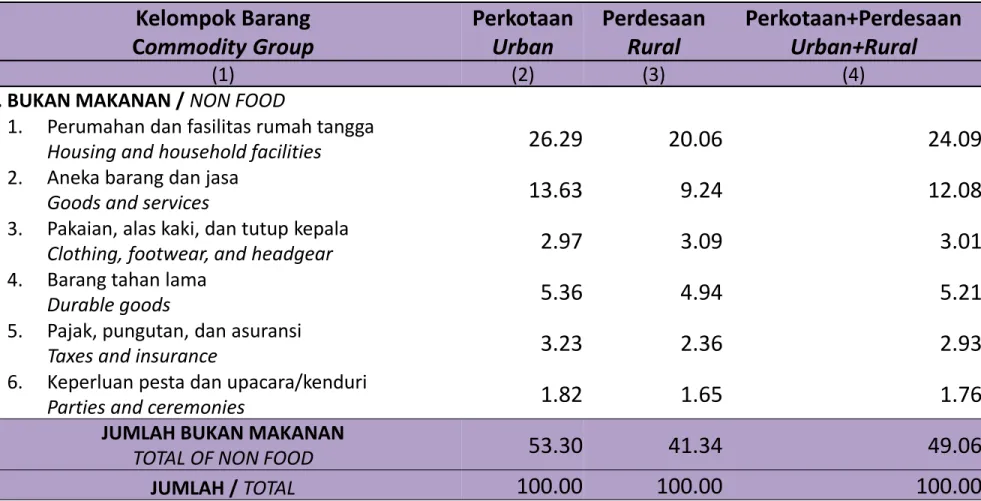
B. BUKAN MAKANAN / NON FOOD
1. Perumahan dan fasilitas rumah tangga
Housing and household facilities 332179 156612 249644
2. Aneka barang dan jasa
Goods and services 172215 72132 125165
3. Pakaian, alas kaki, dan tutup kepala
Clothing, footwear, and headgear 37472 24104 31187
4. Barang tahan lama
Durable goods 67737 38527 54005
5. Pajak, pungutan, dan asuransi
Taxes and insurance 40863 18436 30320
6. Keperluan pesta dan upacara/kenduri
Parties and ceremonies 22978 12855 18219
JUMLAH BUKAN MAKANAN
TOTAL OF NON FOOD 673444 322666 508541
JUMLAH / TOTAL 1263526 780593 1036497
TABEL 5. RATA-RATA PENGELUARAN PER KAPITA SEBULAN (RUPIAH) MENURUT KELOMPOK BARANG DAN DAERAH TEMPAT TINGGAL, MARET 2017(LANJUTAN)
Kelompok Barang Commodity Group
Perkotaan Urban
Perdesaan Rural
Perkotaan+Perdesaan Urban+Rural
(1) (2) (3) (4)
A. MAKANAN / FOOD
1. Padi-padian / Cereals 4.34 8.83 5.93
2. Umbi-umbian / Tubers 0.40 0.85 0.56
3. Ikan/udang/cumi/kerang/
Fish/shrimp/common squid/shells 3.42 4.79 3.91
4. Daging / Meat 2.46 2.33 2.41
5. Telur dan susu / Eggs and milk 2.88 2.75 2.83
6. Sayur-sayuran / Vegetables 3.42 5.32 4.09
7. Kacang-kacangan / Legumes 0.95 1.33 1.09
8. Buah-buahan / Fruits 2.18 2.25 2.20
9. Minyak dan Kelapa / Oil and coconut 1.06 1.77 1.31
10. Bahan minuman / Beverages stuffs 1.33 2.23 1.65
11. Bumbu-bumbuan / Spices 0.80 1.18 0.93
12. Konsumsi lainnya
Miscellaneous food items 0.93 1.27 1.05
13. Makanan dan minuman jadi
Prepared food and beverages 17.48 15.14 16.65
14. Rokok / Cigarettes 5.06 8.63 6.33
JUMLAH MAKANAN
TOTAL OF FOOD 46.70 58.66 50.94
TABEL 6. PERSENTASE RATA-RATA PENGELUARAN PER KAPITA SEBULAN (RUPIAH) MENURUT KELOMPOK BARANG DAN DAERAH TEMPAT TINGGAL, MARET 2017
TABLE 6. PERCENTAGE OF MONTHLY AVERAGE EXPENDITURE PER CAPITA (RUPIAHS) BY COMMODITY GROUP AND URBAN RURAL CLASSIFICATION, MARCH 2017
TABLE 6. PERCENTAGE OF MONTHLY AVERAGE EXPENDITURE PER CAPITA (RUPIAHS) BY COMMODITY GROUP AND URBAN RURAL CLASSIFICATION, MARCH 2017 (ADVANCED)
Kelompok Barang Commodity Group
Perkotaan Urban
Perdesaan Rural
Perkotaan+Perdesaan Urban+Rural
(1) (2) (3) (4)
B. BUKAN MAKANAN / NON FOOD
1. Perumahan dan fasilitas rumah tangga
Housing and household facilities 26.29 20.06 24.09
2. Aneka barang dan jasa
Goods and services 13.63 9.24 12.08
3. Pakaian, alas kaki, dan tutup kepala
Clothing, footwear, and headgear 2.97 3.09 3.01
4. Barang tahan lama
Durable goods 5.36 4.94 5.21
5. Pajak, pungutan, dan asuransi
Taxes and insurance 3.23 2.36 2.93
6. Keperluan pesta dan upacara/kenduri
Parties and ceremonies 1.82 1.65 1.76
JUMLAH BUKAN MAKANAN
TOTAL OF NON FOOD 53.30 41.34 49.06
JUMLAH / TOTAL 100.00 100.00 100.00
TABEL 6. PERSENTASE RATA-RATA PENGELUARAN PER KAPITA SEBULAN (RUPIAH) MENURUT KELOMPOK BARANG DAN DAERAH TEMPAT TINGGAL, MARET 2017 (LANJUTAN)
GAMBAR 1. RATA-RATA PENGELUARAN PER KAPITA SEBULAN (RUPIAH) MENURUT KELOMPOK BARANG, MARET 2015-2017
2015 2016 2017
Food 412462 460639 527956
Non Makanan 456361 485619 508541
0 100000 200000 300000 400000 500000 600000
FIGURE 1. MONTHLY AVERAGE EXPENDITURE PER CAPITA (RUPIAHS) BY COMMODITY GROUP, MARCH 2015-2017
GAMBAR 2. RATA-RATA PENGELUARAN PER KAPITA SEBULAN (RUPIAH) UNTUK KELOMPOK MAKANAN MENURUT DAERAH TEMPAT TINGGAL, MARET 2015-2017
2015 2016 2017
Urban 457312 520631 590082
Rural 366834 397100 457927
Perkotaan+Perdesaan 412462 460639 527956 0
100000 200000 300000 400000 500000 600000 700000
FIGURE 2. MONTHLY AVERAGE EXPENDITURE PER CAPITA (RUPIAHS) FOR FOOD GROUP BY URBAN RURAL CLASSIFICATION, MARCH 2015-2017
GAMBAR 3. RATA-RATA PENGELUARAN PER KAPITA SEBULAN (RUPIAH) UNTUK KELOMPOK NON MAKANAN MENURUT DAERAH TEMPAT TINGGAL, MARET 2015-2017
2015 2016 2017
Urban 617352 647500 673444
Rural 292580 314166 322666
Perkotaan+Perdesaan 456361 485619 508541 0
100000 200000 300000 400000 500000 600000 700000 800000
FIGURE 3. MONTHLY AVERAGE EXPENDITURE PER CAPITA (RUPIAHS) FOR NON FOOD GROUP BY URBAN RURAL CLASSIFICATION, MARCH 2015-2017
TABEL 7. PERSENTASE PENGELUARAN RATA-RATA PER KAPITA MENURUT KUINTIL PENGELUARAN DAN JENIS PENGELUARAN, MARET 2016
Kuintil Pengeluaran
Expenditure Quintile Makanan/Food Bukan Makanan Non Food
(1) (2) (3)
Pertama/ First 61.95 38.05
Kedua/ Second 60.27 39.73
Ketiga/ Third 58.21 41.79
Keempat/ Fourth 54.16 45.84
Kelima/ Fifth 38.75 61.25
Jumlah/ Total 48.68 51.32
TABLE 7. PERCENTAGE OF MONTHLY AVERAGE PER CAPITA EXPENDITURE (RUPIAHS) BY TYPE OF EXPENDITURE AND QUINTILE, MARCH 2016
TABEL 7. PERSENTASE PENGELUARAN RATA-RATA PER KAPITA MENURUT KUINTIL PENGELUARAN DAN JENIS PENGELUARAN, MARET 2017
Kuintil Pengeluaran
Expenditure Quintile Makanan/Food Bukan Makanan Non Food
(1) (2) (3)
Pertama/ First 66.31 33.69
Kedua/ Second 63.59 36.41
Ketiga/ Third 60.71 39.29
Keempat/ Fourth 56.49 43.51
Kelima/ Fifth 40.16 59.84
Jumlah/ Total 50.94 49.06
TABLE 7. PERCENTAGE OF MONTHLY AVERAGE PER CAPITA EXPENDITURE (RUPIAHS) BY TYPE OF EXPENDITURE AND QUINTILE, MARCH 2017
TABEL 7. PERSENTASE PENGELUARAN RATA-RATA PER KAPITA UNTUK KONSUMSI MAKANAN MENURUT KUINTL PENGELUARAN, MARET 2016-2017
0 10 20 30 40 50 60 70
2016 2017
Pertama / First Kedua/ Second Ketiga/ Third Keempat/ Fourth Kelima/Fifth
TABLE 7. PERCENTAGE OF MONTHLY AVERAGE PER CAPITA EXPENDITURE (RUPIAHS) FOR FOOD GROUP BY QUINTILE EXPENDITURE, MARCH 2016-2017
TABEL 7. PERSENTASE PENGELUARAN RATA-RATA PER KAPITA UNTUK KONSUMSI NON MAKANAN MENURUT KUINTL PENGELUARAN, MARET 2016-2017
0 10 20 30 40 50 60 70
2016 2017
Pertama/ First Kedua/ Second Ketiga/ Third Keempat/Fourth Kelima/Fifth
TABLE 7. PERCENTAGE OF MONTHLY AVERAGE PER CAPITA EXPENDITURE (RUPIAHS) FOR NO FOOD GROUP BY QUINTILE EXPENDITURE, MARCH 2016-2017
Rata-rata pengeluaran per kapita di 24 Provinsi di Indonesia didominasi untuk makanan sedangkan di 10 Provinsi lainnya didominasi untuk bukan makanan
The average per capita monthly expenditure in 24 provinces in Indonesia is dominated by food
while in 10 other provinces it is dominated by non food
20 Provinsi di Indonesia memiliki rata-rata konsumsi beras/beras ketan per kapita sebulan diatas angka nasional (6,73 kg)
20 province in Indonesia have an average per capita monthly expenditure of rice/ glutinous rice
above national average (6,73 kg)
Preface
Consumption of Calorie and Protein
Consumption Expenditure Consumption
Data
Preface
Consumption of Calorie and Protein
Consumption Expenditure Consumption
Data
2015 2016 2017
Urban 57.36 59.14 64.51
Rural 52.82 54.05 59.61
Urban+Rural 55.11 56.67 62.20
0 10 20 30 40 50 60 70
57 gram
Gambar 1. Rata-rata Konsumsi Protein (gram) per Kapita per Hari
menurut Daerah Tempat Tinggal di Indonesia Tahun 2015-2017 Figure 1. Average Daily per Capita Consumption of Protein (grams)
by Urban Rural Calssification in Indonesia , 2015-2017
2015 2016 2017
Urban 1982.41 2034.01 2142.61
Rural 2003.15 2040.98 2163.94
Urban+Rural 1992.69 2037.4 2152.64
1850 1900 1950 2000 2050 2100 2150 2200
Gambar 2. Rata-rata Konsumsi Kalori (kkal) per Kapita per Hari menurut Daerah Tempat Tinggal di Indonesia Tahun 2015-2017
2150 kkal
Figure 2. Average Daily per Capita Consumption of Calorie (kcal) by
Urban Rural Calssification in Indonesia , 2015-2017
2015 2016 2017
Food prepared at home 1516.30 1565.30 1570.46
Prepared food and baverage 466.11 468.71 572.15
Total 1982.41 2034.01 2142.61
0.00 500.00 1000.00 1500.00 2000.00 2500.00
Gambar 3. Rata-rata Konsumsi Kalori (kkal) per Kapita per Hari Daerah Perkotaan di Indonesia Tahun 2015-2017
Figure 3. Average Daily per Capita Consumption of Calorie (kcal) in
Urban Area in Indonesia , 2015-2017
2015 2016 2017
Food prepared at home 1676.93 1715.75 1748.88
Prepared food and baverage 326.22 325.23 415.06
Total 2003.15 2040.98 2163.94
0 500 1000 1500 2000 2500
Gambar 4. Rata-rata Konsumsi Kalori (kkal) per Kapita per Hari Daerah Perdesaan di Indonesia Tahun 2015-2017
Figure 4. Average Daily per Capita Consumption of Calorie (kcal) in
Rural Area in Indonesia , 2015-2017
2015 2016 2017
Food prepared at home 1595.92 1638.37 1654.34
Prepared food and baverage 396.77 399.03 498.3
Total 1992.69 2037.4 2152.64
0 500 1000 1500 2000 2500
Gambar 5. Rata-rata Konsumsi Kalori (kkal) per Kapita per Hari Daerah Perkotaan dan Perdesaan di Indonesia Tahun 2015-2017
Figure 5. Average Daily per Capita Consumption of Calorie (kcal) in
Urban and Rural Area in Indonesia , 2015-2017
2015 2016 2017
Food prepared at home 43.83 45.06 46.99
Prepared food and baverage 13.53 14.08 17.52
Total 57.36 59.14 64.51
0 10 20 30 40 50 60 70
Gambar 6. Rata-rata Konsumsi Protein (gram) per Kapita per Hari Daerah Perkotaan di Indonesia Tahun 2015-2017
Figure 6. Average Daily per Capita Consumption of Protein (grams) in
Urban Area in Indonesia , 2015-2017
2015 2016 2017
Food prepared at home 44.67 45.79 48.38
Prepared food and baverage 8.15 8.26 11.23
Total 52.82 54.05 59.61
0.00 10.00 20.00 30.00 40.00 50.00 60.00 70.00
Gambar 7. Rata-rata Konsumsi Protein (gram) per Kapita per Hari Daerah Perdesaan di Indonesia Tahun 2015-2017
Figure 7. Average Daily per Capita Consumption of Protein (grams) in
Rural Area in Indonesia , 2015-2017
2015 2016 2017
Food prepared at home 44.25 45.42 47.64
Prepared food and baverage 10.86 11.25 14.56
Total 55.11 56.67 62.20
0.00 10.00 20.00 30.00 40.00 50.00 60.00 70.00
Gambar 8. Rata-rata Konsumsi Protein (gram) per Kapita per Hari Daerah Perkotaan dan Perdesaan di Indonesia Tahun 2015-2017
Figure 8. Average Daily per Capita Consumption of Protein (grams) in
Urban and Rural Area in Indonesia , 2015-2017
Kelompok Makanan/Food Group Kalori/Calorie
2015 2016 2017
1. Padi-padian/Cereals 875,53 896,38 851,44
2. Umbi-umbian/Tubers 35,43 36,02 47,69
3. Ikan/Fish 42,52 42,88 49,17
4. Daging/Meat 52,37 56,02 67,70
5. Telur dan susu/Eggs and milk 58,31 61,13 60,47
6. Sayur-sayuran/Vegetables 29,68 30,68 38,907
7. Kacang-kacangan/Legumes 47,18 49,65 59,23
8. Buah-buahan/Fruit 38,54 35,71 52,69
9. Minyak dan kelapa/Oil and coconut 255,49 260,68 252,43
10. Bahan minuman/Beverage stuffs 95,62 102,82 98,10
11. Bumbu-bumbuan/Spices 9,37 10,35 12,33
12. Konsumsi lainnya/Miscellaneous food items 55,90 56,04 64,17
13. Makanan dan minuman Jadi/Prepared food and beverage 396,77 399,03 498,30
Jumlah/Total 1992,71 2037,4 2152,64
Tabel 1. Average Daily per Capita Consumption of Calorie (kcal) by Food Group in Indonesia 2015-2017
Tabel 1. Rata-Rata Konsumsi Kalori (kkal) per Kapita Sehari Menurut
Kelompok Makanan di Indonesia Tahun 2015-2017
Kelompok Makanan/Food Group Kalori/Calorie
2015 2016 2017
1. Padi-padian/Cereals 20,59 21,09 20,02
2. Umbi-umbian/Tubers 0,34 0,36 0,42
3. Ikan/Fish 7,14 7,17 8,23
4. Daging/Meat 3,13 3,35 4,2
5. Telur dan susu/Eggs and milk 3,23 3,34 3,35
6. Sayur-sayuran/Vegetables 1,97 2,04 2,44
7. Kacang-kacangan/Legumes 4,72 4,97 5,63
8. Buah-buahan/Fruit 0,43 0,37 0,53
9. Minyak dan kelapa/Oil and coconut 0,25 0,24 0,21
10. Bahan minuman/Beverage stuffs 0,84 0,84 0,81
11. Bumbu-bumbuan/Spices 0,43 0,47 0,53
12. Konsumsi lainnya/Miscellaneous food items 1,18 1,18 1,26
13. Makanan dan minuman Jadi/Prepared food and beverage 10,86 11,25 14,56
Jumlah/Total 55,11 56,67 62,20
Tabel 2. Rata-Rata Konsumsi Protein (grams) per Kapita Sehari
Menurut Kelompok Makanan di Indonesia Tahun 2015-2017
Tabel 2. Average Daily per Capita Consumption of Protein (grams)
by Food Group in Indonesia 2015-2017
2016 2017
Quintile 1 1586.69 1713.80
Quintile 2 1833.14 1975.82
Quintile 3 2035.80 2155.80
Quintile 4 2232.50 2353.25
Quintile 5 2498.81 2564.52
Total 2037.40 2152.64
0 500 1000 1500 2000 2500 3000
Gambar 9. Rata-Rata Konsumsi Kalori per Kapita Sehari menurut Kuintil Pengeluaran Tahun 2016 dan 2017 (Kkal)
2150 kkal
Gambar 9. Average Daily per Capita Consumption of Calorie by Quintile
Expenditure in 2016 and 2017 (kcal)
2016 2017
Quintile 1 40.45 45.42
Quintile 2 48.29 54.19
Quintile 3 55.04 60.86
Quintile 4 62.69 69.08
Quintile 5 76.88 81.48
Total 56.67 62.2
100 2030 4050 6070 8090
Gambar 9. Rata-Rata Konsumsi Protein per Kapita Sehari menurut Kuintil Pengeluaran Tahun 2016 dan 2017 (grams)
57 gram