Combination of K-Nearest Neighbor and K-Means based
on Term Re-weighting for Classify Indonesian News
Putu Wira Buana
Department of Information Technology Udayana University, Bali,
Indonesia
Sesaltina Jannet D.R.M.
Student of Department of Information Technology Udayana University, Bali,
Indonesia
I Ketut Gede Darma Putra
Department of Information Technology Udayana University, Bali,
Indonesia
ABSTRACT
KNN is one of the accepted classification tool, it used all training samples in the classification which cause to a high level of computation complexity.To resolve this problem, it is necessary to combine traditional KNN algorithm and K-Means cluster algorithm that is proposed in this paper.After completing the preprocessing step, the first thing to do is weighting the word (term) by usingTerm Frequency-Inverse Document Frequency (TF-IDF). TF-IDF weightedthe words calculating the number of words that appear in a document. Second, grouping all the training samples of each category of K-means algorithm, and take all the cluster centers as the new training sample. Third, the modified training samples are used for classification with KNN algorithm. Finally, calculate the accuracy of the evaluation using precision, recall and f-measure.
The simulation results show that the combination of the proposed algorithm in this study has a percentage accuracy reached 87%, an average value of f-measure evaluation= 0.8029 with the best k-values= 5 and the computation takes 55 second for one document.
General Terms
Data Mining, Text Classification, Clustering
Keywords
Text Classification, KNN classification Algorithm, K-means Cluster Algorithm, TF-IDF Method
1.INTRODUCTION
Text mining is a research area in computer science trying to find a solution due to information overload by combining techniques from data mining, machine learning, information retrieval, and knowledge management [1]. It seeks to extract and discover something previously unknown and contains very useful information from a collection of large amounts of textual data [2]. The benefits of text mining are to facilitate the search and to create innovations that can help people understanding and using information from a document repository [3]. One of learning science from text mining is a text classification. In the process, text classification earliest stage are called preprocessingthat includes case folding, tokenizing, filtering, stemming and
analyzing which is the stage of determining how far the relationship between words in a document [4]. After finishing preprocessing stage, information acquired as a set of tokens or
important words in its basic form without augmentation. Next step is to perform the weighting term into a numerical form using Term Frequency-Inverse Document Frequency (TF-IDF) method.For the classification, there are several algorithms used, one of which is K-Nearest Neighbors. Nearest neighbor search is one of the most popular learning and classification techniques introduced by Fix and Hodges [5], which had been proved to be a simple and powerful recognition algorithm. It finds a group of
k objects in the training set that are closest to the test object, and bases the assignment of a label on the predominance of a particular class in this neighborhood [6].
The traditional KNN text classification has three limitations. First, high calculation complexity to find out the k nearest neighbor samples, all the similarities between the training samples must be calculated. With less training samples, calculation time is not significant, but if the training set contains a huge number of samples, the KNN classifier needs more time to calculate the similarities [7]. This problem can be solved in 3 ways: reducing the dimensions of the feature space; using smaller data sets; or using improved algorithm which can accelerate to [8]. Second, dependence on the training set: the classifier is generated only with the training samples and it does not use any additional data. This makes the algorithm depend on the training set excessively; it needs recalculation even if there is a small change on training set. Third, no weight difference between samples: all the training samples are treated equally; there is no difference between the samples with small number of data or huge amount of data. So it doesn’t match the actual phenomenon where the samples commonly have uneven distribution.
classification. So, it can improve the accuracy, and minimize processing time.
This paper is organized as follows. Section 2 briefly explains the basic theory of text classification measures, such as data preprocessing, term weighting scheme, KNN algorithm, it combination with k-means clustering algorithm and evaluation. In section 3, we describe the use of datasets and the simulation result of the evaluation and processing time. Conclusion and future directions for this combination are mentioned in section 4.
2.METHODOLOGY
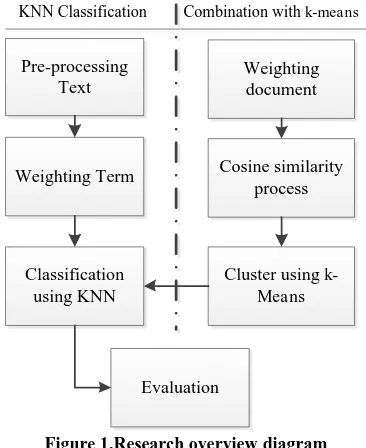
The overview diagram of this research is shown in Figure 1.
Pre-processing Text
Weighting Term
Classification using KNN
Cosine similarity process
Cluster using k-Means
Evaluation
KNN Classification Combination with k-means
Weighting document
Figure 1.Research overview diagram
2.1
Preprocessing Text
Preprocessing text is an early stage of text mining, consisting of:
1.
Case folding is the process to change all letters tolowercase. Only the letters ‘a’ to ‘z’ is possible, other
characters than letters is removed and considered as delimiters.
Figure 2. Case Folding process
2.
Tokenizing is the process of reducing a string to its individual. At this point, decrease of documents (parsing) into single words (token).Figure 3. Tokenizing process
3.
Filtering is the process to determine important words from its token. Its dispose the conjunction and wordsunimportant e.g. ‘yang’, ‘dan’, ‘di’ etc.
4.
Stemming or lemmatizationis a technique for the reducting word onto their root. Many words in the Indonesian language can be reduced to their base form or stem e.g.‘setuju’, ‘menyetujui’, ‘persetujuan’, and ‘disetujui’
belongs to ‘tuju’.
Figure 4. Filtering and Stemming Process
The aim of this layer is to preparestructured documents data in the formof numerical values, to become a source of data to be processed further [12][13][14].
2.2
Term Weighting Schemes
After completing the text preprocessing, the next step is weighting the term using Term Frequency – Inverse Document Frequency(TF-IDF)method. Term Frequency (TF) is term weighting based on the words frequency that appear in a document. The higher the TF value of a word in a document, higher the effect of that term on the document. Inverse Document Frequency (IDF)is weighting method based on number of words that appear throughout all the documents. The formulation of this method is as follows;
, = , log (1)
w(d,t) : term weights in document d
tf(t,d) : termfrequencyt in documentd
N : the total number of documents nt : number of documents that have term t
Figure 5. Term weighting
2.3
Classification with KNN Algorithm
K-nearest neighbor is a supervised learning algorithm where the result of new instance query is classified based on majority of K-nearest neighbor category. The purpose of this algorithm is to classify a new object (document) based on attributes (words) and training samples. It works by usingminimum distance from the query instance to the training samples to determine the K-nearest neighbors [17]. Suppose that there are j training categories as C1, C2,...Cj, and the sum of the training samples is
N. After preprocessing and weighting term for each document, they all become m-dimension feature vector. The process of KNN algorithm to classify document X is: [18]
1. Make document X to be same text feature vector form (X1,X2,…Xm) as all training samples.
2. Calculate the similarities between all training samples and document X. Taking the ith document di (di1,di2,…dim) as an
example, the similarity SIM(X,di)is as following;
�� �, = =1�.
=1�
2
. =1
2 (2)
3. Choose k samples which are larger from N similarities of
SIM(X,di), (i= 1,2,…,N), and treat them as a KNN collection
of X. Then calculate the probability of X belong to each category respectively with the following formula.
� �,� = �� �, . ( ,�) (3) 4. Where, y(di,Cj) is a category attribute function,
,� = 1, �
0, � (4)
5. Judge document X to be category which has the largest
P(X,Cj)
2.4
Combination with K-Means Clustering
In the traditional KNN algorithm, all training samples were used for training, that is, whenever a new test sample need to be classified, it is necessary to calculate similarities between that sample and all documents in the training sets, and then choose k-nearest neighbor samples which have largest similarities. Due to numbers of calculation taken between the test sample and all the training samples, the traditional method of KNN has great calculation complexity. To overcome the complexity, this paper introduced combination KNN with a clustering method. First, calculate the weight of each document by summing all term weight and divide it with total term in the document. Second,
each category of training sample is clustered by K-means
algorithm [19][20]:
1. Initialize the value of K as the number of clusters of document to be created.
2. Generate the centroid randomly
3. Assign each object to the group that has be closest centroid 4. Update the centroid by calculating the average value of the
existing data on the cluster;
� = 1 =1 (5)
Ci : centroid to-i from the cluster
n : number of documents in a cluster dj : document vector to-j
5. Repeat step 3 and 4 until the centroids no longer move (convergent). This produces a separation of the objects into groups from which the metric to be minimized can be calculated.
After clustering for each category, the cluster centers were chosen to represent the category and they become the new training sets for KNN algorithm. By this method, the number of samples for training is reduced efficiently, so the time for calculating similarities in KNN algorithm also reduced.
2.5
Evaluation
When evaluating of text classifiers, it must consider both classification accuracy rate and recall rate [21]. Its measurement using F-measure with matrix confusion standard are shown in the following table [22].
Table 1. Matrix Confusion Cluster by
system
Cluster is actually
Yes Not
Yes a b
Not c d
The number of document which are Cj category in fact and also
the classifier system judge them to Cj category is a; the number
of the documents which are not Cj category in fact but the
classifier system judge them to category Cj is b; the number of
the documents which are Cj category in fact but the classifier
system don’t judge them to Cj category is c; the number of
documents which are not Cj category in fact and also the
classifier system don’t judge them to Cj category is d.
Recall is measure of the document was successfully classified by system of all document should be correct [23][24];
=
+ (6)
Precision is level of accuracy from clustering results. That is, how many percent all the result cluster documents is declared properly;
=
+ (7)
F-measure is a combination of recall and precision which is defined by [24];
�= 2
3.EXPERIMENTS AND RESULTS
3.1
Experimental Data and Environment
The experimental data used in this paper is from news website
www.detik.com and www.kompas.com. The number of documents sample is 802 with 5915 terms and 6 categories that is, General News (BeritaUmum), Business Economics (EkonomiBisnis), Education and Science (EdukasidanSains), Health (Kesehatan), Sports (Olahraga), Technology (Teknologi). 90 documents offline prepared for testing, each category of 10
Experiment environments: AMD processor AthlonTM II P360
Dual Core 2.30 GHz, 4GB Memory, Windows & Ultimate 32-bit Operating System, Microsoft Visual Studio 2008 – Vb.Net and MySQL for database.
3.2
Experiments and Analysis
In this paper, we designed 2 experiments to verify the validity of the algorithm as follows:
Experiment 1: using the traditional KNN classification to determine k-values effect of the accuracy system of each category for the test documents which has been prepared. Tests results are shown in Table 3.
Table 3.evaluation result classification using KNN
Category K Precision Recall F-Measure
General News 2 0,4322 0,5422 0,4810
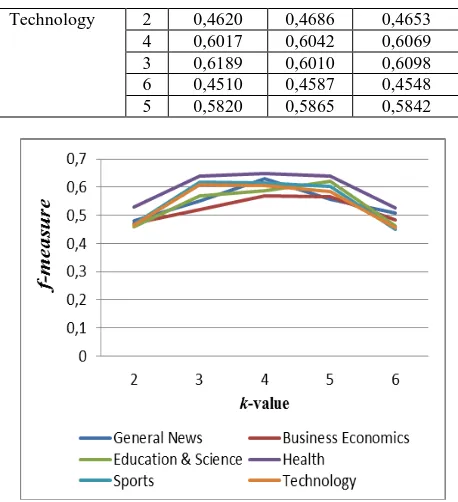
Figure 2.graphic evaluation using KNN algorithm
Experiment 2: using the cluster center as a new training sample that will be used again in KNN classification, after cluster using
k-means algorithm. Parameter k which indicates the number of clusters is determined at the beginning before the classification process of each category. To avoid a large difference between each category of training, we give the parameter k as an estimate. We tried to compare some parameter k for each category and record the k-values which have the best clustering effect. The best k-value, the number of removed samples and number of left samples are given in Table 4.
Table 4.K-values and Number of Removed/Left samples
Category
k-Table 5.evaluation result after combination with k-means
Category K Precision Recall F-Measure
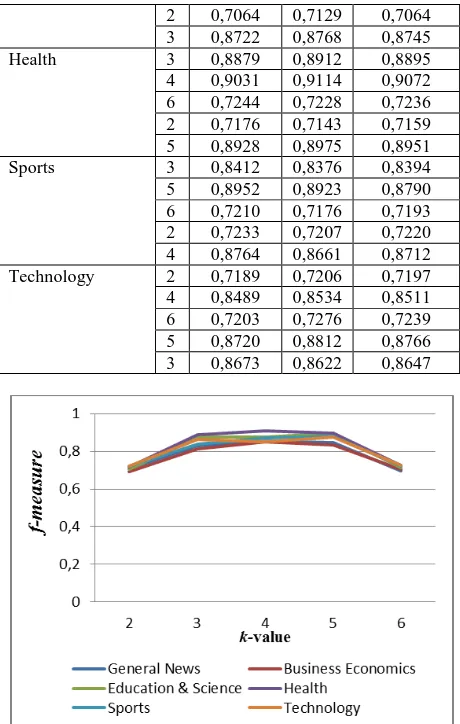
2 0,7064 0,7129 0,7064 3 0,8722 0,8768 0,8745 Health 3 0,8879 0,8912 0,8895 4 0,9031 0,9114 0,9072 6 0,7244 0,7228 0,7236 2 0,7176 0,7143 0,7159 5 0,8928 0,8975 0,8951 Sports 3 0,8412 0,8376 0,8394 5 0,8952 0,8923 0,8790 6 0,7210 0,7176 0,7193 2 0,7233 0,7207 0,7220 4 0,8764 0,8661 0,8712 Technology 2 0,7189 0,7206 0,7197 4 0,8489 0,8534 0,8511 6 0,7203 0,7276 0,7239 5 0,8720 0,8812 0,8766 3 0,8673 0,8622 0,8647
Figure 3.graphic evaluation after combination with k-means
Figure 2 shows that the classification result with traditional KNN algorithm has an average value of f-measure evaluation= 0.5496 with the best k-value = 4.
Figure 3 shows an increase in the value of f-measure evaluation and more stable, after the combination with k-means algorithm. The average value of f-measure evaluation = 0.8029 with the best k-value = 5.
In such cases, if the initial selection of the k-value doesn’t provide a classification solution, we add or subtract the k-value. K-values commonly used = 3, 4 or 5 and shown below.
Tabel 6.F-measure average with KNN algorithm
Category k-values
2 3 4 5 6
General
News 0,4810 0,5520 0,6297 0,5581 0,5066 Business
Economics 0,4705 0,5209 0,5677 0,5660 0,4824 Education
& Science 0,4593 0,5676 0,5886 0,6198 0,4611 Health 0,5282 0,6392 0,6497 0,6403 0,5277 Sports 0,4671 0,6192 0,6136 0,6019 0,4498 Technology 0,4653 0,6098 0,6069 0,5842 0,4548 Average 0,4786 0,5848 0,6094 0,5951 0,4804
Tabel 7.f-measure average after combination
Category k-values
2 3 4 5 6
General
News 0,7104 0,8309 0,8534 0,8445 0,6949 Business
Economics 0,6932 0,8121 0,8491 0,8336 0,7032 Education
& Science 0,7064 0,8745 0,8750 0,8958 0,7115 Health 0,7159 0,8895 0,9072 0,8951 0,7236 Sports 0,7220 0,8394 0,8712 0,8790 0,7193 Technology 0,7197 0,8647 0,8511 0,8766 0,7239 Average 0,7113 0,8518 0,8678 0,8707 0,7127
Figure 4.graphic evaluation KNN and k-means
Figure 4 shows a comparison of evaluation results using KNN and k-means algorithm. Percentages levels of accuracy in KNN algorithm is about 75%. Whereas, the k-means algorithm about 87%.
3.3
Execution Time
In this research, we recorded the computation time required to execute the two experiments. Complete classification KNN algorithm in one document takes 1 minute 45 seconds (pre-processing time excluded). Second experiment, clustering with
k-means algorithm takes 1 hour to produce 55 new sample documents from the centroid. Afterwards, processing time of calculation by KNN algorithm is reduced to 55 seconds for one document. So, it can be seen that the combination is proposed in this study can reduce the time complexity of traditional KNN algorithm.
4.CONCLUSION AND FUTURE WORK
After combination with k-means algorithm, experimental results shows an increase in evaluation value, especially during the initial k-value = 3, 4 or 5, with an average value of f-measure between 0.8518 – 0.8702 and the reduction of computing time.
For future work, experiments can be performed by combining the traditional KNN with algorithm that higher level of accuracy, method for determining k-values automatically and more efficiently, and methods for determining the initial centroid in k-means algorithm.
5.
ACKNOWLEDGMENTS
Our thank goes to Department of Information TechnologyUdayana University, Bali, Indonesiawho has helped organize this research.
6.REFERENCES
[1]. Feldman, Ronen and Sanger, James.2007. The Text Mining Handbook Advanced Approaches in Analyzing Unstructured Data. New York: Cambridge University Press.
[2]. Hearst, Marti.2003. What is text mining?. SIMS, UC Berkeley. http://www.sims.berkeley.edu/~hearst/text-mining.html
[3]. Srivastava, Ashok N. and Sahami, Mehran.2009. Text Mining Classification, Clustering, and Application. New York: CRC Press
[4]. Herwansyah,Adhit. 2009. AplikasiPengkategorianDokumendanPengukuran Tingkat SimilaritasDokumenMenggunakan Kata KuncipadaDokumenPenulisanIlmiahUniversitasGunadarma .
http://www.gunadarma.ac.id/library/articles/graduate/comp uter-science/2009/Artikel_10105046.pdf
[5]. E. Fix and J. Hodges Discriminatory analysis. Nonparametric discrimination: Consistency properties. Technical Report 4, USAF School of Aviation Medicine Randolph Field, Texas, 1951.
[6]. Xindong Wu and Vipin Kumar. The Top Ten Algorithms in Data Mining. Chapman & Hall/CRC. New York: CRC Press
[7]. W. Yu, and W. Zhengguo, A Fast kNN algorithm for text categorization, Proceedings of the Sixth International Conference on Machine Learning and Cybernetics, Hong Kong, pp.3436-3441, 2007.
[8]. Yang Y, Pedersen J O. A comparative study on feature selection in text categorization, ICNL,1997, pp.412-420
[9]. Zhou Yong, LiYouwen and Xia Shixiong. 2009. An Improved KNN Text Classification Algorithm Based on Clustering. Journal of Computers, vol.4,no.3
[10].N.Suguna and Dr.K.Thanushkodi.2010. An Improved k-Nearest Neighbor Classification Using Genetic Algorithm.International Journal of Computer Science Issues, vol.7,Issue 4,No.2
[11].Elisabeth, Hendrice. 2009. News Text Classification by Weight Adjusted K-Nearest Neighbor (WAKNN). InstitutTeknologi Telkom, Bandung,Indonesia.
[12].Garcia, Dr. E. 2005. The Classic Vector Space Model (Description, Advanteges and Limitations of the Classic Vector Space Model).
[13].Baldi, P, P. Frasconi, dan P. Smyth. 2003. ModellingThe Internet and The Web: Probabilistic Methods and Algorithms. New York: John and Willey & Sons.
[14].Keno Buss. Literature Review on Preprocessing for Text Mining. STRL, De Montfort University.
[15].Ramos, Juan. 2006. Using TF-IDF to Determine Word Relevance in Document Queries. Department of Computer Science, Rutgers University. http://www.cs.rutgers.edu/~mlittman/courses/m103/iCML0 3/papers/ramos.pdf
[16].Atila Elci.2011. Text Classification by PNN Term Re-Weighting. Turkey. International Journal of Computer Application Vol 29-No.12, September 2011
[17].Teknomo, Kardi. K-Nearest Neighbors Tutorial. http://people.revoledu.com/kardi/tutorial/KNN/index.html
[18].Yang Lihua, Dai Qi, GuoYanjun, Study on KNN Text Categorization Algorithm, Micro Computer Information, No.21, 2006, pp.269-271
[19].Xu, RuidanWunsch, D.C. 2009. Clustering. New York: John Wiley & Sons
[20].Khaled W. Alnaji and Wesam M. Ashour. 2011. A Novel Clustering Algorithm using K-means (CUK). The Islamic University of Gaza. International Journal of Computer Applications Vol 25 No.1 July 2011
[21].Xinhao Wang, DingshengLuo, Xihong Wu, Huisheng Chi, Improving Chinese Text Categorization by Outlier Learning, Proceeding of NLP-KE’05, pp. 602-607
[22].Lewis, D. 1995. Evaluating and Optimizing Autonomous Text Classification Systems. AT&T Bell Laboratories Murray Hill, NJ 07974. USA. Proceedings of the Eighteenth Annual International ACM-SIGIR Conference on Research and Development in Information Retrieval, July, 1995, pp. 246-254 http://net.pku.edu.cn/~wbia/2005/public_html/papers/classi fication/
[23].Tala, Fadillah Z, 2003. A Study of Stemming Effects on Information Retrieval in Bahasa Indonesia. Master of Logic Project. Institute for Logic, Language and Computation. Unversiteitvan Amsterdam. The Netherlands.www.illc.uva.nl/Publications/ResearchReports /MoL-200302.text.pdf