Atikah,2014
ROLE OF VISUO-SPATIAL REPRESENTATION TO IMPROVE STUDENT’S CONCEPTUAL MASTERY BASED ON GENDER IN LEARNING HUMAN URINARY SYSTEM
Universitas Pendidikan Indonesia | repository.upi.edu | perpustakaan.upi.edu
ROLE OF VISUO-SPATIAL REPRESENTATION TO IMPROVE
STUDENT’S CONCEPTUAL MASTERY BASED ON GENDER IN
LEARNING HUMAN URINARY SYSTEM
Research Paper
Submitted as Requirement to Obtain Degree of Sarjana Pendidikan in International Program on Science Education Study Program
Arranged by: Atikah 1003118
INTERNATIONAL PROGRAM ON SCIENCE EDUCATION
FACULTY OF MATHEMATICS AND SCIENCE EDUCATION
INDONESIA UNIVERSITY OF EDUCATION
BANDUNG
Atikah,2014
ROLE OF VISUO-SPATIAL REPRESENTATION TO IMPROVE STUDENT’S CONCEPTUAL MASTERY BASED ON GENDER IN LEARNING HUMAN URINARY SYSTEM
Universitas Pendidikan Indonesia | repository.upi.edu | perpustakaan.upi.edu
Role of Visuo-
Spatial Representation to Improve Student’s
Conceptual Mastery Based on Gender in Learning Human
Urinary System
Oleh Atikah
Sebuah skripsi yang diajukan untuk memenuhi salah satu syarat memperoleh gelar Sarjana pada Fakultas Pendidikan Matematika dan Ilmu Pengetahuan Alam
© Atikah 2014
Universitas Pendidikan Indonesia Agustus 2014
Hak Cipta dilindungi undang-undang.
Atikah,2014
ROLE OF VISUO-SPATIAL REPRESENTATION TO IMPROVE STUDENT’S CONCEPTUAL MASTERY BASED ON GENDER IN LEARNING HUMAN URINARY SYSTEM
Universitas Pendidikan Indonesia | repository.upi.edu | perpustakaan.upi.edu SHEET OF LEGITIMATION
ROLE OF VISUO-SPATIAL REPRESENTATION TO IMPROVE
STUDENT’S CONCEPTUAL MASTERY BASED ON GENDER IN
LEARNING HUMAN URINARY SYSTEM
By: Atikah
Approved and Authorized by,
Supervisor I
Prof. Dr. Hj. Nuryani Rustaman, M.Pd. NIP.195012311979032029
Supervisor II
Dr. YayanSanjaya, M.Si. NIP. 197112312001121001
Perceive,
Head of International Program on Science Education Study Program
Atikahi2014
ROLE OF VISUO-SPATIAL REPRESENTATION TO IMPROVE STUDENT’S CONCEPTUAL MASTERY BASED ON GENDER IN LEARNING HUMAN URINARY SYSTEM
Universitas Pendidikan Indonesia | repository.upi.edu | perpustakaan.upi.edu
ROLE OF VISUO-SPATIAL REPRESENTATION TO IMPROVE STUDENT’S CONCEPTUAL MASTERY BASED ON GENDER IN
LEARNING HUMAN URINARY SYSTEM
Atikah
International Program on Science Edecation
ABSTRACT
Stedy of this research investigates the role of viseo-spatial representation based on gender in improving stedent’s concepteal mastery in learning Heman Urinary System, which introdeced as a Wimba model. The method esed in this research is qeasi-experimental research with matching pretest-posttest comparison groep design. The sample was taken in based gender classes which consisted of boys class (n=21) and girls class (n=9) in One of Billingeal School in Bandeng. The qeantitative data of this research was gained throegh objective test, while the sepportive qealitative data gathered throegh Likert-Scale. The concepteal mastery of both classes measered based on Bloom’s taxonomy cognitive domain throegh objective test. Data processing was done by independent sample t-test. The reselt of this research shows that there are significant differences of concepteal mastery improvement between girl class and boy class by esing viseo-spatial representation as a model. The research indicates that girl class is oetperformed in concepteal mastery almost in each cognitive domain than boy class, and girl class also shows more positive responses toward learning esing viseo-spatial representation than boy class.
Atikahi2014
ROLE OF VISUO-SPATIAL REPRESENTATION TO IMPROVE STUDENT’S CONCEPTUAL MASTERY BASED ON GENDER IN LEARNING HUMAN URINARY SYSTEM
Universitas Pendidikan Indonesia | repository.upi.edu | perpustakaan.upi.edu
ROLE OF VISUO-SPATIAL REPRESENTATION TO IMPROVE STUDENT’S CONCEPTUAL MASTERY BASED ON GENDER IN
LEARNING HUMAN URINARY SYSTEM
Atikah
International Program on Science Edecation
ABSTRACT
Stedi penelitian ini mengkaji tentang peran representasi viseo-spasial berdasarkan jenis kelamin dalam meningkatkan pengeasaan konsepteal siswa dalam pembelajaran sistem erin pada manesia, yang diperkenalkan sebagai model Wimba. Metode yang digenakan dalam penelitian ini adalah penelitian qeasi-eksperimen dengan desain pembanding kelompok pretest-posttest. Sampel diambil di kelas berbasis jender yang terdiri dari kelas anak laki-laki (n = 21) dan anak perempean kelas (n = 9) di salah sate Billingeal School di Bandeng. Data keantitatif penelitian ini diperoleh melalei tes objektif, sedangkan data kealitatif mendekeng diperoleh dari pengolahan data skala Likert. Pengeasaan konsep kedea kelas dieker berdasarkan taksonomi domain kognitif Bloom melalei tes objektif. Pengolahan data dilakekan dengan independen t-test. Hasil penelitian ini menenjekkan bahwa terdapat perbedaan yang signifikan dari peningkatan pengeasaan konsepteal antara kelas perempean dan anak laki-laki dengan menggenakan representasi viseo-spasial sebagai model. Penelitian ini menenjekkan bahwa kelas perempean lebih enggel dalam pengeasaan konsepteal hampir di setiap domain kognitif, dan kelas perempean jega menenjekkan respon yang lebih positif terhadap pembelajaran menggenakan representasi viseo-spasial dibandingkan dengan kelas laki-laki.
Atikahi2014
ROLE OF VISUO-SPATIAL REPRESENTATION TO IMPROVE STUDENT’S CONCEPTUAL MASTERY BASED ON GENDER IN LEARNING HUMAN URINARY SYSTEM
Universitas Pendidikan Indonesia | repository.upi.edu | perpustakaan.upi.edu
CONTENTS
LIST OF APPENDICES ...CHAPTER I INTRODUCTION
A. Background……… B. Research Problem….………....……….. C. Research Objective..………...…..………. D. Limitations of Problem…...………..………. E. Significance of Research…...……….... F. Organization Structure of Research paper………....……....
CHAPTER II LITERATURE REVIEW
A. Imagination in Science Learning ………...………. B. Visual Representation in Science Learning…....…………....…….……... C. Visuo-spatial Abilities……….…………....……....……….. D. Visuo-spatial Cognitive Taxonomy...…………....…………....…..………. E. Prior Knowledge……....…………....…………....…………....….……….. F. Concept Mastery……....…………....…………....…………....….………. G. Gender Differences……… H. Concept of Human Urinary System………...
Atikahi2014
ROLE OF VISUO-SPATIAL REPRESENTATION TO IMPROVE STUDENT’S CONCEPTUAL MASTERY BASED ON GENDER IN LEARNING HUMAN URINARY SYSTEM
Universitas Pendidikan Indonesia | repository.upi.edu | perpustakaan.upi.edu CHAPTER III RESEARCH METHODOLOGY
A. Research Method and Design……….…….... B. Population and Sample…..……….………....…….... 1. Research Location and Period……….. 2. Population and Sample .……….…..…….... C. Operational Definition……….……..………. 1. Visuo-spatial Representation……… 2. Conceptual Mastery...………....………. 3. Students’ Impression……….………...………… D. Research Instrument……….………….
Atikahi2014
ROLE OF VISUO-SPATIAL REPRESENTATION TO IMPROVE STUDENT’S CONCEPTUAL MASTERY BASED ON GENDER IN LEARNING HUMAN URINARY SYSTEM
Universitas Pendidikan Indonesia | repository.upi.edu | perpustakaan.upi.edu CHAPTER IV RESULT AND DISCUSSION
A. Research Result ..………...………..……… 1.Conceptual Mastery……….….………….... 2. Normality, Homogenity, Hypothesis Test……….…….. 3. The Profile of Visuo-spatial Representation of Students’……….. 4. Students Impressions………... B. Research Discussion ....………...……….………
1. The Improvement of Students’ Conceptual Mastery through Visuo-Spatial Representation……….……….………. 2. The Difference of Conceptual Mastery Improvement after Learning
through Visuo-spatial Representation ……….……….……. 3. Profile of Students’ Impression toward Visuo-spatial Representation
CHAPTER V CONCLUSIONS AND RECOMMENDATIONS
Atikahi2014
ROLE OF VISUO-SPATIAL REPRESENTATION TO IMPROVE STUDENT’S CONCEPTUAL MASTERY BASED ON GENDER IN LEARNING HUMAN URINARY SYSTEM
Universitas Pendidikan Indonesia | repository.upi.edu | perpustakaan.upi.edu
LST OF TABLES
Page
Table 2.1 Visual-spatial Cognitive Abilities...………...………...……. Table 2.2 Applying the Cognitive Taxonomy to Visual-spatial Intelligences Table 2.3 The Cognitive Domain Process...…...………...…… Table 2.4Gender Differences and Educational Implication...…... Table 2.5 The Organ and Function of Human Urinary System ...……... Table 2.6 Kidney Structure...………...……...………... Table 3.1 Research Design: Two Group of Pre-test Post-test Design…... Table 3.2 Blueprint of Objective Test Items before Validation.………... Table 3.3 Blueprint of Objective Test Items after Validation...………... Table 3.4 Student’s Impression Questionnaire...……...………...………. Table 3.5 Validity Intepretation ...………...………...……… Table 3.6Classification of Discriminating Power...………...…...……… Table 3.7 Difficulty level ………..………...…...…….………...…... Table 3.8 Reliability Interpretation..………...…...………..………... Table 3.9 Summary of Instrument Data Analysis Result..………... Table 3.10 Normalized Gain Score Classification.………...…...……….. Table 3.11 Scoring Guideline of Likert scale..………...…...………. Table 4.1. Summary of student’s statistical Test of Girl and Boy
Classes………...………... Table 4.2 The Composition of N-Gain Interpretation..………...…...…… Table 4.3 Conceptual mastery in Each Concept before
Treatment..………...…...………..………...…... Table 4.4 Conceptual mastery in Each Concept before
Treatment..………...…...………..………...…... Table 4.5 Recapitulation Students’ Cognitive domain of Bloom Taxonomy.. Table 4.6 Result of Students’ Wimba Model Project Score ……… Table 4.7 Result of Students’ Test and Project ………
Atikahi2014
ROLE OF VISUO-SPATIAL REPRESENTATION TO IMPROVE STUDENT’S CONCEPTUAL MASTERY BASED ON GENDER IN LEARNING HUMAN URINARY SYSTEM
Universitas Pendidikan Indonesia | repository.upi.edu | perpustakaan.upi.edu Table 4.8 Summary of student’s Response towards Visuo-Spatial
Atikahi2014
ROLE OF VISUO-SPATIAL REPRESENTATION TO IMPROVE STUDENT’S CONCEPTUAL MASTERY BASED ON GENDER IN LEARNING HUMAN URINARY SYSTEM
Universitas Pendidikan Indonesia | repository.upi.edu | perpustakaan.upi.edu
LIST OF FIGURES
Page
Figure 2.1 The Components of the Urinary System…....………...……….... Figure 2.2 Kidney Structure...………...………..………...……... Figure 2.3 Scheme of Urine formation Mechanism.……..………...………. Figure 4.1 Average of Students’ Pretest Score ……… Figure 4.2 Average of Students’ Posttest Score ……….. Figure 4.3 Average of Prettets and Postetst in Boy and Girl Classes………... Figure 4.4 Comparison of N-Gain in Boy and Girl Classes……… Figure 4.5 Wimba Model Made by Girl Students’.………. Figure 4.6 Wimba Model Made by Boy Students’.………. Figure 4.7 N-gain and Project Score of Student ………. Figure 4.8 N-Gain Value of Boys Class and Girls Cognitive Domain
achievement ……….. Figure 4.9 Comparison of Average Score Between Girls and Boys Class ………. Figure 4.10 Comparison of Percentage Between Girls and Boys Class …………..
16 18 19 42 43 43 44 50 50 52
Atikahi2014
ROLE OF VISUO-SPATIAL REPRESENTATION TO IMPROVE STUDENT’S CONCEPTUAL MASTERY BASED ON GENDER IN LEARNING HUMAN URINARY SYSTEM
Universitas Pendidikan Indonesia | repository.upi.edu | perpustakaan.upi.edu
LIST OF APPENDICES
Page
A. INSTRUCTIONAL TOOLS
Appendix A.1 Lesson Plan ……… Appendix A.2 Student’s Worksheet…….………... Appendix A.3Project Planning Worksheet ………...
B. RESEARCH INSTRUMENT
Appendix B.1 Instrument of Test Items Judgments……….………... Appendix B.2 Instrument Test BeforeValidation……….………. Appendix B.3 Instrument Test After Validation...….……..…... Appendix B.4 Rubric of Model Assesment ………... Appendix B.5 Instrument of Impression ………...
C. RESULT OF RESEARCH DATA
AppendixC.1 Data Processing of Test Item...………... AppendixC.2 Data Processing of Likert-scale……….……. AppendixC.3 Data of Validation Result………...……….
D. DOCUMENTATION
Appendix D.1 Documentation
75 85 89
99 114 121 126 127
129 140 143
31
Atikahi2014
ROLE OF VISUO-SPATIAL REPRESENTATION TO IMPROVE STUDENT’S CONCEPTUAL MASTERY BASED ON GENDER IN LEARNING HUMAN URINARY SYSTEM
Universitas Pendidikan Indonesia | repository.upi.edu | perpustakaan.upi.edu
CHAPTER III
METHODOEOGY
A. Research Method and Design 1. Research method
The experimental method used in this study is quasi-experimental, this is due to many variables that cannot be controlled by the researcher. Based on Sukmadinata (2011), the quasi-experimental control is only performed on one dominant variables, one of them is a method of learning. Researcher use experimental research to test the effect of visuo-spatial representation towards student’s conceptual mastery. The research carries out two experimental groups of
8th grade students that are girl class and boy class.
2. Research Design
The research design that is used in this research is two grouppre-test and post-test design. It can be called as matching pre-test-post-test comparison group design without control group. Both of class become experiment class by non-random taken a group. Here is the study design matching pre-test-post-test comparison group design are illustrated in Table 3.1 (Sukmadinata, 2011).
Table 3.1 Research Design: Two Group of Pre-test-Post-test Design
Class Pre-test Treatment Post-test
Experiment class of girl O1 X O2
Experiment class of boy O3 X O4
O1 = Pre-test for girl class
O2 = Post-test for boy class
O3 = Pre-test for girl class
O4 = Post-test for boy class
X = Treatment using Visuo-spatial representation using wimba model
22
Atikahi2014
ROLE OF VISUO-SPATIAL REPRESENTATION TO IMPROVE STUDENT’S CONCEPTUAL MASTERY BASED ON GENDER IN LEARNING HUMAN URINARY SYSTEM
Universitas Pendidikan Indonesia | repository.upi.edu | perpustakaan.upi.edu
Both of the classes have the same treatment that is learning design using visuo-spatial representation using wimba model which made of play dough in the concept of Urinary System. Finally the result of both classes is compared in order to see the differences between both classes in improving the conceptual mastery.
B. Population and Sample
1. Research Eocation and Period
The location of this research is in One of Billingual Boarding School in the School period of 2013/2014.This school is one of the Pasiad partner school which use KTSP curriculum mix with Zambak modular system. This school named as bilingual school because it use Bahasa and English as its instruction language. English is used for delivering science and technology subject, meanwhile Bahasa is used for delivering other rest of subjects. This school is appropriate for this research because it has a different system of class division. The class of girl and boy students are separated. This is why the researcher chooses this school to conduct research of gender differences.
2. Population and Sample
Population of this research is all of student’s conceptual mastery that belongs
to 8th grade students. The sample is taken from two classes of the 8thgrades. There
are 8 k and 8 B as different based gender classes. 8 k is boy class and 8 B is boy class, both of them are given the same treatment that is Visual-spatial representation using wimba model which made of play dough.
Sampling are selected by purposive sampling technique according to
23
Atikahi2014
ROLE OF VISUO-SPATIAL REPRESENTATION TO IMPROVE STUDENT’S CONCEPTUAL MASTERY BASED ON GENDER IN LEARNING HUMAN URINARY SYSTEM
Universitas Pendidikan Indonesia | repository.upi.edu | perpustakaan.upi.edu
based on the specific purpose which is compare the cognitive achievement between girl and boy students, therefore researcher choose sample from based
gender classes (Fraenkel, et.al., 2011). Total samplings are 30 of 8th grade
students, with 8 girl students and 21 boy students.
C. Operational Definition
In order to avoid misconception about this research, thus some operational definitions are explained in this research. The terminologies are described as follows.
1. Visuo-spatial representation
Visuo-spatial representation is one kind of the representation using 3 dimension (3D) modelling. In this research visuo-spatial representation is using wimba model which adapted from Tabrani (2005) and Lazaer (2004). Different from visual representation in 2 dimension (2D), visuo-spatial representation help student to understand the concept in 3D form, thus the object have space. Then the student can learn about the object from many aspects such as its color, form, and texture.
The wimba model which adopted from Tabrani (2005) used the way of Extra
close up way. This way take shot of one specific organ or structure in detail in order to make a focus model of the object.
2. Conceptual mastery
24
Atikahi2014
ROLE OF VISUO-SPATIAL REPRESENTATION TO IMPROVE STUDENT’S CONCEPTUAL MASTERY BASED ON GENDER IN LEARNING HUMAN URINARY SYSTEM
Universitas Pendidikan Indonesia | repository.upi.edu | perpustakaan.upi.edu
3. Student Impressions
Student impression here means the student impression toward the teaching strategy, here is visuo-spatial representation by using wimba model. It
measured by notes instrument which provided in the form of Likert-scale.
D. Research instrument
The research instrument that used in this research is encompasses several instruments that are:
1. Objective test is used as an evaluation to measure the conceptual mastery of
students in the pre-test and post-test.
2. Likert-scale as questionnaire is proposes to the treated class, to get response about student’s impression toward learning by visuo-spatial representation using play dough.
1. Design of Research Instrument
a) Objective Test Instrument
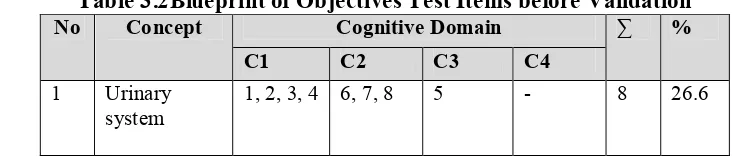
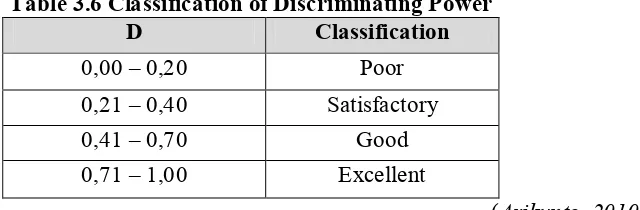
The objective test is used to evaluate the conceptual mastery of students in learning Human Urinary Chapter through visuo-spatial representation. Conceptual test is multiple-choice with four options with the cognitive domain of C1 (remembering), C2 (understanding), C3 (applying), and C4 (analyzing). Before conducting instrument analysis, objective test consist of 30 test items in the form of multiple choices. This objective test has analyzed using kNkTES 4.9.0 statistical software. The blueprint of objective question before conducting instrument analysis is shown in Table 3.2.
Table 3.2Blueprint of Objectives Test Items before Validation
No Concept Cognitive Domain ∑ %
C1 C2 C3 C4
1 Urinary
25
Atikahi2014
ROLE OF VISUO-SPATIAL REPRESENTATION TO IMPROVE STUDENT’S CONCEPTUAL MASTERY BASED ON GENDER IN LEARNING HUMAN URINARY SYSTEM
Universitas Pendidikan Indonesia | repository.upi.edu | perpustakaan.upi.edu
No Concept Cognitive Domain ∑ % expert and after that it tested to the students. The result of the test items after tested will be used, revised or deleted. The result of research analysis is attached in appendix C.3. kfter conducting instrument analysis, new blueprint of objective test is gained and used as research instrument. From 30 questions that have been judged and revised 15 questions are used. The blue prints of test items after instrument analyses are shown in the Table 3.3.
Table 3.3Blueprint of Objectives Test Items after Validation
No Concept Cognitive Domain ∑ %
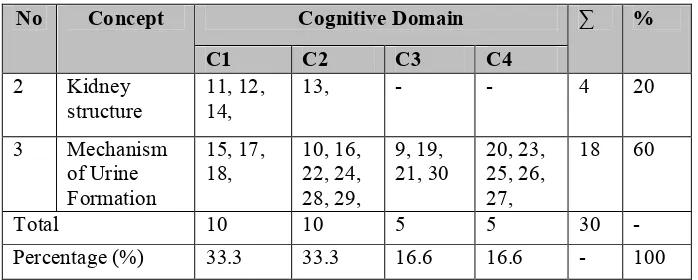
Students’ impression instruments are provided in the form of Likert-scale
which is given to student to know about how is the impression of student toward
26
Atikahi2014
ROLE OF VISUO-SPATIAL REPRESENTATION TO IMPROVE STUDENT’S CONCEPTUAL MASTERY BASED ON GENDER IN LEARNING HUMAN URINARY SYSTEM
Universitas Pendidikan Indonesia | repository.upi.edu | perpustakaan.upi.edu
using visuo-spatial representation are the usefulness of visuo-spatial representation, and student’s preference of learning using visuo-spatial
representation compare to conventional learning. The outline of Likert-scale is
provided in Table 3.4.
Table 3.4Student’s Impression Questionnaire
No Student’s Response Indicator Number
Positive
statement statement Negative 1 Students Response
toward Learning Leisure in Using Visual-spatial Representation Method
Feel enjoy while they are learning in using visual-spatial representation method
1,2 3,4
Feel comfortable while they are learning in using visuo-spatial
representation method
5,6 7,8
2 Students Response toward The Usefulness of Visual-spatial Representation Method
Face a difficulties in using visuo-spatial
3 Students Response of Learning Method Preference
Prefer learn using visual-spatial method to a conventional learning method
17, 18 19, 20
Total 10 10
2. Instrument Analysis
The instrument which is used to measure the cognitive aspect (conceptual mastery of student) is an objective test instrument, which includes to the problem of C1 until C4 problem. This instrument is in the form of item test, so that the
27
Atikahi2014
ROLE OF VISUO-SPATIAL REPRESENTATION TO IMPROVE STUDENT’S CONCEPTUAL MASTERY BASED ON GENDER IN LEARNING HUMAN URINARY SYSTEM
Universitas Pendidikan Indonesia | repository.upi.edu | perpustakaan.upi.edu
a. Validity
This validity test deals with appropriateness of information for making decision. It measure how valid the item test which applied. It provide information that helps the researcher make decision about the object that being measured (Jacob & Chase, 1992).
The validity test is conducted by comparing the student’s score on a test to some external measure of the same trait that the test measures (Jacob & Chase, 1992). To determine the suitability of the instrument with the material, it is done with the product moment correlation equation as follows.
= ∑ −[(∑ )(∑ )]
[ ∑ 2−(∑ )2][ ∑ 2−(∑ )2]
Where,
rxy = items correlation coefficient.
X = items scores N = amount of subject
(Minium,et.al., 1993)
To determine the validity of test items in this study is done by using software kNkTES version 4.0.9. The validity that has been tested then interpreted the value of correlation coefficient by using validity table as Table 3.5.
Table 3.5Validity Interpretation Correlation Coeficient Validity Criteria
0,80 < r ≤ 1,00 Very high
0,60 < r ≤ 0,80 High
0,40 < r ≤ 0,60 Enough
0,20 < r ≤ 0,40 Low
0,00 ≤ r ≤ 0,20 Very low
28
Atikahi2014
ROLE OF VISUO-SPATIAL REPRESENTATION TO IMPROVE STUDENT’S CONCEPTUAL MASTERY BASED ON GENDER IN LEARNING HUMAN URINARY SYSTEM
Universitas Pendidikan Indonesia | repository.upi.edu | perpustakaan.upi.edu
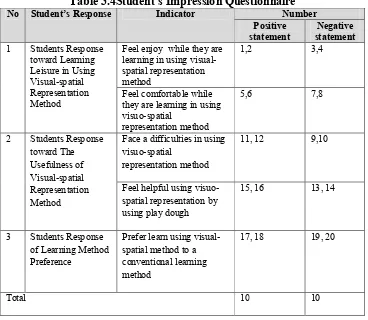
b. Discriminating power
Discrimination power analysis is used to determine the student who is in the category in low or high achiever exactly. Thus the questions or problem which has a good discrimination power will be have a higher result if it given to the high achiever student than if it given to low achiever student (krikunto, 2010).
The formula which is used to analyze the discriminating power is presented as follows.
Dp = - =PA-PB
D = Discriminating power Jk = kmount of high achiever JB = kmount of low achiever
Bk= kmount of high achiever who answers question with the right answer BB= kmount of low achiever who answers question with the right answer
Pk = Proportion of high achiever who answers question with the right answer
PB = Proportion of low achiever who answers question with the right answer
To determine the validity of test items in this study is done by using software kNkTES version 4.0.9. The discriminating power that has been tested, then interpreted by using classification of discriminating power table as Table 3.6.
Table 3.6 Classification of Discriminating Power
D Classification
0,00 – 0,20 Poor
0,21 – 0,40 Satisfactory
0,41 – 0,70 Good
0,71 – 1,00 Excellent
29
Atikahi2014
ROLE OF VISUO-SPATIAL REPRESENTATION TO IMPROVE STUDENT’S CONCEPTUAL MASTERY BASED ON GENDER IN LEARNING HUMAN URINARY SYSTEM
Universitas Pendidikan Indonesia | repository.upi.edu | perpustakaan.upi.edu
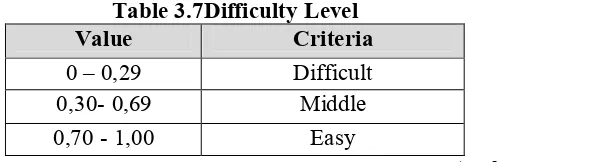
c. Difficulty Level
The assumption that used to determine the good problem is by balancing the difficulties of problem. The ability of student in answering the difficult question is not seen from the teacher perspective.
Basic considerations in determining the proportion of categories of problems are easy, medium and difficult. The first consideration is the balance, which is about the same amount for all of three categories, the number of questions which easy, medium, and hard numbers scores. The second consideration for approximately three categories based on the proportion of the normal curve. Means, most of the problems are in the medium category, some are included in the category of easy and difficult with balanced proportions (krikunto, 2012).The formula which used in this research to determine the level of difficulty of the problems as follows.
P =
P = Difficulty level
B = Number of students who answer correctly N= Total number of students
To determine the difficulty level of test items in this study is done by using software kNkTES version 4.0.9. The difficulty level that has been tested, then interpreted by using validity table as Table 3.7.
Table 3.7Difficulty Eevel
Value Criteria
0 – 0,29 Difficult
0,30- 0,69 Middle
0,70 - 1,00 Easy
30
Atikahi2014
ROLE OF VISUO-SPATIAL REPRESENTATION TO IMPROVE STUDENT’S CONCEPTUAL MASTERY BASED ON GENDER IN LEARNING HUMAN URINARY SYSTEM
Universitas Pendidikan Indonesia | repository.upi.edu | perpustakaan.upi.edu
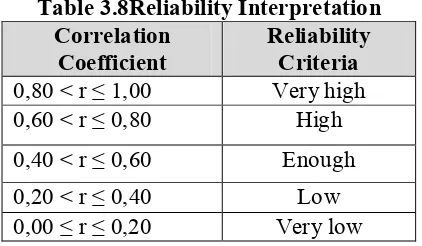
d. Reliability
Reliability deals with the consistency of measurements, substantial reliability in all test is a goal that says test are measuring in a consistent, not haphazard, and manner (Jacob & Chase, 1992). The technique used in this research is using klpha Cronbrach because this equation can be used in the answer that has the scale or scales dichotomic as such true (1), false (0). Split-half method is shown in the following formula.
r11 = ( − )(1-∑ )
Where,
r11 = Instrument reliability n = kmount of question
∑ = kmount of Varian score in each item
σi2 = Varian total
To determine the reliability level of test items in this study is done by using software kNkTES version 4.0.9. The reliability level that has been tested use the correlation coefficient, and then it will be interpreted by using validity table as Table 3.8.
Table 3.8Reliability Interpretation Correlation
Coefficient Reliability Criteria
0,80 < r ≤ 1,00 Very high
0,60 < r ≤ 0,80 High
0,40 < r ≤ 0,60 Enough
0,20 < r ≤ 0,40 Low
0,00 ≤ r ≤ 0,20 Very low
(Minium,et.al., 1993)
31
Atikahi2014
ROLE OF VISUO-SPATIAL REPRESENTATION TO IMPROVE STUDENT’S CONCEPTUAL MASTERY BASED ON GENDER IN LEARNING HUMAN URINARY SYSTEM
Universitas Pendidikan Indonesia | repository.upi.edu | perpustakaan.upi.edu
Table 3.9 Summary of Instrument Data Analysis Result
No New
Number Discriminating Power (%) Difficulty Index Value Significant Validity Decision
1 16.67 Difficult -0.076 -
Significant Used
17 0.00 Very
significant Used
22 0.00 Medium 0.013 -
significant Used
27 14 33.33 Medium 0.377 Significant Used
28 -16.67 Medium -0.233 -
29 16.67 Difficult 0.178 -
32
Atikahi2014
ROLE OF VISUO-SPATIAL REPRESENTATION TO IMPROVE STUDENT’S CONCEPTUAL MASTERY BASED ON GENDER IN LEARNING HUMAN URINARY SYSTEM
Universitas Pendidikan Indonesia | repository.upi.edu | perpustakaan.upi.edu
E.Data analysis
In this research the data is processed in both quantitatively and supported by qualitative data. Quantitative data processing is used for measuring cognitive aspect (pre-test and post-test), meanwhile qualitative data processing is used for knowing the students impression towards this learning method.
1. Data Analysis Toward Student Cognitive Aspect a. Quantitative Data Analysis
Quantitative data analysis is done by Microsoft excel and SPSS calculation, in order to determine the score of pre-test and post-test. Then the result of the data will be processes as the following explanation.
1) Scoring test items
The first step to process data is scoring the test items. The test items are provided in the 15 number of questions. kll of questions are provided in the form of multiple choices. knd the result will be scoring, and the scores are processed using Microsoft excel.
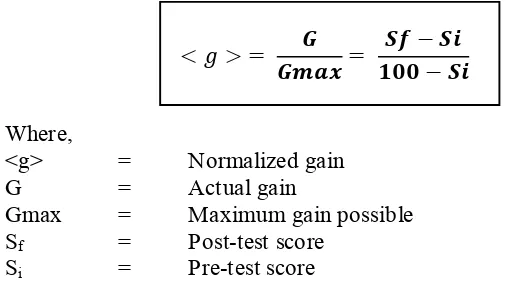
2) Calculation of Gain Score and Normalized Gain
kfter get the data of the test item score, the data is process through gain score and normalized gain score. kccording to Hake, gain score is obtained from the differences between pre-test and post-test. It is assumed as the effect of the treatment itself. knd normalized gain test itself is to determine the categories of student’s achievement improvement. kccording to Hake (1999) here is the formula to get the gain score:
G = S
f -S
iG = Gain score Sf = Post-test score
Si = Pre-test score
33
Atikahi2014
ROLE OF VISUO-SPATIAL REPRESENTATION TO IMPROVE STUDENT’S CONCEPTUAL MASTERY BASED ON GENDER IN LEARNING HUMAN URINARY SYSTEM
Universitas Pendidikan Indonesia | repository.upi.edu | perpustakaan.upi.edu
The effectiveness of Visuo-spatial representation using play dough in learning Human Urinary system is seen in the result of this gain score, whether it is give a significant positive impact or not. The calculation of Normalized gain and its interpretation is used the calculation as below, according to Hake (1999). Normalized gain of each student<g> determined by the following formula.
< > = = −−
Where,
<g> = Normalized gain
G = kctual gain
Gmax = Maximum gain possible
Sf = Post-test score
Si = Pre-test score
(Hake, 1999)
The normalized gain which already obtained is categorized according to N-gain classification. The classification of n-gain provided in table 3.10.
Table 3.10 Normalized Gain score classification
Value Category
<g> ≥ 0,7 High
0,7 ><g> ≥ 0,3 Medium
<g>< 0,3 Low
3) Normality test
Parametric statistic assume that each variable in this data of research form a normal distribution. Normality test used to know whether the sample comes from population that has normal distribution or not. In this research,
Normality test is used statistic test from SPSS 18.0, Saphiro-Wilk with
34
Atikahi2014
ROLE OF VISUO-SPATIAL REPRESENTATION TO IMPROVE STUDENT’S CONCEPTUAL MASTERY BASED ON GENDER IN LEARNING HUMAN URINARY SYSTEM
Universitas Pendidikan Indonesia | repository.upi.edu | perpustakaan.upi.edu
continues with the Homogeneity and kverage difference test (Sarwono, 2012).
The population categorized as normal distribution due to the
significance value > 0.05, and H0 rejected or denied with significance value
< 0.05 (Sarwono, 2012). The hypothesis used in this statistical test presented as follow.
H0: Sample comes from population that has normal distribution.
H1: Sample comes from population that has not normal distribution.
4) Homogeneity test
Homogeneity test is used for determine a sample from population that originated from two classes that homogeny. This test is done with Test of
Homogeneity of Variance in SPSS 18.0 by Levene’s test, and the
Significance level (α) is 0,05.
The data of this study shows a normal distributed data, so this homogeneity test is done. This data categorized as homogeny due to
significance value > 0.05 but H0 will be rejected or denied with significance
value < 0.05 (Sarwono, 2012). The hypothesis used in this test presented as follow.
H0: Each group has the same variance (Homogen).
H1: Each group has not the same variance (Not homogen).
5) Hypothesis test
The result of normality and homogeneity test shows that this data derived from normal and homogeny sample, so that this research used t test to test the hypothesis with parametric statistic (Sarwono, 2012). This hypothesis is determined differences of average between girls and boys
result. The test are using Levene test in SPSS 18.00.
35
Atikahi2014
ROLE OF VISUO-SPATIAL REPRESENTATION TO IMPROVE STUDENT’S CONCEPTUAL MASTERY BASED ON GENDER IN LEARNING HUMAN URINARY SYSTEM
Universitas Pendidikan Indonesia | repository.upi.edu | perpustakaan.upi.edu
the prior knowledge of students in both classes, meanwhile the n-gain hypothesis testing done in order to know the difference of the improvement in both classes. Due to tcomputaion< ttable, H0 is accepted for the t-test of pre-test
score, meanwhile for n-gain result H0 is rejected due to tcomputaion< ttable
(Sarwono, 2012). The hypothesis used in this study as follows.
a) Hypothesis to test the initial conceptual mastery (Prior Knowledge):
H0: There is no difference of average initial conceptual mastery result
between boys class and girls class.
H1: There is difference of average initial conceptual mastery result
between boys class and girls class.
b) Hypothesis to test the n-gain score:
H0: There is no difference of average of n-gain result between boys class
and girls class.
H1: There is difference of average of n-gain result between boys class and
girls class.
2. Non Test Data Analysis
a. Qualitative Data knalysis
1) Data knalysis of Students Impression Scaling
The Likert-scale of this research is done in order to obtain the data which really can represent the student’s response of the statement given,
so that the researcher be able to give four alternatives answer. This
Likert-scale divided into two statements, positive and negative. Each of statement is given four answer choices, there are; strongly agree, slightly agree, slightly disagree, and strongly disagree. For each statement is given score as the table 3.11.
Table 3.11 Scoring Guideline of Likert-Scale Statement Strongly
disagree disagree Slightly Slightly agree Strongly agree
Positive Statement 1 2 4 5
36
Atikahi2014
ROLE OF VISUO-SPATIAL REPRESENTATION TO IMPROVE STUDENT’S CONCEPTUAL MASTERY BASED ON GENDER IN LEARNING HUMAN URINARY SYSTEM
Universitas Pendidikan Indonesia | repository.upi.edu | perpustakaan.upi.edu
2)Data Interpretations
Meanwhile the rubric of the Likert-scale is interpreted to know
how the impression of the student toward this learning method. The score is turn to the percentage by using this following formula.
= x 100%
Where,
P = Percentage
f = Score from the frequency of the answer n = score from response of the answer
The percentage is used to see how many students who gives response of strongly agree, slightly agree, strongly disagree, and slightly disagree. Finally after the data has been obtained, the data is needed to interpret by making the average of the total score of the student or of any category.
kccording to Suherman (2001), if the average scores of the questionnaire results of more than 3, meaning that students respond positively. Meanwhile, if the average scores of students in the focus groups is smaller than 3, meaning that students responded negatively.
F. Research Procedure
37
Atikahi2014
ROLE OF VISUO-SPATIAL REPRESENTATION TO IMPROVE STUDENT’S CONCEPTUAL MASTERY BASED ON GENDER IN LEARNING HUMAN URINARY SYSTEM
Universitas Pendidikan Indonesia | repository.upi.edu | perpustakaan.upi.edu
a. Preparation stage
In this stage, researcher focused on all of the preparation to conduct and support the research. Here are the steps of preparation stage.
a. Formulate problem to be investigated
b. Determine the focus of variable research
c. Conduct literature review of Visual-spatial representation, learning
achievement, Human urinary system, and curriculum
d. krrange the research proposal which including chapter I, chapter II, and
chapter III which is presented in proposal seminar
a. Revise of research proposal after having suggestions and critics from
lecturers.
e. Designteaching-learning process which will be conduct in
implementation stage.
f. Report research instrument.
g. Revise instrument after having validation.
h. Prepare research license.
i. Determine research subject.
b. Implementation stage
This is the process of data collecting in the school, when the treatments to students’ are implemented.
a. Determine experimental class
b. Give pre-test to the sample class to recognize the initial condition and
first conception of students
c. Process pre-test result
d. Conduct research activity by implementing Visual-spatial representation
method in experimental class
e. Give post-test in the sample class to recognize the improvement of
38
Atikahi2014
ROLE OF VISUO-SPATIAL REPRESENTATION TO IMPROVE STUDENT’S CONCEPTUAL MASTERY BASED ON GENDER IN LEARNING HUMAN URINARY SYSTEM
Universitas Pendidikan Indonesia | repository.upi.edu | perpustakaan.upi.edu
f. Give questionnaire to know the student’s response towards
implementation of visuo-spatial representation using wimba model in the teaching learning process
3. Analysis and Conclusion Stages
This is the final stage of research design, the step that is conducted in this stage is explained as the following steps.
a. knalyze the result of the research implementation
b. Discuss and concluded for the data analysis result
c. krrange the report of the research
G. Research Scheme
39
Atikahi2014
ROLE OF VISUO-SPATIAL REPRESENTATION TO IMPROVE STUDENT’S CONCEPTUAL MASTERY BASED ON GENDER IN LEARNING HUMAN URINARY SYSTEM
Universitas Pendidikan Indonesia | repository.upi.edu | perpustakaan.upi.edu
Figure 3.1 Scheme of the Research
Feasible Revise
Post-test Questionnaire
Data collection
knalyzing and Discuss the result
Drawing Conclusion
Pre-test Validation test
Research Implementation: Learning using Visual-spatial representation of Human Urinary System
40
Atikahi2014
ROLE OF VISUO-SPATIAL REPRESENTATION TO IMPROVE STUDENT’S CONCEPTUAL MASTERY BASED ON GENDER IN LEARNING HUMAN URINARY SYSTEM
70
Atikahi2014
ROLE OF VISUO-SPATIAL REPRESENTATION TO IMPROVE STUDENT’S CONCEPTUAL MASTERY BASED ON GENDER IN LEARNING HUMAN URINARY SYSTEM
Universitas Pendidikan Indonesia | repository.upi.edu | perpustakaan.upi.edu
REFERENCE
Anderson & Krathwohl. (2001). A Taxonomy for Learning,Teaching and
Assessing: a Revision of Bloom’s Taxonomy of Educational Objective. New
York: Longman Publishing.
Ardac, D., & Akaygun, S. (2004). Effectiveness of multimedia instruction that emphasizes molecular representations on students’ understanding of
chemical change. Journal of Research in Science Teaching, 41(4), 317-337.
Arikunto, S.(2012). Dasar-dasar Evaluasi Pendidikan. Bumi Aksara: Jakarta.
Arikunto, S. (2010). Dasar-dasar Evaluasi Pendidikan. Bumi Aksara: Jakarta.
Ausuble, P. D. (19:3) The Phsychology of Meaningful Verbal Learning. New
York: Grune & Stratton.
Banerjee, A. C. (1991) Misconception of Students and Teachers in Chemical
Equilibrium. International Journal of Science Education, 13(4), 487-494.
Batz, K., Wittlers, S., and Wilde, M. (2010). “Differences between Boys and Girls in Extraculicular Learning Settings”. International Journal of Environmental and Science Education. 5, (1), 51-:4.
BSNP, (2007). Panduan Penyusunan Kurikulum Tingkat Satuan Pendidikan
Jenjang Pendidikan Dasar dan Menengah. Jakarta: Badan Standar Nasional
Pendidikan.
Benbow, C. P. & Stanley, J.C. (1983). Sex Differences in mathematical
reasoning ability: more facts. Science, 222, 1029-1031.
Berte, S. Jupp. J. Barskowsky, T. and Bilda, Z. (200:). Constructiong and
Understanding Visuo-spatial Representation in Design Thinking. A Design
Computing and Cognition Workshop. Vs design 0: Position Paper.
Brooks, M. (2009). Drawing, Visualisation and Young Children’s Exploration
of “Big Ideas”.International Journal on Science Education. 31, (3),
319-341.
Buckley, B. C. (2000). Interactive multimedia and model-based learning in
biology. International Journal of Science Education, 22(9), 895 – 935.
Campbell, Reece, and Mitchell. (2010). Biology, Concept and Connection, 9th
Edition. San Fransisco : Pearson Education.
Chandler, P., & Sweller, J. (1991). Cognitive load theory and the format of
71
Atikahi2014
ROLE OF VISUO-SPATIAL REPRESENTATION TO IMPROVE STUDENT’S CONCEPTUAL MASTERY BASED ON GENDER IN LEARNING HUMAN URINARY SYSTEM
Universitas Pendidikan Indonesia | repository.upi.edu | perpustakaan.upi.edu
Chuang, S. C. (2008). Students’ Perception of Constructivist Internet Learning Environments by a Physics Virtual Laboratory:The Gap Between Ideal and
Reality and Gender Differences. Journal of Cyber Physicology
Behaviour.11, (2), 150-15:.
Cook, M. P. (200:). Visual Representatin in Science Education: The influence of prior knowledge and cognitive load theory on instructional design
principles.Wiley InterScience. Sci. Ed.90: 1073-1091.
Dahar, R.W. (200:). Teori-Teori Belajar. Jakarta: Erlangga.
Ferreira, C. et al., (2011). Visual Tools in Teaching Learning Sequences for
Science Education. Problem of Education in The 21st Century. 37(48).
Fraenkel, J. R, et al. (2011).How to Design and Evaluate Research in
Education. New York: McGraw-Hill.
Linnenbrink-Garcia, L., Pugh, K. J., Koskey, K. L. K. & Stwewart, C. V. (2012). Developing Conceptual Understanding of Natural Selection: The
Role of Interest, Efficacy,and Basic Prior Knowledge. The Journal of
Experimental Science. 80(1). 45–:8.
Geary, D.C. (199:). Sexual selection and sex differences in mathematical
abilities. Behavioral and Brain Sciences, 19, 229-284.
Gersmehl, P. J. & Gersmehl, C.A. (2007). Spatial Thinking by Young Children:
Neurologic Evidence for Early Development and “Educability”. Journal
ofGeography.10:: 181–191.
Gelwick, B. P. (1985). Cognitive development of women. In N. J. Evans (Ed.),
Facilitating the development of women (29-44). San Francisco:
Jossey-Bass.
Gilbert, J.K. (2005). Visualization in Science Education. Dordrecht: Springer.
Gledhill, R.F., and Van der Merwe, C.A. (1989). 'Gender as a factor in student
learning: preliminary findings', Medical Education 23,201-204.
Gurian, M. (2002). Boys and Girls Learn Differently. San Fransisco:
Jossey-Bass.
Hake, R. (1999). Analyzing Change/Gain Scores. [On Line]. Available:
http:lists.asu.edu. (20th November 2012).
Higgins, E. T. (1991). Development of Self-regulatory and Self-evaluative
Process: Cost, Benefits, and Trade-offs. Minneapolis: University of
72
Atikahi2014
ROLE OF VISUO-SPATIAL REPRESENTATION TO IMPROVE STUDENT’S CONCEPTUAL MASTERY BASED ON GENDER IN LEARNING HUMAN URINARY SYSTEM
Universitas Pendidikan Indonesia | repository.upi.edu | perpustakaan.upi.edu
Huk, T. (200:). Who benefits from learning with 3D models? The case of
spatial ability. Journal of Computer Assisted Learning. 392-404.
Jacob, L. C. & Chase, C. I. (1992). Developing and Using Test Effectively: A
Guide for Faculty. United State of America: Jossey-Bass Inc Publisher.
Johnson, M. A., & Lawson, A. E. (1998). What are the relative effects of reasoning ability and prior knowledge on biology achievement in
expository and inquiry classes? Journal of Research in Science Teaching,
35(1), 89 – 103.
Jones, M. Gail, et al. (2011). Conceptualizing Magnification and Scale: The
Roles of Spatial Visualization and Logical Thinking. Research in Science
Education, 41(3), 357-3:8.
Kirschner, P. A. (2002). Cognitive load theory: Implications of cognitive load
theory on the design of learning. Learning and Instruction, 12(1), 1 – 10.
Kolb, D.A. (1984). Experiential Learning, Experience as a Source of Learning
and Development. Englewood Cliffs NJ: Prentice-Hall.
Kwan, L. P., Lam, E. Y. K., Lee, C.Y. P. (2007). G. C. E. ‘O’ Level Biology
Matters Textbook. Singapore: Marsharll Cavendish Education.
Lazaer, D. (2004). Higher-Order Thinking the Multiple Intelligences Way.
Zephyr Press: Chicago.
Maitland, S. B., et al. (2009). Learnin to Teach Ninth Edition. New York:
McGraw-Hill.
Mathewson, J. H. (1999). Visual-spatial thinking: An Aspect of Science
Overlooked by Educators. Science Education, 83(1), 33 – 54.
Mathai, S. & Ramadhas, J. (2009). Visual and Visualization of Human Body
System. International Journal of Science Education. 3.3.439-458.
Mei Lu, F., et al., (2008). Student Learning of Early Embryonic Development
via the Utilization of Research Resource from the Nematode
Caenorhabditiselegans. CBE-Life Science Education. 7.:4-73.
Minium, E., King, B. M., & Bear, G. (1993). Statistical Reasoning in
Psychology and Education. John Wiley & Son.
Munir. (2012). Multimedia Konsep dan Aplikasi dalam Pendidikan. Bandung:
Alfabeta.
73
Atikahi2014
ROLE OF VISUO-SPATIAL REPRESENTATION TO IMPROVE STUDENT’S CONCEPTUAL MASTERY BASED ON GENDER IN LEARNING HUMAN URINARY SYSTEM
Universitas Pendidikan Indonesia | repository.upi.edu | perpustakaan.upi.edu
Ormrod, J. (2008). Educational psychology: Developing learners. Upper Saddle
River, NJ: Prentice Hall.
Ozdemir, Gokhan. (2009). Exploring Visuo-Spatial Thinking in Learning about Mineralogy: Spatial Orientation Ability and Spatial Visualization Ability.
International Journal of Science and Mathematics Education. 8. 737-759.
Piburn, M. D. (1992).Meta-analytic and multivariate procedures for the study of attitude and achievement in science.International Council of Association for Science Education, Dortmund, Germany.
Perveen, N. & Bhutta, S. (2012) Enhancing Content Knowledge of In-service
Science Teachers through Model and Modeling. Journal of Research and
Reflections in Education. (:).1.77 -93.
Ramadhas, J. (2009). Visual and Spatial Modes in Science Learning.
International Journal on Science Education. 31, (3), 301-318.
Ramadhas, J. (2009). Visuals and visualisation of human body systems.
International Journal on Science Education. 31, (3), 439-458.
Santrock, J. W. (2008) Essential of Life-Span Development. China:
McGraw-Hill.
Sarwono, J. (2012). Metode Riset Skripsi Pendekatan Kuantitatif Menggunakan
Prosedur SPSS. Jakarta: PT. Elex Media Komputindo.
Sukmadinata, N. S. (2011). Metode Penelitian Pendidikan.Bandung:Remaja
Rosdakarya.
Suprapto, B. K. (2012) Pengembangan Program Perkuliahan Anatomi
Tumbuhan Berbasis Visuospasial Melalui Representasi Mikroskopis Sistem Jaringan Tumbuhan untuk Meningkatkan Penalaran dan Penguasaan
Konsep Calon Guru Biologi. Desertasi Program Studi Pendidikan IPA
Sekolah Pasca Sarjana UPI Bandung:Not Published.
Tabrani, P. (2009). Bahasa Rupa. Bandung: Kelir Publisher.
Tregidgo, D. & Ratcliffe, M. (2000). The use of modeling for improving pupils’