Refer to Important disclosures on the last of this report
Stock DataTarget price (Rp) Rp1,600
Prior TP (Rp) Rp1,600
Shareprice (Rp) Rp1,125
Upside/downside (%) +42.2
Sharesoutstanding (m) 3,561
Marketcap. (US$ m) 263
Government of Indonesia 51.0%
Public 49.0%
PT Indo Premier Sekuritas [email protected] +62 21 5793 1168
Strong 9M18 earnings, above expectation
Earnings grew by 64% in 9M18, above market expectation.
Record-high gross margin in 3Q18 of 16.9%.
New contract grew by 23% yoy in 9M18, but below expectation.
Maintain Buy with TP of Rp1,600.
Company’s strongest 9M achievement ever.
ADHI reported strong earnings of
Rp336bn in 9M18 (+64% yoy), which came above expectation forming 46%/42%
of our/consensus FY18F estimate, which was company’s strongest 9M
achievement ever (5-years average: 34%). Top line was growing by 8.2% yoy in
9M18, supported by robust growth in EPC and infrastructure segment of 110%
and 92% yoy, respectively. In quarterly basis, ADHI booked earnings of Rp123bn
in 3Q18 (+24% yoy, -12% qoq), forming 17% of consensus FY18 estimate.
Better profitability due to EPC and property segment.
Amid rising interest
expense to Rp344bn in 9M18 (17% yoy), there were margin expansions all across
the board supported by increase contribution from EPC and property segment to
7.5% and 6.2%, respectively (from: 3.9% and 5.0% in 9M17) which has better
margin. In 3Q18, ADHI booked record-high gross margin at 16.9% which mainly
supported by EPC and property segment which booked high margin at 17.2% and
19.5%, respectively. Going forward we believe ADHI to booked net margin of
4.3%/5.0% in FY18F/FY19F as ADHI take on more EPC and property projects.
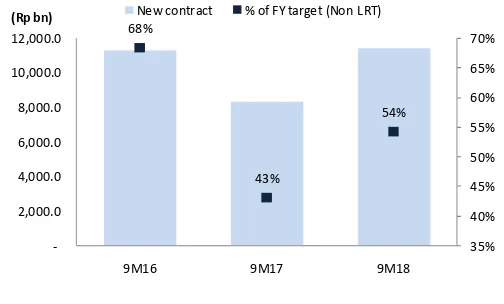
Low 9M18 new contract achievement.
Adhi Karya reported new contract of
Rp11.4tn in 9M18 (+37% yoy), forming 54%/50% of our/company’s FY18 target
of Rp23tn/Rp21tn. The new contracts are mainly contributed from building
projects by 65%, followed by Road and Bridge and Other Infrastructure with 20%
and 15%, respectively. Despite sluggish 9M18 contract achievement, we still
maintain our FY18F new contract target as we expect ADHI to book several major
projects in 4Q18 from Dam project (38%), Bridges (31%) and others (31%). As
of 9M18, ADHI has total orderbook of Rp26tn, which translate to
orderbook-to-revenue ratio of 1.7x providing modest profitability in FY19F.
Maintain Buy with unchanged TP of Rp1,600.
We increase our FY18/FY19F
forecast by 7%/9% as EPC segment started to book positive margin in 3Q18.
However our DCF based TP is unchanged at Rp1,600/share, as we implement
higher gearing of 1.3x for FY18F (1H18:1.1x). ADHI currently trades at single
FY18F P/E of 5.2x, which is the second cheapest among its SOE contractor peers
(only behind WSKT with 4.5x FY18F P/E). Key risk to our call might come from
lower than expected contract achievement and another delay in turnkey project
payment.
Source: ADHI, IndoPremier Share Price Closing as of : 29-October-2018
2
Refer to Important disclosures on the last of this report
Fig. 1: Revenue by segments Fig. 2: New contract trend
Source: Company, IndoPremier Source: Company, IndoPremier
Fig. 3: Increase contribution from EPC and Property segment Fig. 4: 9M18 Revenue segments
Source: Company, IndoPremier Source: Company, IndoPremier
Fig. 5: Expect better margin going forward Fig. 6: 9M new contract achievement
Source: Company, IndoPremier Source: Company, IndoPremier
-2014A 2015A 2016A 2017F 2018F 2019F
Investment in infrastructure Real estates EPC Construction
(Rp bn)
2014A 2015A 2016A 2017A 2018F 2019F 2020F
(Rp bn) New Contract LRT
78% 85% 83% 85% 83% 83% 83%
Construction EPC Property Investment in infrastructure
Construction
2014A 2015A 2016A 2017F 2018F 2019F 2020F
Gross margin Operating margin Net margin
3
Refer to Important disclosures on the last of this report
Fig. 7: 9M18 result
(Rp bn) 9M18 9M17 YoY 3Q18 2Q18 QoQ % to Ours % to Cons
Revenue 9,432 8,715 8.2% 3,349 2,941 13.9% 51% 50%
Gross profit 1,489 1,012 47.1% 565 492 15.0% 62% 56%
Operating profit 1,104 765 44.3% 431 363 18.6% 60% 58%
Net income 336 205 63.6% 123 139 -11.9% 46% 42%
Margins
Gross margin 15.8% 11.6% 16.9% 16.7%
Operating margin 11.7% 8.8% 12.9% 12.4%
Net margin 3.6% 2.4% 3.7% 4.7%
Source: Company, IndoPremier
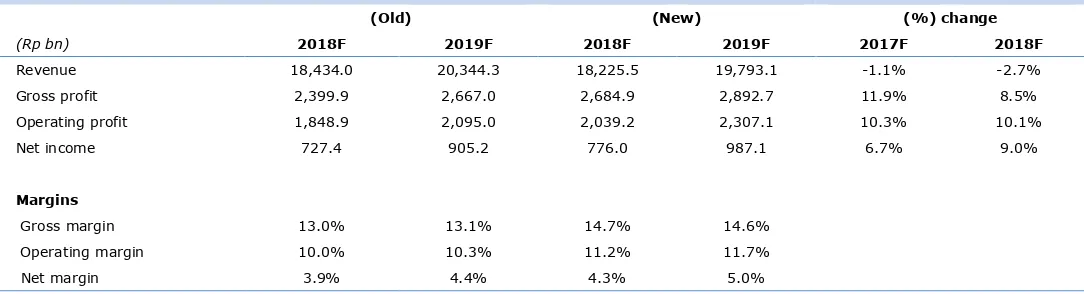
Fig. 8: Earnings change
(Old) (New) (%) change
(Rp bn) 2018F 2019F 2018F 2019F 2017F 2018F
Revenue 18,434.0 20,344.3 18,225.5 19,793.1 -1.1% -2.7%
Gross profit 2,399.9 2,667.0 2,684.9 2,892.7 11.9% 8.5%
Operating profit 1,848.9 2,095.0 2,039.2 2,307.1 10.3% 10.1%
Net income 727.4 905.2 776.0 987.1 6.7% 9.0%
Margins
Gross margin 13.0% 13.1% 14.7% 14.6%
Operating margin 10.0% 10.3% 11.2% 11.7%
Net margin 3.9% 4.4% 4.3% 5.0%
4
Refer to Important disclosures on the last of this report
Year To 31 Dec (RpBn) 2016A 2017A 2018F 2019F 2020F
Income Statement
Net Revenue 11,064 15,156 18,225 19,793 22,343
Cost of Sales (9,949) (13,098) (15,541) (16,900) (19,091)
Gross Profit 1,115 2,058 2,685 2,893 3,252
SG&A Expenses (456) (581) (792) (780) (894)
Operating Profit 659 1,477 1,893 2,112 2,358
Net Interest (95) (341) (449) (445) (480)
Forex Gain (Loss) 64 7 0 0 0
Others-Net (15) (185) (137) (101) (63)
Pre-Tax Income 613 957 1,307 1,567 1,815
Income Tax (298) (440) (529) (577) (647)
Minorities (2) (2) (2) (3) (3)
Net Income 313 515 776 987 1,165
Balance Sheet
Cash & Equivalent 3,365 4,131 4,650 4,140 4,155
Receivable 3,970 3,739 4,123 4,485 5,011
Inventory 131 3,683 3,562 3,712 3,979
Other Current Assets 9,368 13,264 14,918 16,620 18,487
Total Current Assets 16,835 24,818 27,252 28,957 31,632
Fixed Assets - Net 1,814 1,876 3,677 4,850 5,434
Goodwill 0 0 0 0 0
Non Current Assets 1,446 1,639 1,691 1,836 2,005
Total Assets 20,095 28,333 32,621 35,643 39,071
ST Loans 2,344 3,537 5,012 5,443 6,144
Payable 8,373 11,611 0 13,362 15,141
Other Payables 1,828 2,235 2,466 2,644 3,047
Current Portion of LT Loans 500 250 250 500 0
Total Current Liab. 13,044 17,633 19,302 21,950 24,332
Long Term Loans 1,428 4,665 6,612 6,208 6,364
Other LT Liab. 180 164 214 237 258
Total Liabilities 14,653 22,463 26,129 28,395 30,954
Equity 3,415 3,413 3,413 3,413 3,413
Retained Earnings 1,997 2,446 3,052 3,807 4,675
Minority Interest 10 11 12 13 14
Total SHE + Minority Int. 5,422 5,869 6,477 7,232 8,102
Total Liabilities & Equity 20,075 28,332 32,606 35,627 39,056
5
Refer to Important disclosures on the last of this report
Year to 31 Dec 2016A 2017A 2018F 2019F 2020F
Cash Flow
Net Income (Excl.Extraordinary&Min.Int) 315 517 778 990 1,168
Depr. & Amortization 66 131 208 332 421
Changes in Working Capital 2,074 191 (434) 1,268 1,057
Others (301) (3,124) (3,425) (804) (997)
Cash Flow From Operating 2,154 (2,285) (2,872) 1,786 1,649
Capital Expenditure (1,257) (386) (2,062) (1,649) (1,175)
Others 163 104 145 163 145
Cash Flow From Investing (1,094) (283) (1,917) (1,486) (1,030)
Loans 1,153 4,181 3,422 277 357
Equity 1 0 0 0 0
Dividends (94) (94) (155) (233) (296)
Others (195) (447) (560) (588) (613)
Cash Flow From Financing 866 3,640 2,707 (544) (552)
Changes in Cash 1,926 1,072 (2,083) (244) 67
Financial Ratios
Gross Margin (%) 10.1 13.6 14.7 14.6 14.6
Operating Margin (%) 6.0 9.7 10.4 10.7 10.6
Pre-Tax Margin (%) 5.5 6.3 7.2 7.9 8.1
Net Margin (%) 2.8 3.4 4.3 5.0 5.2
ROA (%) 1.7 2.1 2.5 2.9 3.1
ROE (%) 5.9 9.1 12.6 14.4 15.2
ROIC (%) 5.2 5.2 5.6 6.1 6.6
Acct. Receivables TO (days) 84.8 70.2 61.3 61.4 59.7
Acct. Receivables - Other TO (days) 35.4 22.6 17.5 18.0 17.9
Inventory TO (days) 67.8 6.9 4.3 4.6 5.0
Payable TO (days) 272.6 278.4 272.3 269.3 272.5
Acct. Payables - Other TO (days) 0.0 0.0 0.0 0.0 0.0
Debt to Equity (%) 78.8 144.0 183.3 168.0 154.4
Interest Coverage Ratio (x) 0.4 0.3 0.3 0.3 0.3
Net Gearing (%) 16.7 73.6 111.5 110.8 103.1
Head Office
PT INDO PREMIER SEKURITAS
Wisma GKBI 7/F Suite 718
Jl. Jend. Sudirman No.28
Jakarta 10210 - Indonesia
p +62.21.5793.1168
f +62.21.5793.1167
INVESTMENT RATINGS
BUY : Expected total return of 10% or more within a 12-month period HOLD : Expected total return between -10% and 10% within a 12-month period SELL : Expected total return of -10% or worse within a 12-month period
ANALYSTS CERTIFICATION.
The views expressed in this research report accurately reflect the analysts personal views about any and all of the subject securities or issuers; and no part of the research analyst's compensation was, is, or will be, directly or indirectly, related to the specific recommendations or views expressed in the report.
DISCLAIMERS