doi: 10.3389/fpls.2018.00813
Edited by: Omar Borsani, University of the Republic, Uruguay
Reviewed by: Petronia Carillo, Università degli Studi della Campania “Luigi Vanvitelli” Caserta, Italy Inés Ponce De León, Instituto de Investigaciones Biológicas Clemente Estable (IIBCE), Uruguay
*Correspondence: Yeon-Ju Kim [email protected] Deok C. Yang [email protected]
†These authors have contributed
equally to this work.
Specialty section: This article was submitted to Plant Abiotic Stress, a section of the journal Frontiers in Plant Science
Received:17 January 2018 Accepted:25 May 2018 Published:23 July 2018
Citation: Sukweenadhi J, Balusamy SR, Kim Y-J, Lee CH, Kim Y-J, Koh SC and Yang DC (2018) A Growth-Promoting Bacteria, Paenibacillus yonginensis DCY84T Enhanced Salt Stress Tolerance by Activating Defense-Related Systems in Panax ginseng. Front. Plant Sci. 9:813. doi: 10.3389/fpls.2018.00813
A Growth-Promoting Bacteria,
Paenibacillus yonginensis
DCY84
T
Enhanced Salt Stress Tolerance by
Activating Defense-Related Systems
in
Panax ginseng
Johan Sukweenadhi1,2†, Sri R. Balusamy3†, Yeon-Ju Kim4*, Choong H. Lee5, Yu-Jin Kim4,
Sung C. Koh6and Deok C. Yang1,4*
1Graduate School of Biotechnology, Kyung Hee University, Yongin, South Korea,2Faculty of Biotechnology, University of Surabaya, Surabaya, Indonesia,3Department of Food Science and Biotechnology, Sejong University, Seoul, South Korea, 4Department of Oriental Medicinal Biotechnology, College of Life Science, Kyung Hee University, Yongin, South Korea, 5Department of Bioscience and Biotechnology, Konkuk University, Seoul, South Korea,6Department of Environmental Engineering, Korea Maritime and Ocean University, Busan, South Korea
Panax ginseng(C.A. Mayer) is a well-known medicinal plant used in traditional medicine in Korea that experiences serious salinity stress related to weather changes or incorrect fertilizer application. In ginseng, the use ofPaenibacillus yonginensisDCY84Tto improve salt stress tolerance has not been thoroughly explored. Therefore, we studied the role ofP. yonginensisDCY84T under short-term and long-term salinity stress conditions in a controlled environment.In vitrotesting of DCY84Trevealed high indole acetic acid (IAA) production, siderophore formation, phosphate solubilization and anti-bacterial activity.
We determined that 10-min dip in 1010 CFU/ml DCY84T was sufficient to protect
ginseng against short-term salinity stress (osmotic stress) upon exposure to 300 mM NaCl treatment by enhancing nutrient availability, synthesizing hydrolyzing enzymes and inducing osmolyte production. Upon exposure to salinity stress (oxidative and ionic
stress), strain DCY84T-primed ginseng seedlings were protected by the induction of
defense-related systems such as ion transport, ROS scavenging enzymes, proline content, total sugars, and ABA biosynthetic genes, as well as genes involved in root
hair formation. Additionally, ginseng primed with DCY84Tand exposed to 300 mM NaCl
showed the same metabolite profile as control ginseng plants, suggesting that DCY84T
effectively reduced salt stress. These results indicated that DCY84T can be widely used
as a microbial inoculant to protect ginseng plants against salinity stress conditions.
INTRODUCTION
Salinity is a major threat to plant and environmental resources worldwide. Other factors that increase salinity include poor water management on cultivated lands, high evaporation with low precipitation, and poor cultural practices, such as improper fertilizer addition (Egamberdieva et al., 2007). Recent research in plant physiology has included omics-driven studies, bioinformatics, and new analytical techniques in fields such as metabolomics (Negrão et al., 2017). Generally, plants respond to salinity in two major phases: the shoot ion-dependent response that occurs between minutes to days after exposure; and the ion-dependent response that occurs over longer period (usually days to weeks), ultimately resulting in reduced yield and plant senescence. Plant growth and its productivity are impeded by salinity through interference with normal physiological and metabolic processes (Annunziata et al., 2017). Thus, further research is being conducted to understand plant responses to salinity and find new ways to improve salinity tolerance (Munns and Tester, 2008).
Plant species have individual sensitivity levels to salinity. Most plants (glycophytes) are very sensitive to soil salinity, but some plants (halophytes) are salt-tolerant. Halophytes have evolved many tolerance mechanisms to overcome adverse salinity conditions and to maintain their physiology and growth processes (Ahanger et al., 2014), including ion pumps
(Hu and Schmidhalter, 2005), abscisic acid (ABA) (Zhu,
2002), osmoprotectants (Chinnusamy et al., 2005), and ROS scavenging (Vinocur and Altman, 2005). Understanding plant defenses against salinity stress and developing salinity-tolerant plants are crucial to solving the ongoing problem of soil salinity.
Plant growth-promoting bacteria (PGPB) form symbiotic relationships with plants that can benefit the plant (Forchetti
et al., 2007; Diaz-Zorita and Fernandez-Canigia, 2009). PGPB
are soil bacteria that facilitate plant growth and often colonize the rhizosphere; they can indirectly activate various antioxidant enzymes such as superoxide dismutase (SOD), peroxidase and catalase, which scavenge excess ROS and safeguard plants from salt toxicity (Jha and Subramanian, 2014; Islam et al., 2015). There are various mechanisms for plant growth promotion by PGPR including acquisition of nutrients, phosphorus (P) solubilization, siderophore production, fixation of atmospheric nitrogen (N), phosphorus (P) solubilization, hydrocyanic (HCN) production, regulation of plant hormones and defensive action against biotic pathogens. N fixation, P availability and hormonal response are directly involved in plant growth promotion; other mechanisms contribute to plant growth indirectly (Gontia et al., 2011; Bhattacharyya and Jha, 2012; Glick, 2012; Estrada et al., 2013; Vacheron et al., 2013). Plants that are inoculated with PGPR modulate root architecture due to increased indole-3-acetic acid (IAA) level, which allows plants to uptake more nutrients under salinity stress conditions (Vacheron et al., 2013; Goswami et al., 2014). Another report demonstrated that rhizobacteria release volatile compounds that increase the life span of plants under severe drought stress (Timmusk et al., 2014). Recently,Rolli et al.
(2015)studied eight osmotolerant bacterial isolates that showed
plant growth-promoting properties and improved grapevine growth under drought stress. Moreover, PGPR can serve as a bio-fertilizer or phyto-stimulator to maintain soil fertility, therefore providing a promising alternative approach to chemical fertilizers and pesticides in agricultural practices (Majeed et al., 2015).
Panax ginsengMeyer is a well-recognized medicinal plant in east Asia, including Korea, China and Japan. Its long cultivation period, usually 4–6 years, makes this valuable medicinal plant vulnerable to various environmental conditions, one of which is salinity (Egamberdieva and Da Silva, 2015). Several methods such as traditional breeding and genetic engineering have been implemented to improve ginseng plant salinity tolerance; however, little improvement has been observed (Krishna et al., 2015). PGPR is a highly effective and eco-friendly approach to improving salinity stress. Moreover, several reports have also shown that PGPR could effectively improve plant growth and prevent plants from various forms of environmental stress
(Basillo et al., 2004; Mayak et al., 2004; Yuwono et al., 2005;
Islam et al., 2015; Majeed et al., 2015; Rolli et al., 2015; Timmusk
et al., 2015; Zahid et al., 2015). Our previous report suggested
that DCY84Tcould be a promising PGPB isolate for protection
of Arabidopsis against salt stress (Sukweenadhi et al., 2015). Therefore, we attempted to study the role of PGPR in controlling salinity stress in ginseng. Several bacteria were isolated from ginseng soil and tested for plant growth-promoting activity and among them we chose DCY84T Paenibacillus yonginensis
because its full genome sequence had been reported to have several plant growth-promoting genes. In the present study, we used strain DCY84T to increase salinity stress tolerance
in ginseng seedlings in a controlled environment. To the best of our knowledge, this is the first study to show that DCY84T can regulate salt tolerance defensive mechanisms in
plants.
MATERIALS AND METHODS
Plant Material and Culture Conditions
We obtained 2- and 4-year-oldP. ginsengroot seedlings from the Ginseng Resource Bank, Kyung Hee University. As the growth medium, we prepared artificial soil by mixing vermiculite, perlite, and peat moss at a 3:1:1 volume ratio. The mixed soil was autoclaved at 121◦C for 1 h and then air-dried. The sterilization
step was repeated twice on different days. Before culturing the roots, we added sterilized tap water to the mixed soil in a 25%
v/vratio. Later, we used the prepared soil to fill trays or pots for growing the ginseng. Each tray or pot was placed in an open cabinet with 60 ×100 cm dimension (0.6 m2) inside a closed
room. We adjusted the photoperiod to a 16:8-h light:dark cycle using lamps (Philips TLD-RS-FLR32SSEX-D 865K) equal to 9500 lux for each covered area. The temperature was controlled at 25±
2◦C, and the moisture level was maintained at 60±5%. Sterilized
In Vitro
Plant Growth Promotion Assay on
Bacteria
To assess IAA production, we used the method described by
Glickmann and Dessaux (1995), with some modifications forin
vitroIAA production: we used King B broth with and without additional L-tryptophan (3 g/l), as described by Shokr and
Emtiazi (2010). After 6 days of incubation of strain DCY84T,
IAA production was measured using the colorimetric method (Salkowski reagent). We also prepared several concentrations of IAA to establish the standard curve.
We used Pseudomonas Agar F medium (Glickmann and
Dessaux, 1995) supplemented with a chrome azurol S (CAS)
complex [CAS/iron(III)/hexadecyltrimethylammonium bromide (HDTMA)] to assess siderophore production capacity, as described previously (Schwyn and Neilands, 1987). These three ingredients were prepared separately: we dissolved 60.5 mg CAS in 50 ml distilled water (DW), 72.9 mg HDTMA in 40 ml DW, and 0.0027 g of FeCl3-6 H2O in 10 ml of 10 mM HCl. After
the medium was prepared (in 900 ml DW), we mixed all three ingredients to reach 1 L of volume. Siderophore production can be confirmed by the development of a yellowish to reddish halo zone around colonies in the blue-green medium.
Qualitative testing of the phosphate-solubilizing ability of isolated strains was checked by plate screening methods using the media formulated by (Pikovskaya, 1948). A clear halo region around colonies in the opaque Pikovskaya medium indicated positive results for phosphate solubilization.
Compatibility of Strain DCY84
TWith
P. ginseng
Meyer
Surface-disinfected 2-year-old ginseng roots were used for ginseng pot assay; the roots were dipped in DCY84T
suspensions of various ODs (indicating variation in CFUs/ml) for 10 min. Then they were cultivated in sterilized artificial soil (vermiculite:perlite:peat moss=3:1:1, with additional sterilized tap water [25% (v/v)] in pots (11 cm high and 11 cm diameter). We observed rot symptom was development 7 days after post-inoculation and recorded brown rot increased with inoculum population. Each pot contained 7 roots. Each treatment was replicated in three pots.
We performed ginseng disc assay following a protocol with some modifications. 4-year-old of P. ginseng roots were disinfected with 70% EtOH for 5 min, 2% NaOCl for 5 min, and then were rinsed twice with sterilized distilled water (SDW). The middle part of the roots was cut transversely to a thickness of 1 cm and a diameter of 2 cm. We cut the bottom and top parts of the roots longitudinally. DCY84Tsuspensions with several ODs were
prepared following the previously described protocol, and 20µL
was given to the cortex of the transverse root sections and the epidermis of the longitudinal root sections. Then we placed the root discs into Petri dishes with sufficient moisture supplied via soaked sterile filter paper and incubated them at 25◦C and 30◦C.
For comparison, we usedP. polymyxa10485Tas the inoculant
because it can cause root rot in ginseng (Kim, 2015). We observed symptom development daily for 7 days after inoculation and then
created a symptom severity scale. Each treatment was replicated three times.
In Vitro
Antifungal Test Against
Ilyonectria
robusta
All PGPB candidate strains were activated from stock culture vials on Trypticase soy agar (TSA) and incubated for 2 days at an optimum temperature (25◦C or 30◦C). All pathogenic
fungi were cultured on potato dextrose agar (PDA) medium and incubated at 25◦C for 5 days. The following PGPB
strains were used in this test: DCY84T, Chryseobacterium yeoncheonenseDCY67T,Epilithonimonas ginsengisoli DCY78T,
Burkholderia ginsengiterraeDCY85T,B. panaciterraeDCY85-1T,
Sphingomonas panaciterrae DCY91T, Chryseobacterium N-15
DCY98T, andS. panacisDCY99T. We also used the following
pathogenic fungi: Ilyonectria robustaS2-3 and I. robusta Hb2 (both isolated from root rot ofP. ginseng), andFusarium solani
KACC 44891T. First, all bacteria and fungi were tested for growth on dual media (Supplementary Table S3). The dual media candidates were Waksman agar (WA; peptone 5 g/l, glucose 10 g/l, beef extract 3 g/l, NaCl 5 g/l, agar 20 g/l, pH 6.8), yeast malt agar (peptone 7 g/l, yeast extract 3 g/l, malt extract 3 g/l, glucose 10 g/L, agar 18 g/l, pH 6.2) and tryptone yeast agar (tryptone 5 g/l, yeast extract 3 g/l, calcium chloride 0.66 g/l, agar 18 g/l, pH 7.0). We observed the growth of bacterial colonies and fungi mycelia for 3 and 10 days, respectively. The best medium for both bacteria and fungi was selected for the antifungal test. Fungi isolates were prepared 3 days earlier than bacteria isolates. Plates were divided into 4 parts horizontally using 3 lines, and we streaked bacteria isolates on one quarter line but not the other. After 24 h, a pathogenic fungi mycelia plug (I. robusta S2-3,I. robustaHb2,F. solaniKACC 44891T) was placed in the middle
line. We used a cork borer to obtain the fungi inoculant plug, which was taken from the edge of fungal colony. The control included only the fungi plug in the middle line without any bacteria streaking. We measured the suppression rate (SR) when the fungi mycelia reached the free-bacteria quarter lines on both the bacteria-streaked and control plates (Farh et al., 2015).
SR=[(A−B)/A]×100
where A indicates the radius of the fungal mycelia away from the bacterial streak (reaching the non-streaked line) and B indicates the radius of the fungal mycelia toward the bacterial streak (reaching the streaked line).
Optical Density and Colony Forming Unit
(CFU) Correlation of DCY84
TDCY84Twas grown in Trypticase soy broth at 30◦C overnight.
The cell culture was centrifuged at 3,000 g for 15 min, and the precipitated cells were dissolved in SDW to a certain OD value, as read by a spectrophotometer at a 600-nm wavelength. We counted CFUs of DCY84Tin triplicate via serial dilution of cell suspensions with different OD values. CFU/ml was determined from plate count results after 30◦C incubation for 2 days.
Design of a Specific Genetic Marker for
Strain DCY84
TrRNA was the target of selection when we designed a specific genetic marker for DCY84T. From ORFs found and annotated during full genome sequencing (Sukweenadhi et al., 2014), we extracted the 16S rRNA, 23S rRNA, 30S rRNA, and 50S rRNA sequences. For the first screening, we collected up to >500, 500, 400, 300, and 200 bp of nucleotides in front of each ORF sequence and tested their possibilities as promoters using the Promoter 2.0 prediction software (Rozen and Skaletsky, 2000). For each input sequence, we show the name and length first, followed by the Position Score Likelihood in table form, where “position” indicates position in the sequence, “score” indicates the prediction score that a transcription start site occurs within 100 bp upstream from that position, and “likelihood” indicates the descriptive label associated with that score. The score itself always takes the form of positive numbers as follows:
<0.5 means ignored; 0.5–0.8 means marginal prediction; 0.8– 1.0 means medium likely prediction, and >1.0 means highly likely prediction. We tested the best candidate promoter region from 16S rRNA, 23S rRNA, 30S rRNA, and 50S rRNA again up to >500 bp in front of each ORF sequence and recorded scores above 0.5 (Supplementary Table 7). Considering the size (<1,000 bp) and promoter prediction score, we selected two of the four promoter candidates and designed primers. After optimization of the annealing temperature range from 55◦C
to 66◦C, the best polymerase chain reaction (PCR) conditions
were as follows: initial denaturation at 95◦C for 2 min; 35 cycles
of 95◦C for 30 s, 64◦C for 50 s, and 72◦C for 1 min; then
final elongation at 72◦C for 5 min. We carried out PCR using
100 ng of DCY84T genomic DNA in a 15-µl total reaction
volume of GenotechR 2× Green PreMix (Genotech, Korea).
The PCR mix condition included 1 µl DNA template (100
ng/µl), 1 µl for each primer pair, 7.5 µl Green PreMix, and
4.5 µl of DW for a 15-µl total reaction mix. We verified the
species-specific primer for the strain DCY84 compared to other strains such as P. barengoltzii KACC 15270T, P. timonensis
KACC 11491T, P. phoenicisNBRC 106274T,S. asaccharolytica
NBRC 15499T, S. panaciterrae DCY91T, and B. ginsengiterrae
DCY85-1T. As a positive control, we also conductednifHgene
PCR.
Quantification of DCY84
TUsing the
Specific Genetic Marker
We used cell suspensions with different OD values as templates (1 µl) in a 15-µl total reaction volume of SYBRR Green
Sensimix Plus Master Mix (Watford, England) and performed quantitative real-time PCR (qRT-PCR). Amplification, detection, and data analysis were carried out with a CFX 96/Connect Real-Time PCR system (BIO-RAD, South Korea). We used the following thermal cycler conditions: 2 min at 95◦C followed
by 40 cycles of 95◦C for 30 s, 64◦C for 50 s, and 72◦C
for 1 min. The threshold cycle (Ct) was recorded, and the correlation of OD and Ct values is shown as an exponential regression.
Assessment of Salinity Tolerance in
P. ginseng
Different concentrations of NaCl were prepared, and soil bed was created using water containing NaCl. Plants were exposed to salinity stress in two different periods: at the start of ginseng root cultivation and after the ginseng roots had sprouted (5 days after cultivation, young seedling stage). The treatment was conducted for a short period (3 days) and a long period (12 days) after sprouting, and the roots were harvested for their morphological appearance. Furthermore, the soil was dried in a 50◦C oven for 5
days before soil element analysis. For soil element analysis, soil samples were air dried and passed through a 2-mm sieve. We analyzed the chemical properties of the samples according to the standard methods of the Rural Development Administration of Korea (Lee et al., 2016). Soil pH and electrical conductivity (EC) were measured using a soil-to-water ratio of 1:5 with a pH meter (Thermo, Orion 900A) and an Orion 162A conductivity meter, respectively. Soil organic matter content, phosphorus content, and levels of available cations (K+, Ca2+, Mg2+, and Na+) were
assessed using the Tyurin method, the Lancaster method, and the 1N-NH4OAc (pH 7.0) method, respectively.
RNA Extraction and qRT-PCR Analysis
The specific primers and annealing temperatures used in qRT-PCR are listed in Supplementary Table 1. At the last step of each cycle, we detected the fluorescent product. The number of cycles at which the fluorescence intensity was significantly higher than background fluorescence during the initial exponential phase of PCR amplification is designated as the Ct. We used the Ct value for the housekeeping gene to normalize the Ct value for the target gene using the formula 2−11Ct to determine the relative fold
differences in template abundance for each sample. The primer efficiencies were determined using the method of Livak and
Schmittgen, 2001to validate the11Ct method. The efficiencies
of the gene and the internal control (housekeeping gene) were equal when the observed slopes were near zero. We performed three independent experiments.
Gas Chromatography Time-of-Flight Mass
Spectrometry (GC-TOF-MS) Analysis
We attached an Agilent 7890 GC system (Agilent Technologies, Palo Alto, CA, USA) equipped with an Agilent 7693 auto-sampler to a TOF Pegasus III mass spectrometer (Leco, St. Joseph, MI, USA), which we operated in electron ionization mode (70 eV). The column was an Rtx-SMS column (30 m length×0.25 mm i.d.×0.25µm film thickness; Restek Corp., Bellefonte, PA, USA).
The selected carrier gas was helium, which we maintained at a constant flow of 1.5 mL/min. Then we injected 1µL of the
derivative sample in a split mode (10:1). The oven temperature was maintained at 75◦C for 2 min, increased to 300◦C at a rate
of 15◦C/min, and then held at 300◦C for 3 min. We set the
acquisition rate to 20 scans/s with a mass scan range of 45–1,000
m/z. The injector and ion source temperatures were set at 250◦C
and 230◦C, respectively (Lee et al., 2016).
the MS data were processed using Metalign software (Lommen, 2009), and the resulting data were exported to an Excel (Microsoft, Redmond, WA, USA) file. Multivariate statistical analyses were processed using SIMCA-P+ (version 12.0, Umetrics, Umea, Sweden). We performed principal component analysis (PCA) and partial least-square discriminant analysis (PLS-DA) to compare metabolite differences between samples. Orthogonal projection to latent structures-discriminant analysis was also performed to compare metabolite differences between the aerial part (circle, O) and the root (triangle,1). Significantly different metabolites between the two samples were selected using Variable Importance in Projection (VIP) values>0.7 and
p<0.05 as cutoffs.
Chlorophyll and Carotenoid Content in
Leaves
We determined chlorophyll and carotenoid content spectrophotometrically according to a previously described method (Lichtenthaler, 1987). First, 300 mg of leaves were ground into a powder with liquid nitrogen and then transferred to a 15-ml Falcon tube. We added 5 mL of 80% acetone to the tube, mixed thoroughly, and stood it in the dark overnight. Centrifugation was performed at 4◦C for 15 min (2,500
rpm). We transferred the supernatant to a new centrifuge tube and measured the absorbance of chlorophyll (hereafter termed A) using spectrophotometry. The chlorophyll and carotenoid concentrations were calculated as follows (using 80% acetone as a blank control): Chlorophyll a=12.72∗A
663
-2.59∗A
645; Chlorophyll b = 22.9∗A645-4.67∗A663; Total
chlorophyll = 20.31∗ A
645+8.05∗ A663; Carotenoid =A480 +
(0.114∗A
663-0.638∗A645).
Hydrogen Peroxide (H
2O
2) and Superoxide
(O
−2
) Visualization
We used 3,3′-diaminobenzidine (DAB) staining for in situ
detection of H2O2. The harvested leaf samples were placed in a
Petri dish. Three milliliters of DAB staining solution (50 mg DAB in 45 ml DW with the addition of 25µl of Tween 20 and 2.5 ml
of 0.2M Na2HPO4) was applied to the leaves until they were fully
immersed. As the control treatment, we applied 2 ml of 10 mM Na2HPO4to leaves. The Petri dishes were placed in a desiccator
and gently vacuumed for 5 min. Because DAB is light-sensitive, we covered the Petri dish with aluminum foil. The Petri dish was shaken on a standard laboratory shaker for 3 h at 100 rpm. We removed the foil after the incubation and used a bleaching solution (ethanol: glycerol: acetic acid = 3:1:1) to replace the DAB staining solution. After boiling for 15 min, we added fresh bleach solution to replace the used bleach solution. After an additional 30 min at room temperature, we took photographs under uniform lighting.
In situaccumulation of superoxide anions (O−
2) was examined
by histochemical staining with nitro blue tetrazolium (NBT). We placed the samples in the NBT solution (0.1 mM NBT, 25 mM HEPES pH 7.6) and subjected them to vacuum infiltration for 5 min. After incubation in the dark for 2 h, we treated the samples
with 80% ethanol and then took photographs under uniform lighting.
Soil Enzyme Activity Assay
We measured soil enzyme activity in fresh, moist soil. Dehydrogenase activity was measured followingPepper et al.
(1995) through the reduction of 2,3,3 triphenyltetrazolium
chloride and expressed asµg triphenylformazan/g soil. Alkaline
phosphatase activity was estimated using the method ofEivazi
and Tabatabai (1977), whereas amylase and invertase activity was
measured following the method developed byCole (1977).
Relative Water Content (RWC)
Measurement
We measured RWC on the day of sampling. We recorded the fresh weight (FW) of both shoots and roots using the following formula:
RWC = (fresh weight−dry weight)/(turgid weight
−dry weight)×100%
The turgid weight was determined by keeping the shoot and root in distilled water in darkness at 4◦C until they reached a constant
weight (overnight). Dry weight was obtained 72 h after keeping the turgid leaf in an oven at 70◦C.
Measurement of Proline Content
Proline was determined as previously described with slight modifications (Woodrow et al., 2017). Proline extraction was performed using 50x diluted fresh weight (w/v) in a mixture of 70:30 ethanol:water (v/v). Extracts were mixed with an equal volume of reaction mix (ninhydrin 1% (w/v) in ethanol:acetic acid:water = 20:60:20 (v/v)) under light-protected conditions. The reaction mixture was placed in a 95◦C water bath for 20 min.
After cooling to room temperature, it was spun down quickly for 1 min at 2,500 rpm. We then read the absorbance at 520 nm and calculated the amount of proline in the extracts as follows:
Proline(µg/mol/g FW) = (Absextract−blank)×Volextract_
Slope
× 1
VolaliquotFW
Absextract is the extract absorbance value; blank (expressed
as absorbance) and slope (expressed as absorbance/nmol) are specified through linear regression; Volextractis the extract total
volume; Volaliquot is the volume used in the assay; and FW
(expressed in mg) is the amount of plant material used in the extraction process. We presume that Absextractis within the linear
range. As standards, we prepared proline solutions ranging from 0.04 to 1 mM in the same medium used for the extraction.
Total Soluble Sugar Content Analysis
Quantitative MDA and H
2O
2Measurement
Lipid peroxidation (LPO) was measured using thiobarbituric acid (TBA) assay according to the method described by Buege and
Aust (1978). Lipid peroxides were extracted by grinding 500 mg
of leaves with an ice-cold mortar and 6 ml of 100 mM potassium phosphate buffer (pH 7). Homogenates were filtered through one Miracloth layer and centrifuged at 15,000 g for 20 min. Chromogen was formed by mixing 200µl of supernatant with
1 ml of a reaction mixture containing 15% (w/v) trichloroacetic acid (TCA), 0.375% (w/v) 2-thiobarbituric acid (TBA), 0.1% (w/v) butylhydroxytoluene, and 0.25 N HCl and incubating the mixture at 100◦C for 30 min. After cooling at room temperature,
tubes were centrifuged at 800 g for 5 min, and the supernatant was used for spectrophotometric readings at 532 nm. We estimated lipid peroxidation as the content of 2-thiobarbituric acid-reactive substances (TBARS) and expressed it in equivalents of malondialdehyde (MDA). The calibration curve was made using MDA in the range of 0.1–10 nmol. A blank for all samples was prepared by replacing the sample with extraction medium, and controls for each sample were prepared by replacing TBA with 0.25 N HCl. In all cases, 0.1% (w/v) butylhydroxytoluene was included in the reaction mixtures to prevent artifactual formation of TBARS during the acid-heating step of the assay (Rael et al., 2004).
Fresh leaf tissues (100 mg) were homogenized with 1 ml 0.1% (w/v) TCA and then centrifuged at 12,000 g for 15 min. An aliquot of the supernatant (250µl) was added to 250µl of 10 mM
phosphate buffer (pH 7.0) and 500µl of 1 M potassium iodide
(KI) to make 1 ml total volume. The absorbance of this mixture at 390 nm and calculated the H2O2content using a standard curve
with concentrations ranging from 0.05 to 0.1 mM (Junglee et al., 2014).
Crude Protein Extraction and ROS
Scavenging Enzyme Activity Assay
Fresh leaf tissue (0.2 g) was homogenized with 2 ml of 50 mM cold phosphate buffer (pH 7.8) and centrifuged at 12,000
× g for 20 min at 4◦C. We collected the supernatant for
further determination of the activities of ROS scavenging enzymes. The peroxidase activity was measured by an oxidation reaction between H2O2 and guaiacol; catalase (CAT) activity
was measured based on the d409-421)ecomposition of the H2O2 content, and ascorbate peroxidase (APX) activity was
measured based on the reduction of ascorbate. We used an ELISA reader (Synergy-2, Bio-Tek Instruments, Inc., Winooski, VT, USA) to read the absorbance at specific wavelengths and a Coomassie (Bradford) protein assay kit to determine the protein concentrations in the samples. One unit of enzyme activity was defined as the amount of enzyme that oxidized 1µM of substrate
per min at 25◦C (µl/mg protein/min). We determined enzyme
activity by measuring the change in absorbance per minute, divided by the amount of protein (mg) as follows:
Enzyme activity=(A2−A1)
(T2−T1)× 1
mgprotein (1)
Statistical Analysis
All experiments were performed using three biological triplicates. Statistical analyses were carried out using GraphPad Prism 5 software program (GraphPad Software, La Jolla, CA). The data from three biological groups were represented as mean±SE and analyzed using Studentt-test. All significant values are presented as∗p<0.05,∗∗p<0.01, and∗∗∗p<0.001 respectively.
RESULTS
Screening and Properties of Plant
Growth-Promoting Traits Isolated From
Ginseng Soil
We checked the in vitro plant growth-promoting properties of selected strain candidates and their closest reference strains and summarized them in Supplementary Table 2. The newly re-classified genus Paenibacillus was rarely studied for plant growth-promoting activity, except for P. polymyxa, which has been commercialized. DCY84T was found to produce 52.9 ±
1.85 IAA (without L-tryptophan) and 72.83±2.86µg/ml IAA
(with L-tryptophan). Apart from this, DCY84T also produced siderophore and was positive on the phosphate solubilization test. The other tested strains were not as effective as DCY84T
(Supplementary Table 2). Our results suggest that DCY84Thas no
antifungal activity (negative SR) against our selected pathogenic fungi (Supplementary Figure 1). In our preliminary check, all strains of bacteria and fungi were tested on different media. The best medium for supporting the growth of bacteria and fungi was the WA medium, as summarized in Supplementary Table 4. We selectedP. yonginensisDCY84Tfor further study because of its
strongin vitroplant growth-promoting activity.
Quantification of Strain DCY84
TTo prepare the bacterial inoculant, we made some needed adjustments to simplify the process. By finding correlations between OD (read at a 600-nm wavelength) and CFUs/ml, we were able to prepare the desired amount of bacterial inoculant without waiting to count colonies after plate streaking. The equation for DCY84Tis y=4.6396x+2.0996, withR2=0.9926,
and the equation for KACC 10485Tis y=8.7844x+0.8931, with R2 =0.9944, where x indicates the OD value at 600 nm, and y indicates the log (CFU/ml). The relationship between OD and CFU is shown in Supplementary Table 4.
Furthermore, to estimate bacterial distribution after DNA sampling from either bulk soil or rhizospheric soil, we developed a specific marker using the DCY84T genome. Thus, we could quantify the number of bacteria from the Ct value on real-time PCR. From the full DCY84T genome (Kim et al., 2017), we
annotated 8 sequences of 16S rRNA, 3 sequences of 23S rRNA, 22 sequences of 30S rRNA, and 34 sequences of 50S rRNA. After screening each of the promoter regions, we selected the highest promoter prediction value for each rRNA for further analysis. In the end, we selected the two best promoter candidates based on their prediction values and allowable size: p16S rRNA-5′(TTC
CGA AGG ATA TAT CGG) and p16S rRNA-3′(CGG CAC TTA
and annotated as 16S rRNA methyltransferase and p30S rRNA-5′ (TCT TTG CAG CAG CCC CTC TAT) and p30S rRNA-3′
(ACC GTA GTT GCT GAT C) derived from the 735-bp promoter region of orf03322 and annotated as 30S ribosomal protein s4. After annealing optimization, we tested the respective primers, and the results are shown in Supplementary Figure 2A. The 16S rRNA DCY84T promoter primers were highly specific to
DCY84T. On the other hand, the 30S rRNA DCY84Tpromoter
primers can produce the right amplicon from the DCY84T
sample, but they are not specific; many amplicons were generated from other bacterial DNA samples. The full genome sequences of strain DCY84Twas deposited in NCBI (PRJNA306396).
We used qRT-PCR with the selected 16S rRNA DCY84T
promoter primers for further specificity checking by looking at its
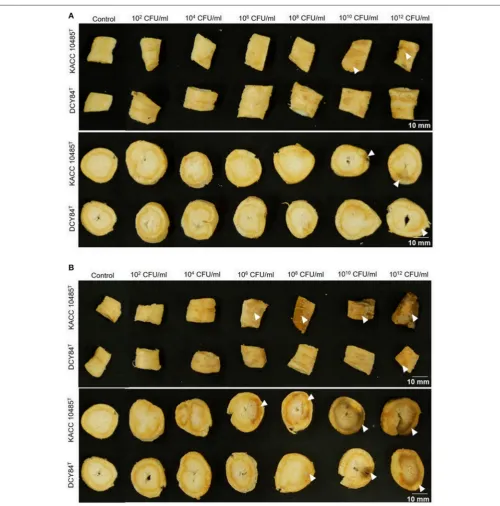
FIGURE 1 |Ginseng disc assay forin vitrocompatibility testing of strain DCY84TonP. ginseng.(A,B)Symptoms in both the cortex and epidermis were observed 7
days after bacterial treatment using various CFU/mL inoculants and incubated at 15◦C(A)and 30◦C(B).P. polymyxaKACC 10485TandP. yonginensisDCY84T
melt curve and melt peak, as visualized in Supplementary Figure 2B. Neither the curve nor the peak was detected in other bacterial samples or the water used as the template. Using these primers, we made a standard curve from the qRT-PCR results by using various DCY84Tsuspensions (different OD values). Thus, in the end, we were able to correlate the Ct value with the CFU/mL of DCY84T. We generated an equation for DCY84TOD values
(x) and Ct values (y): y= −0.7068x+23.581,R2 =0.993. The conversion of OD values into Ct values and predicted CFUs/mL are shown in Supplementary Table 5.
Compatibility of Strain DCY84
TWith
P. ginseng
Meyer
We measured the in vitro compatibility of DCY84T and
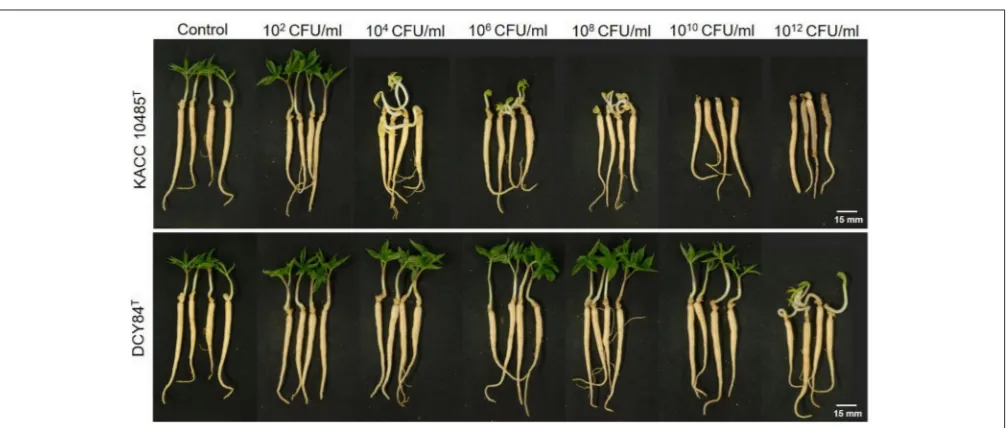
P. ginseng using the disc test (Figure 1) and the severity scale (Supplementary Figure S3). After 7 days of bacterial treatment, changes in symptoms were observed and compared with those from P. polymyxa KACC 10485T in vitro (Figure 2) and in planta (Figure 3). The pot assay (in planta) yielded distinctly different results fromin vitrotest (the root disc), depicting that the strain DCY84 might interact with more biocompatibility in a real ecosystem. Root rot symptoms did not appear in the pot assay (except for the 1012 CFU/mL P. polymyxa treatment) as
clearly as they did on thein vitrotest. However, the roots showed some stress symptoms in the sprouting stage.
Although the results were different, they had a similar pattern: the roots showed either rot or stress symptoms when the amount of bacterial inoculant was high. The in vitro assay indicated that 108 CFU/mL was the safest DCY84T dosage for ginseng
treatment (P. polymyxa at 106 CFU/mL). Meanwhile, the in-planta assay indicated that DCY84T can be given to ginseng seedlings up to 1012 CFU/mL for 10 min (P. polymyxaat 1010
CFU/mL). Summaries of both tests are shown inTable 1.
Assessment of Salinity Tolerance in
P. ginseng
The growth of 2-year-old ginseng seedlings was arrested when NaCl solution was given before the seedlings sprouted. Also, 300–450 mM NaCl solutions affected ginseng seedlings after they sprouted (see Supplementary Figure 4). Further soil element
FIGURE 3 |Monitoring of strain DCY84Tin theP. ginsengrhizosphere.(A)
Based on specific markers, DCY84Tcan be detected in a soil DNA sample. Although DCY84Twas abundant, some bacterial contaminants were also present, as revealed by(B)plate streaking. The small colony with a white yellowish color is strain DCY84T(white arrow). The large colony with a
yellow/white color is a bacterial contaminant.
FIGURE 2 |Ginseng pot assay forin plantacompatibility testing of strain DCY84TonP. ginseng.Symptoms in ginseng seedlings were measured 7 days after bacterial treatment using various CFU/mL inoculants in a soil system.P. polymyxaKACC 10485TandP. yonginensisDCY84Twere used in this test. Root rot
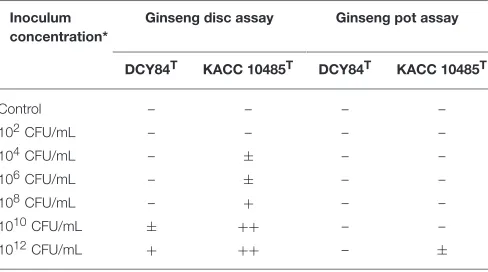
TABLE 1 |Summary of ginseng compatibility results.
Inoculum concentration*
Ginseng disc assay Ginseng pot assay
DCY84T KACC 10485T DCY84T KACC 10485T
Control – – – –
*Inoculum number calculated using the chart in Supplementary Table 5.
4-level severity scale: –, no symptoms;±, yellowish discoloration or small lesion formation; +, mild brown rot, root tissue starting to become soft; and++, severe brown rot, root tissue soft.
analysis (see Supplementary Table 6) showed that adding 300 mM NaCl in water to the soil system was enough to yield>1.5 dS/M of salinity, which is the point at which salinity stress started to occur in the ginseng seedlings.
Viability of Strain DCY84
Tin the
P. ginseng
Rhizosphere After Inoculation
First, we assessed DCY84T abundance in the ginseng root
rhizosphere using specific PCR markers. DCY84T was quite abundant compared with the starting amount (log CFU/mL
= 10, CFU/mL = 1010). Despite salinity stress, the number
of DCY84T was not significantly reduced. Because no surface
sterilization was done before culturing the ginseng seedlings, other bacterial contaminants were found in the PCR product formed by the fimH universal primers. The presence of microbial contaminants was also visualized using streaking serial dilution of the same rhizosphere soil sample. The morphological differences in the contaminants made them easy to distinguish from the DCY84T colonies. The contaminants
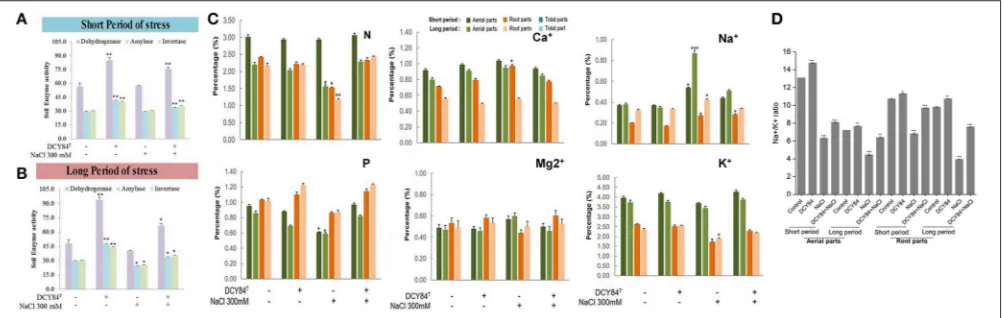
were not abundant (minority), and they decreased following salinity stress (Figure 3). Dehydrogenase, amylase, and invertase activity were higher with DCY84Ttreatment regardless of salinity
stress progression. Moreover, those activities corresponded with DCY84T abundance, indicating that DCY84T enriched soil
system nutrients (Figures 4A,B). During short-term of salinity stress, we found a higher content of N and P in both the aerial and root parts of DCY84T-treated ginseng after salinity
stress treatment than in non-treated stressed ginseng. Under long-term stress conditions, lower N and P content was observed in both the aerial and root parts; when the stressed seedlings were primed with DCY84T treatment, a gradual increase in accumulation of N and P content could be seen (Figure 4C).
Osmolyte Production as Defense
Mechanism Against Osmotic Stress
During the short period of salinity stress and without DCY84T
inoculation, the aerial part of the stressed ginseng seedlings
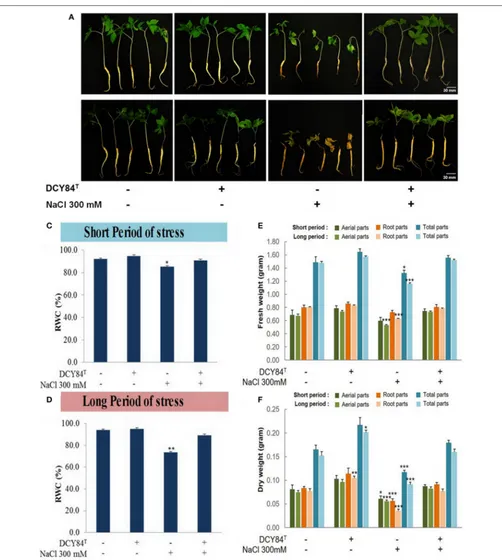
withered, indicating turgidity loss that caused water/osmotic stress. Meanwhile, some discoloration started happening in the roots (Figures 5A,B). A decrease in the relative water content (%RWC) in the aerial part denotes that significant water loss occurred (Figures 5C,D). However, inoculation of the stressed plants with strain DCY84T resulted in maintenance of the
moisture content in the plant tissue, thereby showing enhanced salt tolerance by maintaining RWC to control levels even under stress conditions (Figures 5E,F).
The ginseng therefore probably increased osmolyte production such as simple sugars, proline, and polyamine. One defense mechanism against osmotic stress in the DCY84T
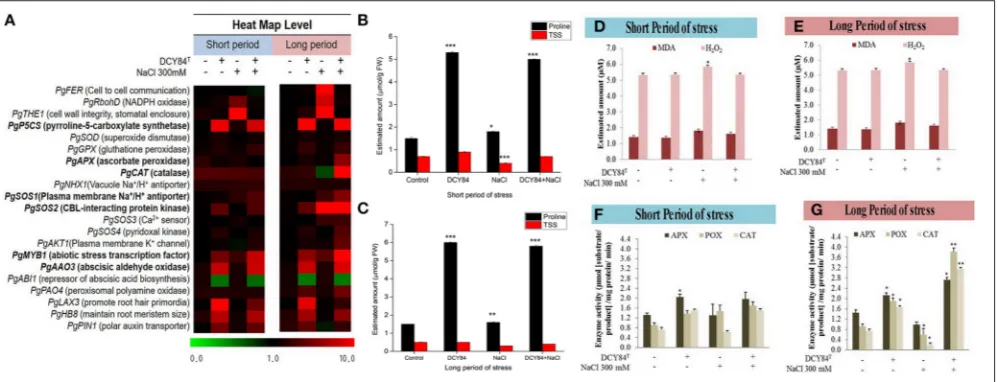
-treated seedlings was proline production (Figures 6B,C). We observed the increase in transcription level of PgP5CS
(Figure 6A), which was consistent with an accumulation of proline (Figures 6B,C) in DCY84T-treated seedlings. Total soluble sugar content (TSS) increased significantly in the stressed ginseng, indicating the plants efforts to maintain homeostasis. However, the level of TSS in the DCY84T-primed seedlings did
not alter significantly when the plants were stressed.
Ion Pump Activation on Ionic Stress
As salinity stress progresses, ionic stress can occur through Na+
toxicity. We found that several ion pump genes were highly expressed, including PgSOS1, PgSOS2, PgSOS3, PgSOS4, and
PgAKT1but not PgNHX1 (Figure 6A). Among them, PgSOS2
was found to be the most expressed transcript in DCY84T-treated
seedlings with or without exposure to salinity stress. The ion profile showed a similar pattern of results: the primed ginseng had more K+ and less Na+than the stressed plants. We found
more Ca2+ in the stressed ginseng roots, but no significant
change in Mg2+. Ca2+ presence might directly influence and
regulate the osmotolerance of cell membranes under salinity stress. Overall, we found higher ion content in the aerial parts than in the roots (Figure 4C).
ROS Scavenging Activity as a Defense
Mechanism Against Oxidative Stress
The increase in thePgRboHDtranscript might have resulted from oxidase-dependent ROS accumulation (Figure 6A) (Morales
et al., 2016). Excessive ROS might have activated
cell-to-cell signaling as a warning message to other cell-to-cells, resulting in the accumulation of the PgFE transcript (cell-to-cell communication) (Figure 6A). Furthermore, high H2O2 (ROS)
was found in stressed plants, along with MDA, a lipid oxidation product (LOP) marker (Figures 6D–F). ROS accumulation might have increased the transcription of several antioxidant genes significantly, includingPgAPXandPgCAT, but notPgSOD
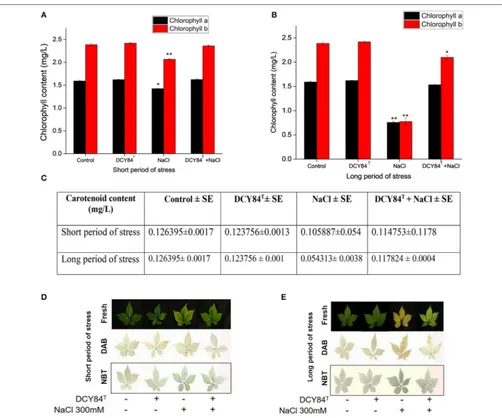
and PgGPX (Figure 6A). The transcription level correlated with the activities of antioxidant enzymes in the ginseng seedlings (Figures 6F,G). During short-term salinity stress, the aerial parts of ginseng seedlings exhibited decreased chlorophyll, carotenoids and accumulated ROS in leaves. However, DCY84T-primed seedlings were able to recover from
FIGURE 4 |Enzymes, ion and mineral content after short- and long-term salinity stress. Ion, mineral and enzymes content was measured after sample collection. (1) Control; (2) DCY84Ttreatment; (3) NaCl 300 mM treatment; (4) DCY84T+NaCl 300 mM treatment.(A,B)Dehydrogenase activity: Formation of triphenylformazan (g) from TTC/g soil for 24 h. Amylase activity: Glucose (g) liberated from starch/g soil for 48 h. Invertase activity: Glucose (g) liberated from sucrose/g soil for 6 h. Enzymes analysis was conducted using root tissue samples.(C)For ion profiles, we used 20 seedlings from each treatment per replication.(D)Na+/K+ratio was measured in aerial and root parts after treatments. Statistical significance was assigned using the studentt-test (*P<0.05, **P<0.01, and ***P<0.001) from the mean of three biological replicates.
part of the stressed ginseng dried and withered. However, the primed seedlings showed only pale green leaves, as seen in Figure 7E. This phenomenon was due to either oxidative or ionic stress, which occurs during long-term salinity stress. Therefore, we found a significant decrease in chlorophyll and carotenoid levels in stressed ginseng during the long period of salinity stress (Figure 7B). Meanwhile, in the primed seedlings, the leaves started to become a pale green color (Figure 7E). This symptom corresponded with a slight decrease in chlorophyll during long-term salinity stress (Figure 7B). The reduction in chlorophyll and ROS accumulation in leaves were observed on DAB and NBT staining of ginseng leaves (Figure 7E). The symptoms became more severe as salinity stress progressed. On the other hand, ginseng seedlings primed with DCY84T showed only a slight decrease in chlorophyll
content and ROS accumulation compared to stressed plants (Figures 7A–E).
Metabolite Profile of
P. ginseng
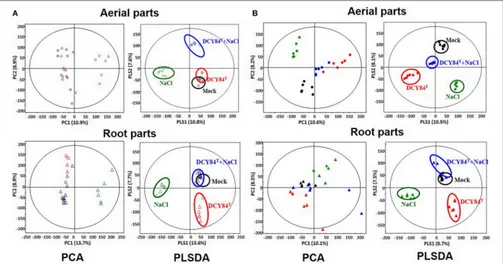
The results of our GC analysis showed differences in the aerial parts of ginseng plants over time. Based on PCA and PLS-DA analyses, the metabolites produced in the Mock and DCY84T
treatments were similar during short-term stress and unlike those from the other treatment conditions (Figure 8A). Furthermore, all metabolites differed from one another as salinity stress progressed (Figure 8B). On GC-TOF-MS analysis, PC1 showed distinct differences between shoots and roots. PC2 could be used to differentiate short-term (3 days) and long-term (12 days) salinity stress treatment. Short-term term roots/long-term roots/long-roots/long-term buds could be identified on PLSDA. PLSDA presented the metabolites showing significant differences in VIP
>0.7 andp-values>0.05 for each group. Primed ginseng roots under salinity stress produced metabolites closer to those under mock treatment than to those from the stressed group.
DISCUSSION
Salinity is the most severe environmental cause of abiotic stress and disrupts crop production in all cultivated lands. Panax ginseng is a medicinal plant requiring long-term cultivation that is prone to various environmental factors including salinity stress. Salt stress can affect ginseng growth and increase stress accumulation (Peng et al., 2007). Being that ginseng is a medicinal plant, decreases in growth rate can affect the nutritive value of the root and result in poor market value. The use of rhizobacteria has been well documented to promote plant growth as well as to alleviate various forms of abiotic stress including salinity. Application of PGPB for agricultural benefits has increased worldwide (Sukweenadhi et al., 2015). Microbial inoculants have considerable potential for use in agricultural biotechnology, based on these beneficial plant-microbe interactions. Salt stress in plants is a cumulative effect of osmotic and ionic stress that has a negative impact on plant growth and production. Depending on the plant species and soil environment, plant salt stress varies. In ginseng, we first analyzed the dose-dependent effect of salinity and found that 300 mM NaCl is the optimum level to induce salinity
(Sukweenadhi et al., 2015). We also performedin vitroscreening
of several rhizobacteria isolated from ginseng soil and found that Paenibacillus yonginensis DCY84T possessed the highest
plant growth-promoting properties. Our previous findings also suggested thatP. yonginensisDCY84Tinoculated inArabidopsis
under salt, drought and aluminum treatment led the highest resistance by activating several stress response genes. Based on the previous study,P. yonginensis DCY84T is a promising
candidate for application in crop cultivation. Therefore, in our present study we studied DCY84T’s role in ginseng growth by
FIGURE 5 |Morphological appearance and biomass profiles ofP. ginsengafter short and long periods of salinity stress.(A)After short-term (3 days) salinity stress, the stressed plant started showing root color changes and shrinkage, followed by turgidity loss in the aerial parts. The primed seedlings showed no visible stress symptoms.(B)After long-term (12 days) salinity stress, the stressed plants withered almost completely, with dried aerial parts and dead roots. The ginseng seedlings primed with DCY84Tgrew redundantly with pale green leaves.(C,D)Relative water content (RWC) ofP. ginsengseedlings under short and long-term salinity stress.
FIGURE 6 |Priming of DCY84Talleviates various biochemical changes caused by short- and long-term salinity stress.(A)Heat map of qRT-PCR results for salinity-responsive genes. The relative expression of ginseng genes was normalized usingPgCYPas the housekeeping gene. Bold letters indicate significant fold change in relative expression from at least one kind of treatment.(B,C)Proline and total soluble sugar (TSS) levels ofP. ginsengseedlings.(D,E)MDA and H2O2 levels ofP. ginsengseedlings. Both assays were conducted using root tissue samples.(F,G)Antioxidant enzyme activity ofP. ginsengseedlings. Data represent the mean of three biological replicates and were analyzed using the studentt-test (*P<0.05, **P<0.01, and ***P<0.001). Short period, 3 days of salinity stress; long period, 12 days of salinity stress.
H2O2, chlorophyll, carotenoid content, sugars, antioxidant
enzymes, proline, TSS and ion accumulation with or without salt exposure. We also identified changes in the expression of several genes involved in the salt stress tolerance mechanism.
The inoculation of bacteria on crop fields can be beneficial or harmful. We hence optimized the use of DCY84Trhizobacteria as a microbial inoculant. The in vitro and in vivo assays indicated that 10 min dipping in DCY84Tat 108–1010 CFU/ml
is sufficient to alleviate salinity stress in ginseng. When salinity levels increase, water absorption is greatly reduced, aggravating water stress conditions (osmotic stress) in plants. Increasing the respiration rate is necessary for photosynthesis recovery during periods of water stress (Kirschbaum, 1988). From the total amount of carbon assimilated by photosynthesis, more than half is lost through the respiratory process needed for maintenance and plant growth, but this balance might change during water stress. The RbohD gene is involved in rapid long-distance signaling, which plays a role in cell-to-cell communication during plant response to pests, wounding, or extreme environmental conditions. Its signal propagation was induced by ROS accumulation (Møller, 2001). Similar toRbohD, FERalso plays a role in cell-to-cell communication, as reported by Cheung and Wu. We found that stressed ginseng had a high oxidative respiration rate, as shown by high transcription levels of PgRbohD and PgFER. However, PgFERsignaling was not as rapid as PgRbohD, as shown by the late upregulation of its transcription level. We found that ginseng under salt stress exhibited increased ROS accumulation by upregulating
PgRhoD and PgFER expression. Any later effect of ROS can trigger accumulation of MDA and H2O2. In some C3 plants,
limited CO2 fixation due to environmental stress can activate
the photorespiratory pathway, generating H2O2in peroxisomes
through the enzymatic activity of glycolate oxidase (Davey et al., 2005). A recent report suggested that the salt-induced burst in ABA biosynthesis is correlated with carotenoid biosynthesis
(Ruiz-Sola et al., 2014). The plants inoculated with DCY84T
exhibited high proline and decreased malondialdehyde and H2O2
levels under salt stress conditions when compared with un-inoculated salt stressed plants. Plants treated with strain DCY84 may be less sensitive to proline-mediated feedback inhibition via crosstalk with proline biosynthesis. In a previous report, H2O2produced by NADPH oxidase was able to induce proline
accumulation during salt stress inA. thaliana(Rejeb et al., 2015). The increase of MDA content under salt stress is the result of membrane damage due to oxidative stress. The reduced MDA content during salt stress in DCY84T-inoculated plants was
consistent with earlier findings (Bharti et al., 2014). Excessive accumulation of ROS can be harmful for plants in many ways, including degradation of chlorophyll, carotenoids and enzymes. Long-term salinity stress produced severe symptoms in the ginseng seedlings: withered, dried leaves as well as yellowing, shrunken roots. The morphological changes in the leaves were correlated with decreased chlorophyll and carotenoid content, while DAB and NBT staining indicated that ROS production and generated ROS might be responsible for various biochemical changes. When salt-stressed seedlings were inoculated with DCY84T, activation ofPgAAO3occurred, which could result in
FIGURE 7 |Chlorophyll content, DAB and NBT staining ofP. ginsengleaves. All assays used fresh samples of ginseng leaves after(A)chlorophyll content during short period and(B)long period of salinity stress;(C)carotenoid content during short and long period of stress;(D,E)H2O2accumulation showed dark brown color on DAB staining, and superoxide accumulation showed a dark blue color on NBT staining. The statistical significance of three biological replicates was determined using the studentt-test (*P<0.05 and **P<0.01).
through the cleavage of a carotenoid precursor named xanthoxin
(Burden and Taylor, 1976). It has also been proposed that ABA
and xanthoxin arise from the breakdown of carotenoids in plant leaves (Volkov, 2015). High transcription levels of ABA-synthesis-related genes and antioxidant defense genes matched with high antioxidant enzyme activity explains how the primed ginseng seedlings can bear a long period of salinity stress. High levels of ABA induce antioxidant defense genes, such asSOD,
GPX,APX, andCAT,that can scavenge ROS during later salinity-related damage from osmotic or ionic stress (Bharti et al., 2016). Chlorophyll and carotenoid breakdown often occurred in the stressed ginseng seedlings, which might have triggered ABA production and the antioxidant defense system (only APX and CAT). However, the amount of antioxidant enzymes was very
low compared to that in the primed ginseng seedlings, which explains the tolerance of the primed seedlings (but not the stressed seedlings) during long-term salinity stress.
FIGURE 8 |PCA and PLS-DA score plots fromP. ginsengsamples. We analyzed the aerial and root parts ofP. ginsengseparately after(A)short period and(B)long period of stress exposure. By using gas chromatography time-of-flight mass spectrometry (GC-TOF-MS), the PCA and PLS-DA analysis of metabolites are presented. O, aerial part;1, root part; Black icon, Mock; Red icon, DCY84Ttreatment; Green icon, NaCl 300 mM treatment; Blue icon, DCY84T+NaCl 300 mM treatment.
species are glycophytes, including ginseng. DCY84T treatment
of ginseng seedlings activated the transcription of several ion-pump-related genes responsible for maintaining ion fluxes that could be involved in preventing the toxic effects of ionic stress. As high sodium levels occurred, a low affinity Na+ transporter
called HKT1 helped move Na+ into the cytosol (Laohavisit
et al., 2013). Excess Ca2+can protect plants from Na+toxicity.
Compelling evidence gathered over the years has shown that after the perception of salt stress, a Ca2+ spike generated in
the cytoplasm of root cells activates a SOS signal transduction cascade to protect cells from damage due to excessive sodium ion accumulation (Quintero et al., 2002; Chinnusamy et al., 2005; Quan et al., 2007). It starts by activating the SOS3 calcium binding protein to bind and activate SOS2, a protein kinase family member (Zhu, 2000). In this study, we found very high expression levels of SOS3 and SOS2 in the seedlings primed with DCY84Teven before exposure to salinity stress, indicating
that SOS signaling was somehow already idle. This SOS3-SOS2 complex was previously reported to bind with a Na+/H+
antiporter (Qiu et al., 2002; Chen et al., 2014). Our transcription analysis demonstrated thatSOS1 encodes a plasma membrane Na+/H+ antiporter that was upregulated during salinity stress
(Shi et al., 2000; Quintero et al., 2011). On the other hand, its isoform (located on a vacuole regulated byNHX1) did not change significantly. These results indicate that ginseng cells tend to pump excess sodium ions out of cells, rather than store them in cell compartments. A similar tendency was recently reported inPopulus(Martínez-Alcántara et al., 2015), but the reverse was reported for citrus (Peng et al., 2016) and upland cotton (Zhang
et al., 2004). This pumping process was coupled with the
electrochemical gradient generated by H+-ATPases. Apart from
the SOS2-SOS3 complex, SOS2 can independently activate the pyridoxal kinase SOS4 to generate an active form of vitamin
B6 (Shi et al., 2002), pyridoxal-5-phosphate (PLP), as reported
(Rueschhoff et al., 2013). PLP might regulate ion channels or
transporters in salt tolerance mechanisms (Shi and Zhu, 2002). Our finding of synergy in the high transcription levels ofSOS1,
SOS2, and SOS4 confirms that previous report. Furthermore, we found that SOS4 indirectly affected the activation of the K+ channel AKT1 to maintain K+ levels inside the cytosol. In
these ways, the primed ginseng seedlings coped with the ionic stress caused by sodium toxicity by pumping sodium out of cells rather than storing it inside compartments and maintaining potassium levels inside cells. The ion profile also revealed that primed ginseng plants had higher K+ and lower Na+ during
salinity stress than stressed plants. A previous report on soybeans
(Martínez-Alcántara et al., 2015) described the importance of
maintaining the Na+/K+ratio with regard to salt tolerance.
Apart from salt tolerance activity of DCY84Twe also analyzed
growth-promoting activity. The strain DCY84Tproduces 52.96
± 1.85µg/ml and 72.83 ± 2.86µg/ml of indole-3-acetic
acid without and with L-tryptophan, respectively. We also evaluated its growth-promoting activity by quantifying the expression pattern of root meristem genes such as PgLAX,
PgHB8, and PgPIN. Upon priming of DCY84T, expression
was dramatically increased in all three genes compared with salt-stressed seedlings, indicating that DCY84T has
increased nutrient availability in salt-stressed seedlings by accumulating dehydrogenase, invertase and amylase.
In conclusion, DCY84Tincreased nutrient availability (mostly
sugar) and provided osmolytes to help ginseng plants tolerate short-term salinity stress (osmotic stress). During long-term salinity stress, activation of salt-defense-related genes such as ABA synthesis genes, ROS scavenging genes, ion-pump-related genes, and root meristem genes prevented both long- and short-term salinity stress. Moreover, DCY84Texhibited growth-promoting properties even under salinity stress. Therefore, DCY84T can strengthen plants as a microbial inoculant in
ginseng fields affected by salinity stress.
AUTHOR CONTRIBUTIONS
Yu-JK conceived the original screening and research plans. DY supervised the experiments. JS and SB performed most of the
experiments. Ye-JK and SK performed quantitative real-time PCR. CL analyzed metabolite profiles. SB and JS wrote the manuscript and critically interpreted the data.
FUNDING
This work was carried out with the support of the Cooperative Research Program for Agriculture Science and Technology Development (Project No. PJ0128132018), Rural Development Administration, and also supported by the project (20171538) from Kyung Hee University, Republic of Korea.
SUPPLEMENTARY MATERIAL
The Supplementary Material for this article can be found online at: https://www.frontiersin.org/articles/10.3389/fpls.2018. 00813/full#supplementary-material
REFERENCES
Ahanger, M. A., Abeer, H., Abd Allah, E. F., and Ahmad, P. (2014). “Arbuscular mycorrhiza in crop improvement under environmental stress,” inEmerging Technologies and Management of Crop Stress Tolerance, Vol. 2, eds P. Ahmad and S. Rasool (New York, NY: Elsevier Inc.; Academic Press), 69–95. Annunziata, M. G., Ciarmiello, L. F., Woodrow, P., Maximova, E., Fuggi, A.,
and Carillo, P. (2017). Durum wheat roots adapt to salinity remodeling the cellular content of nitrogen metabolites and sucrose.Front. Plant Sci.7:2035. doi: 10.3389/fpls.2016.02035
Basillo, M., Rodriguez, H., Moreno, M., Hernandez, J. P., and Bashan, Y. (2004). Mitigation of salt stress in wheat seedlings by a GFP-taggedAzospirillum lipoferum.Biol. Fert. Soils40, 188–193. doi: 10.1007/s00374-004-0757-z Bharti, N., Barnawal, D., Awasthi, A., Yadav, A., and Kalra, A. (2014). Plant growth
promoting rhizobacteria alleviate salinity induced negative effects on growth, oil content and physiological status inMentha arvensis.Acta Physiol. Plant. 36, 45–60. doi: 10.1007/s11738-013-1385-8
Bharti, N., Pandey, S. S., Barnawal, D., Patel, V. K., and Kalra, A. (2016). Plant growth promoting rhizobacteriaDietzia natronolimnaeamodulates the expression of stress responsive genes providing protection of wheat from salinity stress.Sci. Rep.6:34768. doi: 10.1038/srep34768
Bhattacharyya, P. N., and Jha, D. K. (2012). Plant growth-promoting rhizobacteria (PGPR): emergence in agriculture. World J. Microbiol. Biotechnol. 28, 1327–1350. doi: 10.1007/s11274-011-0979-9
Buege, J. A., and Aust, S. D. (1978). Microsomal lipid peroxidation.Meth. Enzymol. 52, 302–310. doi: 10.1016/S0076-6879(78)52032-6
Burden, R. S., and Taylor, H. F. (1976). Xanthoxin and abscisic acid.Pure Appl. Chem. 47, 203–209. doi: 10.1351/pac197647020203
Chen, H., Chen, X., Gu, H., Wu, B., Zhang, H., Yuan, X., et al. (2014). GmHKT1; 4, a novel soybean gene regulating Na+/K+ ratio in roots
enhances salt tolerance in transgenic plants.Plant Growth Regul.73, 299–308. doi: 10.1007/s10725-014-9890-3
Chinnusamy, V., Jagendorf, A., and Zhu, J. K. (2005). Understanding and improving salt tolerance in plants. Crop Sci. Soc. Am. 45, 437–448. doi: 10.2135/cropsci2005.0437
Cole, M. A. (1977). Lead inhibition of enzyme synthesis in soil.Appl. Environ. Biol. 33, 262–268.
Cutler, A. J., and Krochko, J. E. (1999). Formation and breakdown of ABA.Trends Plant Sci.4, 472–478. doi: 10.1016/S1360-1385(99)01497-1
Davey, M. W., Stals, E., Panis, B., Keulemans, J., and Swennen, R. L. (2005). High-throughput determination of malondialdehyde in plant tissues.Anal. Biochem. 347, 201–207. doi: 10.1016/j.ab.2005.09.041
Diaz-Zorita, M., and Fernandez-Canigia, M. V. (2009). Field performance of a liquid formulation of Azospirillum brasilense on dryland wheat
productivity. Eur. J. Soil Biol. 45, 3–11. doi: 10.1016/j.ejsobi.2008.0 7.001
Egamberdieva, D., and Da Silva, J. A. T. (2015). “Medicinal plants and PGPR: a new frontier for phytochemicals,” inPlant-Growth-Promoting Rhizobacteria (PGPR) and Medicinal Plants(Switzerland: Springer International Publishing), 287–303. doi: 10.1007/978-3-319-13401-7_14
Egamberdieva, D., Gafurova, L., and Islam, K. R. (2007). “Salinity effects on irrigated soil chemical and biological properties in the Syr Darya basin of Uzbekistan,” inClimate Change and Terrestrial C Sequestration of Centrak Asia, eds R. Lal, M. Sulaimanov, B. Stewart, D. Hansen, and P. Doraiswamy (New York, NY: Taylor-Francis), 147–192.
Eivazi, F., and Tabatabai, M. A. (1977). Phosphatases in soils.Soil Biol. Biochem.9, 167–172. doi: 10.1016/0038-0717(77)90070-0
Estrada, G. A., Baldani, V. L. D., De Oliveira, D. M., Urquiaga, S., and Baldani, J. I. (2013). Selection of phosphate-solubilizing diazotrophic HerbaspirillumandBurkholderiastrains and their effect on rice crop yield and nutrient uptake. Plant Soil 369, 115–129. doi: 10.1007/s11104-012-1550-7
Farh, M. A., Kim, Y. J., Van, An, H., Sukweenadhi, J., Singh, P., Huq, M. A., et al. (2015). Burkholderia ginsengiterrae sp. nov. and Burkholderia panaciterrae sp. nov., antagonistic bacteria against root rot pathogen Cylindrocarpon destructans, isolated from ginseng soil. Arch. Microbiol. 197, 439–447. doi: 10.1007/s00203-014-1075-y
Forchetti, G., Masciarelli, O., Alemano, S., Alvarez, D., and Abdala, G. (2007). Endophytic bacteria in sunflower (Helianthus annuus L.): isolation, characterization, and production of jasmonates and abscisic acid in culture medium. Appl. Microbiol. Biotechnol. 76, 1145–1152. doi: 10.1007/s00253-007-1077-7
Glick, B. R. (2012). Plant growth-promoting bacteria: mechanisms and applications.Scientifica2012:963401. doi: 10.6064/2012/963401
Glickmann, E., and Dessaux, Y. (1995) A Critical Examin Kashmir and their effect on improving growth and nutrient contents of maize (Zea maysL.).Front. Microbiol. 6:207.
Gontia, I., Kavita, K., Schmid, M., Hartmann, A., and Jha, B. (2011). Brachybacterium saurashtrense sp. nov., a halotolerant root-associated bacterium with plant growth-promoting potential.Int. J. Syst. Evol. Microbiol. 61, 2799–2804. doi: 10.1099/ijs.0.023176-0
Goswami, D., Dhandhukia, P., Patel, P., and Thakker, J. N. (2014). Screening of PGPR from saline desert of Kutch: growth promotion in Arachis hypogea by Bacillus licheniformis A2.Microbiol. Res. 169, 66–75. doi: 10.1016/j.micres.2013.07.004