TUBERCULOSIS (TB) IDENTIFICATION
Department of Physics, the Faculty of Science and Mathematics, Diponegoro University, Indonesia1
Information System Magister, Diponegoro University, Indonesia 2
Department of Informatics, the Faculty of Science and Mathematics, Diponegoro University, Indonesia 3
Abstract: Tuberculosis (TB) is an important public health issue in this world. In 1992, World Health Organization (WHO) has determined tuberculosis as Global Emergency. The cause of tuberculosis disease is Mycobacterium tuberculosis. This bacteria is bar shaped and has the quality of acid fast so that it’s also known as Acid Fast Bacilli (AFB). In this research, an algorithm to identifying and counting the number of tuberculosis bacteria has developed by microscope imaging. Color segmentation is done by way of extracting the Saturation channel of NTSC (Luminance, Hue, saturation) color model. Thresholding process is using Otsu Method. Feature extraction for bacteria shape identification process using two parameters i.e. eccentricity and compactness. The training and object recognition using Support Vector Machine algorithm. The result of development counting is equal to the manual counting result. This is show that Support Vector Machine is good to be applied in detecting and counting the number of tuberculosis bacteria.
Keywords:image processing, tuberculosis bacteria, microscopic, Support Vector Machine.
I. INTRODUCTION
Mycobacterium tuberculosis which released when tubercular (TB) coughing can cause the tuberculosis disease to spread on another people. Mycobacterium tuberculosis enters and gathers in lungs then proliferates become much more (especially in person with low body endurance). TB bacteria can spread out through the blood vessel or the lymph gland, therefore tuberculosis (TB) disease needs to be coped and at the present become the attention in the world [1][2]. Somebody who has been infected by TB if TB bacteria be in his body although it’s inactive. So that will cause the immunity get decreasing in controlling the bacteria. TB bacteria can live in the body for years long in non-active form. When the bacteria is non active so the disease can’t be spread out to the others.
Several researchers have developed algorithms for identifying tuberculosis bacteria using color segmentation method [3,4,5,6]. Nowadays research about image processing algorithm for identification of TB bacteria previously has been done by Ibnu et.al. The research is using image segmentation process by color extraction method manually [7]. Afterwards the next algorithm development research is done by Kusworo et.al., that is doing color segmentation automatically in HSV channel (Hue Saturation Value). W hereas for the classification using artificial neural network (ANN). In the mentioned research is obtained value of the correlation factor about 1 [8]. Identification process using ANN algorithm to distinguish between objects which are TB bacteria and non -TB bacteria. Therefore in this research developed an algorithm for segmentation of TB bacteria by using color channel NTSC (Luminance, Hue, Saturation) and classification Support Vector Machine (SVM) .
Paper is organized as follows. Section II describes automatic text detection using morphological operations, connected component analysis and set of selection or rejection criteria. The flow diagram represents the step of the algorithm. After detection of text, how text region is filled using an Inpainting technique that is given in Section III. Section IV presents experimental results showing results of images tested. Finally, Section V presents conclusion.
II. DESIGN AND IMPLEMENTATION SYSTEM
2.1. Identification System of TB Bacteria
Tuberculosis is a disease caused by infection of a systemic Mycobacterium tuberculosis germ, which can be manifest in almost all of organ with major location in lungs which commonly is the primary infection location. Mycobacterium
tuberculosis is bar shaped straight or slightly tortuous. This bacteria has a measurement of width 0.3 – 0.6 mm and
length 1-4 mm.
Pulmonary tuberculosis is a serious disease particularly in a baby and a little child, a malnutrition child, and a child with an immunology nuisance. A considerable part of children is suffering primary tuberculosis in young aged and much of them are asymptomatic and spontaneously recover without any remnant symptom. In several patient, the disease round into post-primary tuberculosis.
The developing process of tuberculosis identification is consist of two stages. The first stage is image processing of the sputum infected by TB bacteria. Then continued to the second stage that is formation perceptron network to identify bacteria. Block diagram of developing process of the algorithm for tuberculosis identification is shown in Fig 1.
Fig 1. Block diagram of the developing process of tuberculosis identification
2.2. Color Segmentation
Color segmentation is begun with conversion process of image color model which originally RGB (Red, Green, Blue) to NTSC (Luminance, Hue, Saturation). Afterwards the Saturation component of the input image is extracted and changed to binary through auto-thresholding process using Otsu methods. Furthermore the binary image is reconstructed using the closing and opening process [9].
2.3. Feature Extraction
Fig 2. Several samples of data training used in training process [3,6].
Eccentricities is a ratio between the distance of foci ellipse and length of major axis [10].
√ (1)
Where e is the value of eccentricity, a is the length of major axis, and b is the length of minor axis. Compactness is a
ratio of perimeter square and the area of an object.
(2)
Where C is the value of compactness, P is the perimeter value, and A is the object area.
Each of this two parameters value is saved in format .txt and will be used as input features in the Support Vector Machine training process.
2.4. Support Vector Machine (SVM)
SVM algorithm tries to find the best hyper plane in the input space. Purpose of the training in SVM is to find a
separator function (classifier) so that the separator function can be used to classify the data. Training
set: set{ } , where personate the input and { } as the output, indicating the class. The SVM
formulation is begun from the assumption that the case which can be separated linearly is [11,12] :
(3)
(4)
In the SVM training process, a positive TB bacteria is classified in class 1, whereas a negative TB bacteria included in class 2. Process of SVM training in the data training of tuberculosis bacteria is shown in Fig 3.
Fig 3. The process of SVM training with kernel linear toward 1429 training data which consist of 929 Positive TB (class 1/red colored) and 500
0 5 10 15 20 25 30 35
0.8 0.85 0.9 0.95 1 1.05
After the training process finished, executed the testing process. The data test which located upon the right of separator line (hyper plane) appertain in class 1 or included in positive Tb bacteria. Whereas the data test which located to the left of hyper plane appertain in class 2 or included in negative TB bacteria. One of the testing process sample of data test which has been done is shown in Fig 4.
Fig 4. SVM classification process toward the data test (purple)
III.RESULTS
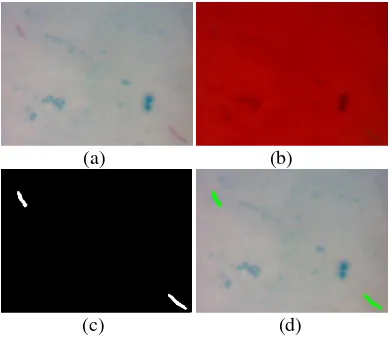
Image segmentation process is developed by converting color model RGB to NTSC (Luminance, Hue, Saturation). This segmentation process development is done in order that the obtained segmentation result better than that of previous method (conversion of color model RGB to HSV). The saturation component in NTSC image is extracted so that obtained grayscale image. Grayscale image afterwards is converted to binary image through the thresholding process using Otsu method. The segmented image afterwards is identified using classification algorithm the Support Vector Machine. Result of the image processed development is shown in Fig 5.
(a) (b)
(c) (d)
Fig 5. Image processed (a) Original image, (b) Image the result of RGB to NTSC conversion, (c) Image the result of autotresholding, (d) Image testing using SVM algorithm
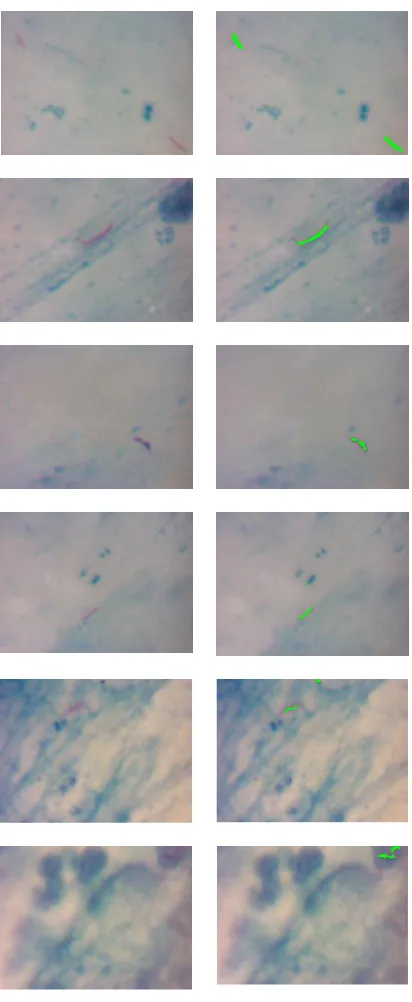
In the testing process using Support Vector Machine, the piled bacteria has coordinates which its location is so far from another non-piled bacteria. This is made as parameter which can distinguish between the piled bacteria and which is not. The piled bacteria is counted by number of two whereas the non-piled bacteria is counted as 1. With the labeling method, number of the counted positive TB bacteria in Figure 5 is 2. This value is equal to the manual counting result. Result of the testing process toward 6 (six) test-images using SVM algorithm is shown in Fig 6.
Fig 6. Result of the testing process toward 6 (six) test-images
IV. CONCLUSION
According to the research which has been done, can be concluded that: The designed system is capable to detecting and counting the number of tuberculosis bacteria by microscope imaging. Thresholding process is using Otsu Method. Feature extraction for bacteria shape identification process using two parameters that is eccentricity and compactness. Training and object recognition using Support Vector Machine algorithm. The result of development counting is equal to the manual counting result. This is show that Support Vector Machine is good to be applied in detecting and counting the number of tuberculosis bacteria.
ACKNOWLEDGMENT
This research was funding from the Ministry of Research and Technology Republic of Indonesia through the Insentif SINAS Program in 2013.
REFERENCES
[1]. Avicenna, 2011, "Lung tuberculosis (Lung TB)" (in English), http://rajawana.com/artikel/kesehatan/264-tuberculosis-paru-tb-paru.html
Last access 13 April 2011 14.59.
[2]. WHO Report 2009, “Global Tuberculosis Control 2009: Epidemiology, Strategy, Financing”, WHO Press, World Health Organization,
ISBN 978 92 4 156380 2, Geneva, Switzerland, 2009.
[3]. Forero, M. G.; Cristobal, G. and Borrego, J. A., “Automatic Identification Techniques of Tuberculosis Bacteria”, SPIE Proceedings Of
The Applications Of Digital Image Processing XXVI, Vol.5203, pp. 71-81, ISBN 0-8194-5076-6, San Diego, CA, SPIE, Bellingham WA, 2003
[4]. Vishnu Makkapati, Ravindra Agrawal, and Raviraja Acharya, “Segmentation and classification of tuberculosis bacilli from ZN-stained
sputum smear images”, CASE 2009: pp. 217-220, 2009
[5]. Osman M.K., Mashor M.Y., Saad Z., and Jaafar H., “Colour Image Segmentation of Tuberculosis Bacilli in Ziehl-Neelsen-Stained Tissue
Images Using Moving K-Mean Clustering Procedure”, 2010 Fourth Asia International Conference on Mathematical/Analytical Modelling and Computer Simulation, pp.215-220, 2010
[6]. Forero, M. G.; Sroubek, F. and Cristobal, G., “Identification of Tuberculosis Bacteria Based on Shape and Color”, Real-Time Imaging,
Vol. 10, No. 4, pp. 251-262, ISSN 1077-2014, 2004
[7]. Ibnu S., Kusworo A., Rahmat G., Nelly M., “Development of Algorithm Tuberculosis Bacteria Identification Using Color Segmentation and Neural Networks”, IJVIPNS-IJENS, Volume 12, Isue 4, August 2012
[8]. Kusworo A., Rahmat G., Aris S., Adi P., Ari B., dan Nelly M., "Autothresholding Segmentation For Tuberculosis Bacteria Identification
In The Ziehl-Neelsen Sputum Sample", Proceedings The 7th International Conference on Information & Communication Technology and Systems (ICTS) 2013, ITS, May 15-16, Bali, 2013
[9]. Otsu N., “A Threshold Selection Method from Gray-level Histogram”, IEEE Transactions on Systems and Cybernetics, Vol. SMC-9 No.
1, 1979
[10]. R.C. Gonzalez and R.E. Woods, “Digital Image Processing Second Edition”,. New Jersey; Pearson Prentice Hall. 2004.
[11]. Lee, Y., Lin, Y. and Wahba, G., "Multicategory Support Vector Machines", Computing Science and Statistics 33, 2001
[12]. Lee, Y.; Lin, Y.; and Wahba, G. "Multicategory Support Vector Machines, Theory, and Application to the Classification of Microarray

![Fig 2. Several samples of data training used in training process [3,6].](https://thumb-ap.123doks.com/thumbv2/123dok/3821770.1834560/3.595.207.387.606.753/fig-samples-data-training-used-training-process.webp)