Asmus Leth Olsen is assistant profes-sor in the Department of Political Science at the University of Copenhagen. His research focuses on the effects of performance information, political and administrative psychology, behavioral public administra-tion, and the application of experimental methods in public administration. His work has appeared in journals such as Political Behavior, Public Choice, and Judgment and Decision Making.
E-mail: [email protected]
Public Administration Review, Vol. 75, Iss. 3, pp. 469–478. © 2015 by The American Society for Public Administration. DOI: 10.1111/puar.12337.
Asmus Leth Olsen
University of Copenhagen, Denmark
Abstract: Th is article introduces the importance of equivalence framing for understanding how satisfaction measures
aff ect citizens’ evaluation of public services. Does a 90 percent satisfaction rate have a diff erent eff ect than a logically equivalent 10 percent dissatisfaction rate? Two experiments were conducted on citizens’ evaluations of hospital services in a large, nationally representative sample of Danish citizens. Both experiments found that exposing citizens to a patient dissatisfaction measure led to more negative views of public service than exposing them to a logically equivalent satisfaction metric. Th ere is some support for part of the shift in evaluations being caused by a negativity bias: dissatis-faction has a larger negative impact than satisdissatis-faction has a positive impact. Both professional experience at a hospital and prior exposure to satisfaction rates reduced the negative response to dissatisfaction rates. Th e results call for further study of equivalence framing of performance information.
Practitioner Points
• Th e valence (positive/negative) of performance information can have substantial eff ects on citizens’ perception of public services—even if the underlying performance is exactly the same.
• Presenting citizens with a dissatisfaction rate of 10 percent induces a much more negative evaluation of public
services than presenting them with a logically equivalent satisfaction rate of 90 percent.
• Policy makers must carefully consider how minor equivalent changes in the presentation of performance information can induce large shifts in citizens’ perceptions of public service performance.
Th e article advances this research agenda along two lines. First, it introduces the importance of equiva-lence framing for our understanding of how satisfac-tion measures aff ect citizens’ evaluasatisfac-tions of public services (Druckman 2004; Levin, Schneider, and Gaeth 1998). Specifi cally, it points out that logi-cally equivalent changes to the valence of satisfaction measures can have large eff ects on citizens’ subsequent evaluations of public services. Th e trivial substitu-tion of a 90 percent satisfaction rate for a 10 percent
dissatisfaction rate may transform positive associations
and memories into negative ones for the exactsame
underlying information, which, in turn, shifts citizens’ evaluations of the data. Th e article tests this hypoth-esis by employing two experimental studies using a large-scale, nationally representative sample of Danish citizens (n = 3,443). It will highlight just how sensi-tive the eff ect of performance measures on citizens’ perceptions of public services is to minor changes in the descriptive valence.
Second, the article off ers an explanation of the potency of equivalency frames from the basis of a negativity bias. Th e negativity bias implies that “negative events are more salient, potent, dominant
Citizen (Dis)satisfaction: An Experimental
Equivalence Framing Study
information as an attempt to assign num-bers to the inputs, outputs, and outcomes of public services (Behn 2003; James 2011b; Moynihan 2008). Many such measures can be presented with varying valence of the label describing the underlying numerical attribute. Examples of this would be “death rates” versus “survival rates,” “unemployment rates” versus “employment rates,” or, for our focus here, “satisfaction rates” versus “dissatisfaction rates.” With the help of numbers, these labels can be shifted while holding the numerical value of the performance information logically equivalent. For instance, we can choose to report a 90 percent satisfaction rate or a 10 percent dissatisfaction rate.
Th ese are two objectively equivalent ways of presenting the exact same information while varying the valence of the wording of the performance measure.
However, changing the valence of performance information is important and not trivial because information is often encoded according to its descriptive valence (Levin and Gaeth 1988; Quattrone and Tversky 1988). Th e encoding evokes our associative memory by making associations of similar valence more accessible: a positive-valence description of an attribute leads to positive associa-tions in our memory, while a negative valence directs our memory toward negative associations. For example, a dissatisfaction rate makes negative associations about a public service more accessible. We can think of this as associations with a valence refl ecting
dis-satisfaction moving to the foreground: displeasing experiences, long
waiting times, low-quality service, unresponsive employees, and so on. On the other hand, when we are presented with a satisfac-tion rate, associations consistent with being satisfi ed become more accessible. Th e result is a “valence-consistent shift” in our judgment of the attribute (Druckman 2004; Levin, Schneider, and Gaeth 1998). Th at is, positive-valence information will lead to more posi-tive evaluations and negaposi-tive-valence information to more negaposi-tive evaluations—even if the underlying numerical information is logi-cally equivalent.
Th is leads to the fi rst expectation of the study: logically equivalent ways of framing citizen satisfaction can shift citizens’ evaluations of public services in either a negative or positive direction. Specifi cally, exposure to a satisfaction rate should induce more positive evalu-ations of public services, whereas exposure to a dissatisfaction rate should result in more negative evaluations.
Equivalence Framing Effects and the Negativity Bias
At this point, we have stated the simple expectation that attribute equivalence frames can cause valence-consistent shifts. Here we introduce the idea that valence-consistent shifts can be asymmetri-cal. Specifi cally, the negativity bias implies that negative information has a stronger impact than positive information of the same magni-tude. Metareviews of the negativity bias in psychology have found consistent support for this asymmetry across human perception, memory, decision making, and behavior (Baumeister et al. 2001; Rozin and Royzman 2001). We tend to pay more attention to, and direct more cognitive capacities toward, negative information than positive. Stronger reactions to negative information are likely to exist for evolutionary reasons: negative events (illness, combat, hunger, etc.) could be life threatening, while positive events usually in combinations, and generally effi cacious
than positive events” (Rozin and Royzman 2001, 297). In the study of performance information, the negativity bias implies that citizens are asymmetrical in their responses to good and bad performance, reacting mostly to the latter. Th e bias has found some support in observational studies (James and
John 2007; Boyne et al. 2009) and in experimental studies (James 2011a; Olsen 2013a). As James has argued, “More investigation of possible diff erence in magnitude of eff ect between informa-tion about good and bad performance is merited” (2011b, 414). However, the bias is diffi cult to detect if there is no neutral point of comparison for the asymmetrical eff ects of “good” versus “bad” performance.
Another challenge is the extent to which “good” and “bad” perfor-mance are in fact qualitatively diff erent. Maybe being asymmetrical in our response is sometimes warranted if bad performance is inher-ently diff erent. Th e experiments applied here overcome the latter problem by comparing logically equivalent pieces of negative- and positive-valence information. Th e former challenge is approached by testing how the framing eff ect is moderated by individual dif-ferences in alternative sources of information about performance and prior (experimental) exposure to information of opposite valence (Chingos, Henderson, and West 2012; Druckman 2004; Johnsen 2012).
In summary, the article adds to the existing body of research in two major ways: (1) to show how simple variations in equivalent presentations of performance information aff ect citizens’ percep-tion of public services and (2) to test how part of this eff ect is driven by a negativity bias in citizens’ responses. In addition, the more general implications of the study are threefold. First, the potency of equivalence frames for citizen satisfaction rates in particular—and performance information in general—poses fundamental questions about the fragility of these measures. Second, the article highlights the importance of framing research to our understanding of how performance information can serve an external accountability role. Th ird, the article informs our understanding of how reactions to performance information are aff ected by a negativity bias and what this implies for blame-avoiding behavior among policy makers. It also has implications for our understanding of the potential for manipulating perfor-mance measures by those responsible for collecting and reporting them. Th ese implications are further addressed in the concluding section.
Equivalence Framing and the Valence of Citizen (Dis) satisfaction
An equivalence framing eff ect occurs when “two logically equivalent (but not transparently equivalent) statements of a problem lead decision makers to choose diff erent options” (Rabin 1998, 36). With the notion of equivalence framing in mind, we can easily see that many performance information metrics can be presented as multiple variations of diff erent “objectively equivalent descriptions of the same problem” (Levin, Schneider, and Gaeth 1998, 150). For the study of performance information, equivalence frames have a very immediate relevance. Most defi nitions see performance
Th e negativity bias implies that
citizens are asymmetrical in
their responses to good and bad
performance, reacting mostly to
asymmetry of a negativity bias in this case would employ a neutral reference point in the middle of satisfaction and dissatisfaction. Here we confront this challenge in two ways.
Th e fi rst approach to unlock the dilemma is to consider how individual diff erences in alternative sources of information aff ect responses to diff erent-valence information. Here we draw on Johnsen, who speculated whether the negativity bias works diff er-ently for “public services where people in general have less direct experience” (2012, 139). Along the same lines, James has argued that the negativity bias may depend on how consistent the perfor-mance information is with “personal experience or word of mouth” (2011b, 414). Consistent with this, Chingos, Henderson, and West (2012) found that mostly citizens with few alternative sources of information about school performance had the strongest response to accountability ratings of school performance. Citizens can draw on multiple informal sources for performance information about the public sector. Th ese include media reports, personal experience, advice from family and friends, political debates, or inference from visible traits of a particular organization, such as its current users, facilities, staff , or manager. As laid out by James, “Citizens may not have much of an idea about the overall performance of a local pub-lic body only interacting with it on a case-by-case basis for a subset of services” (2011b, 402).
Th ese alternative sources may alter how performance information is encoded. Direct experience can be an important source of information about services, which can aff ect how formal performance information is used. If citizens generally respond more strongly to negative information, we can expect that negatively framed performance information will aff ect mostly citizens with limited prior information. Th erefore, we should expect that alternative information sources will dimin-ish the negativity bias of performance information. Th is would be consistent with the more general fi nding that individuals with high personal involvement or strongly held attitudes are less suscep-tible to framing eff ects (Druckman 2011; Levin, Schneider, and Gaeth 1998).
Th e second approach states that the asymmetrical eff ects of a satisfaction rate and a dissatisfaction rate can be teased out by exposing citizens to a sequence of both. Th e idea is that we can detect asymmetrical responses to positive and negative informa-tion by looking at how evaluainforma-tions change when citizens become aware of the equivalency. Th is can be done by comparing the evaluations of citizens exposed to diff erent sequences of confl ict-ing valence (e.g., negative to positive or positive to negative) with those of citizens exposed to performance information of the same valence (e.g., positive/positive or negative/negative). Generally, exposing individuals to mixed types of valence frames should reduce the framing eff ect as they become aware of the equivalence (Druckman 2004, 2011). For a negativity bias to be present, we expect that prior exposure to a satisfaction frame should reduce the valence-consistent shift in subsequent evaluations when exposed to
a dissatisfaction frame—but this should not be the case the other
way around. did not have the same immediacy (Hibbing, Smith, and Alford
2014, 303).
Th is idea has also found its way into political psychology, which, for a relatively long time, has focused on the asymmetrical eff ects of “positive” or “negative” information (Lau 1982, 1985). In politics, the negativity bias means that blame for bad performance is assigned to a much greater extent than is credit for good performance of a similar magnitude. Retrospective voting studies have found that a worsening economy damages the incumbent to a greater extent than an improving economy helps (Bloom and Price 1975; Kinder and Kiewiet 1979; Mueller 1973). In recent years, this research has spread beyond the traditional measures of economic performance indicators. Boyne et al. (2009) found evidence of a negativity bias in the eff ect of municipal performance information on electoral sup-port among English local governments. James and John (2007), also in an English local government setting, found that voters primarily punished poor performance and did not reward good performance to the same extent. Soroka (2006) found that negative economic performance was covered more intensely in the media than positive economic performance of a similar magnitude.
Recently, there has also been a set of experimental studies focusing on a negativity bias in citizens’ responses to good and bad perfor-mance information. James (2011a) found both experimental and observational support for a negativity bias.
Using a survey, he found that poor prior performance was punished more than excel-lent prior performance was praised. Further, he also found a negativity bias in an experi-ment on citizens’ service expectations, as poor performance aff ected expectations more than excellent performance. However, James (2011b) found no support for a negativity bias in a laboratory setting in which partici-pants were exposed to “good” and “bad”
per-formance information, although a possible explanation for this may be a discrepancy between the information provided and the actual performance of the jurisdiction in question. Another recent experi-ment on voters’ prospective performance preferences found support for a negativity bias in relative performance evaluations, as voters showed a strong preference for “not falling behind” other countries while showing very little interest in “getting in front” (Hansen, Olsen, and Bech 2014). James and Moseley (2014) found reduc-tions in satisfaction for citizens exposed to low performance and no detectable increase in satisfaction for cases of high performance.
Th is leads to our second expectation: that the valence-consistent shifts will be overly infl uenced by the negative valence. Th at is, the diff erence we may observe between a citizen satisfaction rate and a citizen dissatisfaction rate is attributable to the larger negative impact of the latter and less so to the positive impact of the former.
Negativity Bias or Positivity Bias?
A major challenge to the foregoing hypothesis is the lack of a proper counterfactual for comparison. If we are able to show that a satisfac-tion rate aff ects citizens’ evaluasatisfac-tions of public services diff erently from a dissatisfaction rate, how can we know which one of the two frames has a greater impact? Ideally, identifying the underlying
If citizens generally respond
more strongly to negative
information, we can expect that
negatively framed performance
information will aff ect mostly
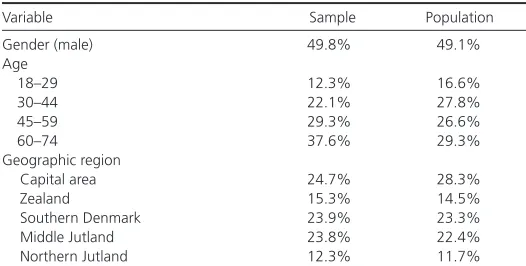
collected during October 15–22, 2012. For participating in the survey, participants received a number of points, which they could use in a shop administered by YouGov. Th e study was restricted to citizens between the ages of 18 and 74 and was prestratifi ed on gender, region, age, and political party choice in order to achieve a near-representative sample of the Danish population. Table 1 shows descriptive statistics for the sample and for the Danish population in the specifi ed age range. It shows a sample that, overall, refl ects the general population on these general sociodemographic characteris-tics. Furthermore, the sample is highly diverse and largely represent-ative in terms of political party choice and education. In summary, the sample provides strong external validity of the fi ndings across citizens with very diff erent background characteristics.
Experimental Design and Procedure
Th e experiment was a between-subjects design, as outlined in table 2. Th e premise of the experiment was that respondents were asked to evaluate a hospital given a single piece of performance information. Th e experiment took the following form: All respond-ents were provided a short factual note about the Danish Health and Medicines Authority. Following this, they were asked to evalu-ate the performance of an unnamed hospital. Here the experiment randomized the performance information provided to respondents at two levels. Overall, the two levels of treatment constituted an equivalence framing experiment in which respondents were assigned logically equivalent pieces of information (Levin, Schneider, and Gaeth 1998; Tversky and Kahneman 1981). At the fi rst level of randomization, respondents were randomly assigned to two diff er-ent conditions. Th e two conditions diff ered in how the hospital’s performance was framed in terms of either patient satisfaction or patient dissatisfaction. Clearly, the satisfaction frame constituted the positive-valence framing of performance information, while the dissatisfaction frame stressed the negative-valence aspects of the performance information.
In order for the treatments to be logically equivalent, a second level of random assignment was introduced in which respondents were randomly assigned various percentages of satisfaction or dis-satisfaction. For the two diff erent frames, the numerical content was drawn from two diff erent uniform distributions. In a uniform distribution, the values within an interval have an equal probability of being drawn. In the satisfaction frame, the uniform distribution ranged from 75.0 percent to 95.0 percent satisfi ed patients (pre-sented with one decimal). In the dissatisfi ed frame, this interval was inverted, providing a range of treatment values from 25.0 percent to 5.0 percent dissatisfi ed patients. For instance, some respondents were given the following treatment: “At the hospital, 10 percent of the patients are dissatisfi ed with their treatment.” At the same time, other respondents were provided with the logical equivalent:
Design: Two Experimental Studies in a Large Representative Sample
Th e expectations formulated earlier will be examined through two separate experiments conducted in a large, nationally representa-tive sample of Danish citizens. Th e context for both experiments is Danish hospital services. Th e Danish health care system is a corner-stone of the modern Danish welfare state. In the Danish health care system, 85 percent of the costs are fi nanced through taxes. Health care services are administered at three diff erent political levels, namely, the central government, fi ve regions, and 98 municipali-ties. Here the focus is on hospitals, which are under the political authority of the fi ve regions. Reporting various measures of patient satisfaction with hospital care is common practice today across most developed countries (Kravitz 1998; Mannion, Davies, and Marshall 2005; Pope 2009; Williams 1994). Th ere are already some stud-ies on how performance reporting aff ects health professionals and patients (Hibbard, Stockard, and Tusler 2003, 2005).
Study 1: Experiment on Hospital Satisfaction/ Dissatisfaction
Th e purpose of the fi rst experimental study was twofold: (1) to test whether valence-consistent shifts in evaluations of hospital services happened in response to exposing citizens to either satisfaction rates or dissatisfaction rates, and (2) to test whether the eff ect was moderated by citizens’ alternative sources of information about hospital services in order to identify a negativity bias as an underly-ing mechanism.
Participants
Th e study relied on a large, nationally representative sample recruited through YouGov’s Danish online panel (n = 3,443).
Th rough the panel, YouGov made contact with 8,204 respond-ents, which means the response rate was 42 percent. Th e data were
Table 1 Descriptive Statistics
Variable Sample Population
Gender (male) 49.8% 49.1%
Age
18–29 12.3% 16.6%
30–44 22.1% 27.8%
45–59 29.3% 26.6%
60–74 37.6% 29.3%
Geographic region
Capital area 24.7% 28.3%
Zealand 15.3% 14.5%
Southern Denmark 23.9% 23.3%
Middle Jutland 23.8% 22.4%
Northern Jutland 12.3% 11.7%
Note: CAWI (computer-assisted web interviewing) survey in the Danish YouGov panel.
N = 3,443.
Table 2 Experimental Design in Study 1
Baseline Question (all participants) Treatment Frame Treatment Wording (randomly assigned) Numerical Treatment (randomly assigned)
Danish Health and Medicines Authority consistently records how patients experienced their treatment at Danish hospitals. How do you think the fol-lowing hospital is doing?
A: Satisfaction
N = 1,716
At the hospital, X% of the patients are satisfi ed with their treatment.
X ∈ U (75.0, 95.0)
B: Dissatisfaction
N = 1,727
At the hospital, X% of the patients are dissatisfi ed with their treatment.
X ∈ U (5.0, 25.0)
Notes: Outline of experiment conducted with YouGov’s Danish online panel (n = 3,443). Participants were randomly assigned to one of two conditions (satisfaction/
Empirical Results
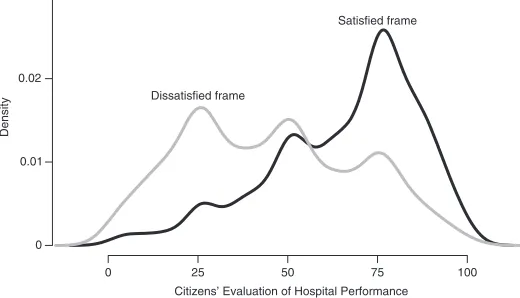
Th e distributions of responses under the satisfi ed and dissatisfi ed frames are reported in the density plot in fi gure 1. Under the satis-fi ed frame, citizens gave the unnamed hospital an average score of 65.9 (SD = 20.7). However, for the dissatisfi ed frame, the average score was only 45.4 (SD = 24.1). On average, citizens evaluated hospitals under the satisfi ed frame as signifi cantly better, with an average diff erence of 20.5 points (p < .01). Th e eff ect is substantially similar or even larger if medians or trimmed means are calculated.1
Th e eff ect is substantial: the mean diff erence corresponds to about a one-standard-deviation change in the dependent variable. Th is strongly indicates a valence-consistent shift in evaluations induced by framing performance information as either satisfaction or dissatisfaction.
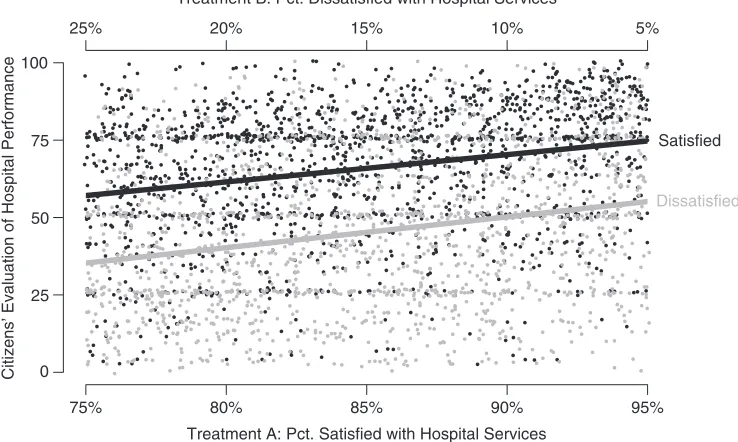
In fi gure 2, the framing eff ect is shown across the numerical treat-ments. Table 3 reports further tests of the framing eff ect. From the fi gure and table, we can see that citizens responded positively to both higher satisfaction and lower dissatisfaction rates. On average, evalu-ation improved signifi cantly, by around 0.9 point for each percent-age point improvement in satisfaction/dissatisfaction (see model B). We can now compare the frame treatment and numerical treatment in magnitude. Doing so tells us that an approximately 22-point improvement in the percentage of satisfi ed/dissatisfi ed has the same eff ect as changing the overall framing from dissatisfaction to satisfac-tion. Th is strongly indicates the potency of the valence framing eff ect.
We can compare diff erences in responses to changes in satisfac-tion and dissatisfacsatisfac-tion rates. In table 3, model C, this is done by interacting the treatment frame with the numerical frame. Th e interaction term is positive, which indicates a stronger response to numerical changes in the dissatisfaction frame. However, the eff ect is not signifi cant. Th is implies that a diff erence in the numerical magnitude of positive- and negative-valence information does not assert any infl uence. Th e only thing that matters is the valence of the information, not its magnitude.
Th e next step was to understand the underlying mechanisms for the large diff erence in evaluations for the satisfaction and “At the hospital, 90 percent of the patients are satisfi ed with their
treatment.” Th at is, for each set of respondents asked to evaluate a given rate of hospital satisfaction, the data contain a similar set of respondents evaluating logically identical metrics of hospital
dissat-isfaction. Th e random assignment of percentages provided
respond-ents with around 100 diff erent treatment values under each frame.
Th e assignment of a large range of diff erent values allows for testing whether the framing of performance is dependent on the numerical content of the frame. Numerical content has been found to aff ect both citizens’ attitudes and the behaviors of policy makers in unex-pected ways (Ansolabehere, Meredith, and Snowberg 2013; Olsen 2013b, 2013c). By randomizing the numerical content, the results cannot be driven by idiosyncratic artifacts of the numerical values that respondents were given. Th erefore, it enhances the robustness of the fi ndings if they hold for a large range of numerical values. For the outcome measure, the respondents were asked to provide their evaluation of the hospital. Th eir response was given on a 101-point sliding scale ranging from “very bad” (0) to “very good” (100). Respondents could not choose to not respond or to provide a “don’t know” response. Across all treatments, the average response was 55.6 (SD = 24.7) and the median response 57.
It is important to note that the experiment did not allow us to directly assess the question of a negativity bias. As outlined in the theory section, if we found a diff erence in hospital evaluations between the two frames, we would not be able to directly attribute this diff erence solely to one of them specifi cally. Ideally, we would like to have some neutral point of satisfaction or dissatisfaction to which we could compare the two frames in order to measure which one of them has an asymmetrical impact on evaluations. Unfortunately, no such neutral category is easy to come up with for satisfaction measures.
Instead, as argued in the theory section, we used alternative information sources as a moderator that could shed some light on which frame was driving a potential eff ect. In terms of alternative information sources, we relied on two diff erent indicators. Th e fi rst was a dummy variable indicating whether the respondent had been to a hospital within the last year (17.8 percent). Th is indicated a personal experience with hospital services, which can be seen as an important alternative source of performance information. Th e second indicator was a dummy variable indicating whether the respondent either currently worked or previously had worked at a hospital (10.6 percent). Th is indicator captured any type of profes-sional work-related experience in a hospital setting. In summary, both indicators captured the extent to which respondents had alternative sources of hospital performance other than the perfor-mance information they were provided in the experiment. We also included some controls in some specifi cations in order to make sure that these two indicators did not simply capture some other factor correlated with alternative information sources and evaluations. Th e controls included age, gender, and region. We also included a dummy for respondents with private sector employment (32.6 per-cent) to capture diff erences between them and those in the public sector or out of work. Finally, a dummy captured respondents with an intent to vote for one of the four parties that were either in gov-ernment or that supported the govgov-ernment at the time of the study (36.5 percent).
0 25 50 75 100
0 0.01 0.02 0.03
Citizens’ Evaluation of Hospital Performance
Density
Satisfied frame
Dissatisfied frame
Notes: The x-axis represents the dependent variable of citizens’ evaluations of hospital performance. Higher scores indicate a better evaluation.
N = 3,443.
Interestingly, the main eff ect of work experience is negative and insignifi cant, which suggests that there is no diff erence under the satisfi ed frame. In other words, alternative sources of informa-tion matter for the eff ect of negative-valence informainforma-tion but do not alter the eff ect of positive-valence information. Th is result is substantially the same if we add a set of control variables (cf. model F). Th e fi nding is also substantially the same if we inter-act all control variables with the treatment frame in the same model.2
In fi gure 3, we can directly compare the eff ects for the two frames. Th e mean diff erence between the two frames amounts to a statisti-cally signifi cant eff ect of 9.1 points (p < .01) between those with and dissatisfaction frame. Here we studied heterogeneous responses for
respondents with alternative information sources about hospital services. Table 3, models D–F report these results. In fi gure 3, coeffi cients with 95 percent confi dence intervals are shown for (1) whether the respondent had been hospitalized within the last year or (2) whether the respondent currently worked or had worked at a hospital. Th e mean diff erences are based on the coeffi cients in table 1, model F.
For respondents with hospital work, the interaction eff ect is positive and signifi cant at 7.4 points. Th at is, in the dissatisfi ed frame, respondents with current or prior work experience at a hospital gave higher evaluations than those with no experience.
Notes: Ordinary least squares estimated slopes for the satisfi ed (black line and dots) and dissatisfi ed (gray line and dots) frames. The lower horizontal axis shows the treatment percent received under the satisfi ed frame. The upper horizontal axis shows the treatment percent assigned under the dissatisfi ed frame.
N = 3,443.
Figure 2 Effect of Satisfi ed Percentage and the Dissatisfi ed Percentage
0 25 50 75 100
75% 80% 85% 90% 95%
25% 20% 15% 10% 5%
Treatment A: Pct. Satisfied with Hospital Services Treatment B: Pct. Dissatisfied with Hospital Services
Citizens’ Evaluation of Hospital Performance
Satisfied
Dissatisfied
Table 3 Ordinary Least Squares Results from Experiment in Study 1
Model A Model B Model C Model D Model E Model F
Treatment frame (1 = dissatisfaction) −20.51**
(.77)
−20.68** (.74)
−30.25** (10.89)
−21.46** (.78)
−21.27** (.82)
−22.06** (.86)
Treatment percent .94**
(.06)
0.88** (.10)
.93** (.06)
.94** (.06)
.94** (.06)
Frame * Treatment percent .11
(.13)
Hospital work experience −1.68
(1.72)
−1.81 (1.74)
Patient experience .97
(1.37)
0.79 (1.38)
Work experience * Treatment frame 7.39**
(2.41)
7.31** (2.41)
Patient * Treatment frame 3.32
(1.94)
3.16 (1.94)
Intercept 65.87**
(.54)
−13.73** (5.45)
−9.00 (7.66)
−13.26** (5.44)
−14.35** (5.45)
−14.28** (5.74)
Adjusted R2
F-statistic
N
.17 717.2 3,443
.22 488.6 3,443
.22 325.9 3,443
.22 248.1 3,443
.22 247.2 3,443
.24 59.2 3,413
Notes: Ordinary least squares estimates with standard errors in parentheses. Signifi cance levels denote *p < .05 and **p < .01. Model F includes the following control
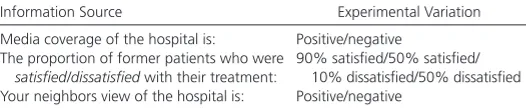
that . . .” Below the introduction was a box with three types of information about the hospital that varied in terms of the valence of the information provided. Th e three sources of information were shown simultaneously. Information sources and the experimental variation are reported in table 4. Th e main source of information echoed that of study 1: participants were informed about satisfac-tion/dissatisfaction performance measures for former patients of the hospital.
As in study 1, the percentage of satisfi ed/dissatisfi ed was var-ied, here with only four equivalent quantities. Th e two alterna-tive sources of information were media coverage and neighbors’ opinions. Th ese could vary only in terms of being either positive or negative. Importantly, these were not equivalents of diff erent valence but stated actual substantive diff erences. Combining treat-ment variations across the treattreat-ment types of information sources generated 16 diff erent treatment combinations (2 x 2 x 4 full facto-rial design). Th is gave us approximately 215 respondents in each condition.
Below the information box, the respondents were asked to report how likely they were to undergo the operation at the aforemen-tioned hospital. Th e response was provided on a scale similar to that used in study 1, a 101-point sliding scale ranging from “not at all likely” (0) to “very likely” (100). Across all treatments, the average response was 49.0 (SD = 26.9), with a median of 51.
without hospital work experience. Th e other indicator of alternative sources of information compared respondents that had been to a hospital in the past year with everybody else. Th e interaction eff ect is also positive but not signifi cant. We do not observe the same eff ect for this group. Th e mean diff erence-in-diff erence between the two frames is 2.4 (p = .31).
In summary, the distance between evaluations under the positive and negative frame is reduced by having alternative sources of infor-mation, and this eff ect is driven solely by a less negative response under the dissatisfi ed frame. Importantly, if the results were driven by a generally higher degree of satisfaction with hospital services among these groups, then we would expect them to respond more positively under both frames. However, this is not what the fi ndings indicate. Th e fact that alternative information sources aff ect only evaluations under the dissatisfaction frame indicates that alterna-tive information sources are likely to play a role in diminishing the negativity bias.3
Study 2: Experiment with Multiple Performance Cues
Th e second study served two purposes: (1) we were able to assess whether the results of study 1 would hold up if the performance information on satisfaction and dissatisfaction was presented in a context of alternative sources of information, and (2) the sequence of valence stimuli between study 1 and study 2 allowed us to obtain a better understanding of the underlying mechanism. Specifi cally, the experiment in study 2 occurred after study 1, which allowed us to analyze the eff ects in study 2 conditional on the treatment received in study 1. Study 2 relied on the exact same participants as study 1.
Experimental Design and Procedure
Study 2 had a between-subjects design. All respondents were con-fronted with the following hypothetical scenario: “Imagine that you have become sick and that you therefore need to have a nonemer-gency operation made at a hospital. About the hospital, you know
Satisfaction Dissatisfaction Satisfaction Dissatisfaction −4
−2 0 2 4 6 8 10 12
Hospital work experience vs. none Patient experience vs. none
Mean Diff
erence in Ev
aluation
Note: Mean differences in hospital evaluations with 95% confi dence intervals.
N = 3,443.
Figure 3 Alternative Information Sources and Frame Effect
Table 4 Experimental Design in Study 2
Information Source Experimental Variation
Media coverage of the hospital is:
The proportion of former patients who were
satisfi ed/dissatisfi ed with their treatment: Your neighbors view of the hospital is:
Positive/negative
90% satisfi ed/50% satisfi ed/ 10% dissatisfi ed/50% dissatisfi ed Positive/negative
Notes: Respondents were assigned to one of 16 possible combinations of values for the three stimuli variables. The experiment was conducted with You Gov’s
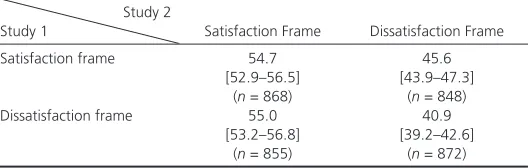
However, if respondents received a dissatisfaction frame in study 2, their response depended in part on their treatment frame in study 1. Specifi cally, those who received a satisfaction frame in study 1 evaluated the dissatisfaction frame signifi cantly better, by 4.7 points, in study 2 than those who had dissatisfaction frames in both studies (p < .01). Th is did not, however, work in reverse. Th ose fi rst exposed to a dissatisfaction frame did not rate the satisfaction frame any diff erently from those fi rst exposed to a satisfaction frame (p = .83). Th e results are substantially the same or stronger if median values are calculated.4 In other words, exposure to positive-valence
information diminished the (negative) response to subsequent negative-valence information—but not the other way around. One interpretation is that respondents fi rst exposed to the satisfaction frame became aware of the equivalence and therefore viewed the dis-satisfaction frame more mildly (Druckman 2004). Th is “correction” then did not happen the other way around, which could indicate that the satisfaction frame was viewed as the baseline or “regular” metric. Th is interpretation supports the negativity bias in the sense that exposure to both forms leads to a calibration of judgment con-cerning the negative information and not the positive information.
Conclusion
Citizens’ immediate responses to satisfaction metrics can be highly contingent on an arbitrary choice of a positive or negative label description. Th is is not a trivial fact in a world in which citizens’ sat-isfaction rates play a key role in informing the public about public sector performance. Th is article has shown how equivalence framing of citizen satisfaction measures can assert a huge impact on how citi-zens evaluate public services. Two experiments in a large, nationally representative sample of Danish citizens highlighted the following major fi ndings on the potency of equivalence framing.
Study 1 found that framing hospital perfor-mance in terms of dissatisfaction instead of satisfaction had a substantial negative impact on citizens’ evaluations of hospital services. Th e eff ect was constant along a large inter-val of diff erent numerical treatments for the percentage of patients being either satisfi ed or dissatisfi ed. Study 2 replicated the fram-ing eff ect in an experiment that also off ered alternative sources of information with both negative and positive valence. Importantly, the change in eff ect attributable to the equiva-lence frame was comparable to vaequiva-lence changes for media coverage and neighbor opinions, which both were nonequivalence frames.
Th eoretically, we also aimed to interpret part of this eff ect to refl ect a negativity bias. Th at is, diff erences in responses to satisfaction and dissatisfaction measures are driven by a disproportionate impact of negative-valence performance information—in this instance, a dissatisfaction rate. Some additional fi ndings support this inter-pretation. First, respondents with current or prior work experi-ence at a hospital were less aff ected by the dissatisfaction frame but responded like everyone else to the satisfaction frame. We take this as an indication that alternative sources of information about performance diminish the negativity bias. Second, by combining treatments across studies, we were able to show that those exposed to satisfaction in study 1 and dissatisfaction in study 2 were less negative in their assessment than those exposed to other treatment
Empirical Results
Th e main results are reported in table 5. First, we can note that respondents valued positive media coverage and neighbors’ opinions at the same order of magnitude. Changing
media coverage or neighbors’ opinions from negative to positive caused about a 13-point increase in the likelihood of choosing the hos-pital for a nonemergency operation. Turning to the satisfaction/dissatisfaction frames, we fi nd a similarly large and signifi cant eff ect as in study 1. Shifting from a hospital with 90 percent being satisfi ed to one with 10 percent being
dis-satisfi ed changes the likelihood of participants choosing that hospital
by around 15 percentage points. For the lower level of 50 percent satisfaction/dissatisfaction, the diff erence is around 7.5 points ( p <
.01). Th is highlights that study 1 may have induced an awareness of the equivalence between satisfaction and dissatisfaction that reduced the overall framing eff ect in study 2 (Druckman 2011).
Th is being said, it speaks to the power of the equivalency frame of satisfaction/dissatisfaction that the eff ects are similar for those found
for logically equivalent changes in valence compared with logically
dis-similar changes in valence (e.g., positive versus negative media
cover-age). Finally, we combined the treatments in study 1 and study 2 in order to test whether switching frame types changes the eff ect of exposure to satisfaction and dissatisfaction percentages. Th e results are reported in table 6.
For those who received the satisfaction frame in study 2, the frame received in study 1 did not aff ect their mean evaluations.
Table 5 Ordinary Least Squares Results from Study 2
Satisfaction/dissatisfaction (ref. = 10% dissatisfi ed) (ref.)
90% satisfi ed 15.62**
Media coverage (1 = positive) 12.97**
(0.73)
Neighbor opinion (1 = positive) 13.28**
(0.73)
Notes: Ordinary least squares estimates with standard errors in parentheses. Dependent variable: Likelihood of undergoing the operation at that hospital,
“not at all likely” (0) to “very likely” (100). Signifi cance levels denote *p < .05
and **p < .01.
Table 6 Mean Responses in Study 2 Conditional on Treatment in Study 1
Study 2
Study 1 Satisfaction Frame Dissatisfaction Frame
Satisfaction frame 54.7
Notes: Dependent variable: Likelihood of undergoing the operation at that hospital, “not at all likely” (0) to “very likely” (100). Mean responses with 95% confi dence intervals in brackets and sample sizes in parentheses.
Citizens’ immediate responses
to satisfaction metrics can be
highly contingent on an
arbi-trary choice of a positive or
combinations. We again take this to support a negativity bias interpretation of the main results because it highlights that prior exposure to positive-valence information weakens the response to negative-valence information—but not the other way around.
A minor cautionary note on the limits of the fi ndings should be made as a result of the hypothetical, low-incentive setting of the experimental design. Performance information is often presented in a more data-rich context of news reports, government Web pages, or offi cial publications. Th is being said, the analysis points to the importance of equivalence framing and, in part, the negativity bias for citizens’ response to satisfaction measures, and the fi ndings were very substantial and identifi ed in a large representative sample. In addition, we could argue that the identifi ed framing eff ect and nega-tivity bias could be even larger in a real-world setting, where citizens have to make sense of a greater number of cues about performance. Th is could leave them even more vulnerable to the eff ects found across the two studies.
Th e study off ers three broader implications for our understanding of citizens’ satisfaction measures and performance information more generally: Th e fi rst implication relates to our use and understanding of the eff ects of citizen satisfaction measures. Today, both govern-ments and researchers are focused on citizen satisfaction. We now know that changing the discussion to dissatisfaction has the potential to fundamentally aff ect citizens’ evaluations. Th is should remind both practitioners and researchers about the fragile nature of the performance measures we apply and how they aff ect the greater public. Small, arbitrary changes in the reporting of performance information have the potential to signifi cantly shift the perception of public services among those receiving the information in both negative and positive directions.
Th e second implication is a need to integrate our study of the eff ects of performance information into the broader framing research agenda (James 2011b; Moynihan 2008). Th ere are end-less ways to present performance information to citizens, and shifting the valence of a metric’s descriptive label is just a very basic example. Other examples include logically equivalent ways to present performance information on diff erent scales and with the aid of various reference points (Olsen 2013a). Th is opens up a broader research agenda on the informational cues that aff ect citizens’ attitudinal and behavioral response to performance information.
Th e fi nal implications of an equivalence framing eff ect and the underlying mechanism of a negativity bias point at downstream eff ects for the broader political-administrative system. Th e impor-tance of performance information valence ad ds another example to the list of ways in which individuals’ perceptions of blame are potentially malleable (Marvel 2014). Maybe the apparent wide-spread use of positive-valence performance information is indicative of policy makers’ fear of backlash. Some have linked the negativity bias to the general blame avoidance observed at the political level (Carpenter and Krause 2012; Mortensen 2013; Weaver 1986). As Hood notes, a “key test of political power can be said to be the ability to overcome or counteract negativity bias” (2007, 199). It is therefore highly important that future studies aim to understand how the informational valence of satisfaction measures can evoke an
either negative or positive response among citizens and, from there on, the rest of the political-administrative system.
Acknowledgments
Th e research was made possible by Grant No. 0602-02577B from the Danish Council for Independent Research. An earlier version of the paper was presented at the 11th Public Management Research Confer-ence, Madison, Wisconsin, June 20–23, 2013. I would like to thank the conference participants for valuable comments. Th e manuscript has also benefi ted greatly from the feedback from three anonymous reviewers and the editors of PAR. Any remaining errors are my own.
Notes
1. Th e median responses are 72 for the satisfaction frame and 45 for the dissatisfac-tion frame. Th is gives a median diff erence of 27 points. If we apply trimmed means, where the 10 percent most extreme observations in each tail are cut out, the results are 67.8 for the satisfaction frame and 44.9 for the dissatisfaction frame. Th is gives a mean diff erence of 22.9 points (rounded).
2. Th e interaction eff ect of work experience is 6.4 (p < .05), and the main eff ect of work experience is −1.0 (p = .45).
3. Psychological research has found slower reaction times for processing nega-tive information compared with posinega-tive information (Baumeister et al. 2001, 342). Some researchers have attributed this to the way that negative informa-tion initiates more complex and deeper processing (Rozin and Royzman 2001). Respondents provided with the dissatisfi ed frame were about 4.7 seconds slower in their response time than respondents under the satisfi ed frame (dissatisfi ed frame, M = 25.1 seconds; satisfi ed frame, M = 20.4 seconds). If median response times are used, the diff erence is cut to about 1.4 seconds.
4. Median values: dissatisfaction to satisfaction, 53; satisfaction to satisfaction, 52; satisfaction to dissatisfaction, 49; dissatisfaction to dissatisfaction, 42.5.
References
Ansolabehere, Stephen, Marc Meredith, and Erik Snowberg. 2013. Asking about Numbers: Why and How. Political Analysis 21(1): 48–69.
Baumeister, Roy F., Ellen Bratslavsky, Catrin Finkenauer, and Kathleen D. Vohs. 2001. Bad Is Stronger than Good. Review of General Psychology 5(4): 323–70. Behn, Robert D. 2003. Why Measure Performance? Diff erent Purposes Require
Diff erent Measures. Public Administration Review 63(5): 586–606. Bloom, Howard S., and H. Douglas Price. 1975. Voter Response to Short-Run
Economic Conditions: Th e Asymmetric Eff ect of Prosperity and Recession.
American Political Science Review 69(4): 1240–54.
Bouckaert, Geert, and Steven Van de Walle. 2003. Comparing Measures of Citizen Trust and User Satisfaction as Indicators of “Good Governance”: Diffi culties in Linking Trust and Satisfaction Indicators. International Review of Administrative Sciences 69(3): 329–43.
Bouckaert, Geert, Steven Van de Walle, and Jarl K. Kampen. 2005. Potential for Comparative Public Opinion Research in Public Administration. International Review of Administrative Sciences 71(2): 229–40.
Boyne, George A., Oliver James, Peter John, and Nicolai Petrovsky. 2009.
Democracy and Government Performance: Holding Incumbents Accountable in English Local Governments. Journal of Politics 71(4): 1273–84.
Carpenter, Daniel P., and George A. Krause. 2012. Reputation and Public Administration. Public Administration Review 72(1): 26–32.
Chingos, Matthew M., Michael Henderson, and Martin R. West. 2012. Citizen Perceptions of Government Service Quality: Evidence from Public Schools.
Quarterly Journal of Political Science 7(4): 411–45.
———. 2011. What’s It All About? Framing in Political Science. Perspectives on Framing. In Perspectives on Framing, edited by Gideon Keren, 297–302. New York: Psychology Press.
Folz, David H. 1996. Survey Research for Public Administration. Th ousand Oaks, CA: Sage Publications.
Hansen, Kasper M., Asmus L. Olsen, and Mickael Bech. 2014. Cross-National Yardstick Comparisons: Choice Experiment on a Forgotten Voter Heuristic. Political Behavior.
Published electronically on September 11. doi:10.1007/s11109-014-9288-y. Hibbard, Judith H., Jean Stockard, and Martin Tusler. 2003. Does Publicizing
Hospital Performance Stimulate Quality Improvement Eff orts? Health Aff airs
22(2): 84–94.
———. 2005. Hospital Performance Reports: Impact on Quality, Market Share, and Reputation. Health Aff airs 24(4): 1150–60.
Hibbing, John R., Kevin B. Smith, John R. Alford. 2014. Diff erences in Negativity Bias Underlie Variations in Political Ideology. Behavioral and Brain Science 37(3): 297–350.
Holzer, Marc, and Kaifeng Yang. 2004. Performance Measurement and Improvement: An Assessment of the State of the Art. International Review of Administrative Sciences 70(1): 15–31.
Hood, Christopher. 2007. What Happens When Transparency Meets Blame-Avoidance? Public Management Review 9(2): 191–210.
James, Oliver. 2011a. Managing Citizens’ Expectations of Public Service Performance: Evidence from Observation and Experimentation in Local Government. Public Administration 89(4): 1419–35.
———. 2011b. Performance Measures and Democracy: Information Eff ects on Citizens in Field and Laboratory Experiments. Journal of Public Administration Research and Th eory 21(3): 399–418.
James, Oliver, and Peter John. 2007. Public Management at the Ballot Box: Performance Information and Electoral Support for Incumbent English Local Governments. Journalof Public Administration Research and Th eory 17(4): 567–80. James, Oliver, and Alice Moseley. 2014. Does Performance Information about
Public Services Aff ect Citizens’ Perceptions, Satisfaction, and Voice Behaviour? Field Experiments with Absolute and Relative Performance Information. Public Administration 92(2): 493–511.
Johnsen, Åge. 2012. Why Does Poor Performance Get So Much Attention in Public Policy? Financial Accountability and Management 28(2): 121–42.
Kinder, Donald R., and D. Roderick Kiewiet. 1979. Economic Discontent and Political Behavior: Th e Role of Personal Grievances and Collective Economic Judgments in Congressional Voting. American Journal of Political Science 23(3): 495–527.
Kravitz, Richard. 1998. Patient Satisfaction with Health Care: Critical Outcome or Trivial Pursuit? Journal of General Internal Medicine 13(4): 280–82.
Lau, Richard R. 1982. Negativity in Political Perception. Political Behavior 4(4): 353–77. ———. 1985. Two Explanations for Negativity Eff ects in Political Behavior.
American Journal of Political Science 29(1): 119–38.
L evin, Irwin P., and Gary J. Gaeth. 1988. How Consumers Are Aff ected by the Framing of Attribute Information Before and After Consuming the Product.
Journal of Consumer Research 15(3): 374–78.
Levin, Irwin P., Sandra L. Schneider, and Gary J. Gaeth. 1998. All Frames Are Not Created Equal: A Typology and Critical Analysis of Framing Eff ects.
Organizational Behavior and Human Decision Processes 76(2): 149–88.
Mannion, Russell, Huw Davies, and Martin Marshall. 2005. Impact of Star Performance Ratings in English Acute Hospital Trusts. Journal of Health Services Research and Policy 10(1): 18–24.
Marvel, John D. 2014. Th e Boston Marathon Bombings: Who’s to Blame and Why It Matters for Public Administration. Public Administration Review. 75(6): 713–25.
Mortensen, Peter B. 2013. Public Sector Reform and Blame Avoidance Eff ects.
Journal of Public Policy 33(2): 229–53.
Moynihan, Donald P. 2008. Th e Dynamics of Performance Management: Constructing Information and Reform. Washington, DC: Georgetown University Press. Mueller, John E. 1973. War, Presidents, and Public Opinion. New York: Wiley. Olsen, Asmus Leth. 2013a. Compared to What? Experimental Evidence on Social
and Historical Reference Points in Performance Evaluation. Paper presented at the 11th Public Management Research Conference, Madison, WI, June 20–23.
———. 2013b. Leftmost-Digit-Bias in an Enumerated Public Sector? An Experiment on Citizens’ Judgment of Performance Information. Judgment and Decision Making 8(3): 365–71.
———. 2013c. Th e Politics of Digits: Evidence of Odd Taxation. Public Choice
154(1–2): 59–73.
Pope, Devin G. 2009. Reacting to Rankings: Evidence from America’s Best Hospitals.
Journal of Health Economics 28(6): 1154–65.
Quattrone, George A., and Amos Tversky. 1988. Contrasting Rational and Psychological Analyses of Political Choice. American Political Science Review
82(3): 719–36.
Rabin, Matthew. 1998. Psychology and Economics. Journal of Economic Literature
36(1): 11–46.
Rozin, Paul, and Edward B. Royzman. 2001. Negativity Bias, Negativity Dominance, and Contagion. Personality and Social Psychology Review 5(4): 296–320. Soroka, Stuart N. 2006. Good News and Bad News: Asymmetric Responses to
Economic Information. Journal of Politics 68(2): 372–85.
Stipak, Brian. 1979. Citizen Satisfaction with Urban Services: Potential Misuse as a Performance Indicator. Public Administration Review 39(1): 46–52.
———. 1980. Local Governments’ Use of Citizen Surveys. Public Administration Review 40(5): 521–25.
Tversky, Amos, and Daniel Kahneman. 1981. Th e Framing of Decisions and the Psychology of Choice. Science 211(4481): 453–58.
Van de Walle, Steven, and Greg G. Van Ryzin. 2011. Th e Order of Questions in a Survey on Citizen Satisfaction with Public Services: Lessons from a Split-Ballot Experiment. Public Administration 89(4): 1436–50.
Van Ryzin, Greg G. 2013. An Experimental Test of the Expectancy-Disconfi rmation Th eory of Citizen Satisfaction. Journal of Policy Analysis and Management 32(3): 597–614.
Van Ryzin, Greg G., Douglas Muzzio, Stephen Immerwahr, Lisa Gulick, and Eve Martinez. 2004. Drivers and Consequences of Citizen Satisfaction: An Application of the American Customer Satisfaction Index Model to New York City. Public Administration Review 64(3): 331–41.
Weaver, R. Kent. 1986. Th e Politics of Blame Avoidance. Journal of Public Policy
6(4): 371–98.