TNP2K
W
ORKING
P
APER
AN INTRODUCTION TO THE INDONESIA FAMILY LIFE
SURVEY (IFLS) EAST 2012:
SAMPLING, QUESTIONNAIRES, MAPS AND
SOCIOECONOMIC BACKGROUND CHARACTERISTICS
ELAN SATRIAWAN, JAN PRIEBE, FIONA HOWELL AND RIZAL ADI PRIMA
TNP2K WORKING PAPER 11a - 2014
AN INTRODUCTION TO THE INDONESIA FAMILY LIFE
SURVEY (IFLS) EAST 2012:
SAMPLING, QUESTIONNAIRES, MAPS AND
SOCIOECONOMIC BACKGROUND CHARACTERISTICS
ELAN SATRIAWAN, JAN PRIEBE, FIONA HOWELL AND RIZAL ADI PRIMA
TNP2K WORKING PAPER 11a - 2014
June 2014
TNP2K Working Paper Series disseminates the findings of work in progress to encourage discussion and exchange of ideas on poverty, social protection and development issues.
Support for this publication has been provided by the Australian Government through the Poverty Reduction Support Facility (PRSF).
The findings, interpretations, and conclusions herein are those of the authors and do not necessarily reflect the views of the Government of Indonesia or the Government of Australia.
You are free to copy, distribute and transmit this work, for noncommercial purposes.
Attribution: Satriawan, E., J. Priebe, F. Howell and R. A. Prima 2014. ‘An Introduction to the Indonesia Family Life Survey (IFLS) East 2012: Sampling, Questionnaires, Maps, and Socioeconomic Background Characteristics’, TNP2K Working Paper 11a-2014. Tim Nasional Percepatan Penanggulangan Kemiskinan (TNP2K), Jakarta, Indonesia.
To request copies of the paper or for more information on the series; please contact the TNP2K - Knowledge Management Unit ([email protected]). Papers are also available on TNP2K’s website.
An Introduction to the Indonesia Family Life Survey (IFLS) East 2012:
Sampling, Questionnaires, Maps, and Socioeconomic
Background Characteristics
Elan Satriawan, Jan Priebe*, and Fiona Howell, Rizal Adi Prima
1June 2014
ABSTRACT
The first round of the Indonesia Family Life Survey (IFLS) East was conducted in Eastern Indonesia in 2012. This paper is intended to provide researchers and policy makers alike an introduction to and brief overview of this new dataset. Topics covered include technical details of survey implementation (sampling procedure, calculation of weights, and field implementation) and a socioeconomic overview using Central Bureau of Statistics (Badan Pusat Statistik or BPS) data and IFLS East data of the prov
-inces selected in the region.
Keywords: IFLS, survey, panel, Indonesia.
* Contact: [email protected] or [email protected]
1 Elan Satriawan is Head of the Monitoring and Evaluation Working Group at TNP2K. Jan Priebe is a senior economist at
TNP2K’s Cluster 1 team. Fiona Howell is the social assistance policy advisor at TNP2K. Rizal Prima is the Evaluation Coor
-dinator (TNP2K).
The authors would like to thank Andrea Andjaringtyas Adhi, Suahasil Nazara, and Sudarno Sumarto for valuable input and comments and Paulina Pankowska, Mercoledi Nikman Nasiir, and Ian Prasetyo for their outstanding research assistance. Special thanks go to SurveyMETER, in particular, to Bondan Sikoki, Ni Wayan Suriastini and Firman Witoelar for providing clarifications as the IFLS East 2012 was implemented.
Table of Contents
Acknowledgements ... viii
1. Introduction ... 1
2. Background information on the IFLS-East ... 2
Sampling Procedure and Selection of Respondents ... 2
Survey Components ... 4
Household, Individual, and Biomarker Weights ... 6
Community and Facility Surveys ... 8
Data Collection Process and Questionnaires ... 8
Provinces in the IFLS East: Socioeconomic Background ... 11
3. Descriptive Statistics from the IFLS East 2012 ... 14
References ... 16
List of Figures
Figure 1: Provinces Selected for the IFLS East 2012 ... 2
Figure 2: Districts Included in the IFLS East 2012... 3
Figure 3: Number of Households Surveyed in IFLS East 2012 by Province ... 4
Figure 4: Number of Individuals Surveyed in IFLS East by Province ... 5
Figure 5: Number of Households Surveyed in IFLS East by District ... 5
Figure 6: Number of Individuals Surveyed in IFLS East by District ... 6
Figure 7: Organizational Structure for the IFLS East 2012 Field Work... 9
Figure A.1: Average Size of Household by Province ... 19
Figure A.2: Average Real per Capita Expenditure by Province ... 19
Figure A.3: Average Years of Schooling of Household Head in IFLS East 2012 by Province ...20
Figure A.4: Dependency Ratio by Province ...20
List of Tables
Table 1: Description of Books in the Household Survey by Questionnaire Type ...10
Table 2: Description of Books in Community and Facility Surveys by Main Book ... 11
Table 3: Basic Statistics by Province ... 13
Table 4: Descriptive Statistics by Province ... 15
Table A.1: Response Rates by Province ... 17
Table A.2: Reasons for Not Responding Survey by Province and Location ... 17
1. Introduction
The Indonesian Family Life Survey (IFLS) East 2012 survey represents the first IFLS that specifi
-cally covers the eastern provinces of Indonesia. The survey was conducted on behalf of the National Team for Acceleration of Poverty Alleviation (Tim Nasional Percepatan Penanggulangan Kemiskinan or TNP2K), Poverty Reduction Support Facility (PRSF), and Australian Aid by SurveyMETER, one of Indonesia’s most prominent survey companies; SurveyMETER worked in the past with the Rand Cor
-poration on implementation of previous IFLS rounds in 2000 and 20072. SurveyMETER’s experience
in conducting previous IFLS rounds helps ensure a high degree of continuity and quality assurance of IFLS East 2012, as similar questionnaires, enumerator training, field implementation procedures, etc., so the IFLS East 2012 dataset is expected to be of similar quality to the established IFLS dataset.
The previous IFLS rounds are known for high-quality panel data and providing a wealth of information on individuals, households, and communities in Indonesia. These data have been used extensively in ac
-ademic research with the objective of facilitating evidence-based policy making. The IFLS East survey was intended to follow this tradition. Although it is the first round of the IFLS East and, therefore, no panel data are yet available, it is already providing researchers and policy makers with information on Eastern Indonesia not available from any other of Indonesia’s major data sources (Riskesdas, Susenas, Sakernas, Podes, Demographic and Health Survey, etc.3). The IFLS East is therefore likely to make a contribution to policy making in the country.
The previous IFLS rounds were conducted in 10 provinces in 1993, 1997, 2000, and 2007. Of the 10 provinces covered in the IFLS, 5 were located in Java and 1 each in Bali, Kalimantan, Nusa Tenggara Barat, Sulawesi, and Sumatra. The IFLS East 2012 covers seven provinces in Eastern Indonesia, none of which (Kalimantan Timur, Nusa Tenggara Timur, Maluku, Maluku Utara, Papua, Papua Barat, and Sulawesi Tenggara) were part of the previous IFLS.
The remainder of this paper is organized as follows: Section 2 provides background information on the IFLS East 2012 (sampling process, calculation of weights, field implementation, and questionnaires) and a basic profile of the IFLS East provinces, as compared with other Indonesian provinces. Section 3 provides some descriptive socioeconomic statistics of key variables and characteristics of the IFLS East 2012 sample. All sections provide maps to better illustrate the IFLS East 2012 for the reader.
2 IFLS 1993 and IFLS 1997 were conducted by the Demographic Institute of the University of Indonesia, together with the
Rand Corporation.
2. Background information on the IFLS-East
Sampling Procedure and Selection of Respondents
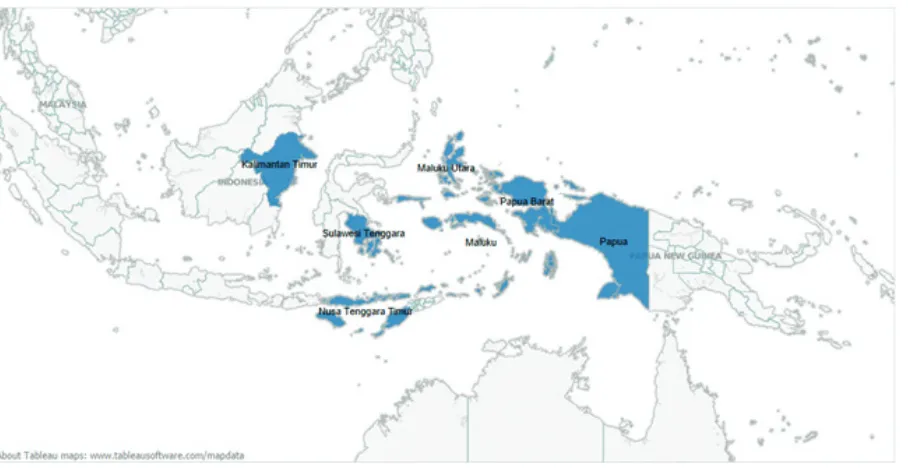
The sampling process of the IFLS East survey had four stages4. The first stage involved selection of seven provinces as follows: one province not included in the previous IFLS rounds was randomly
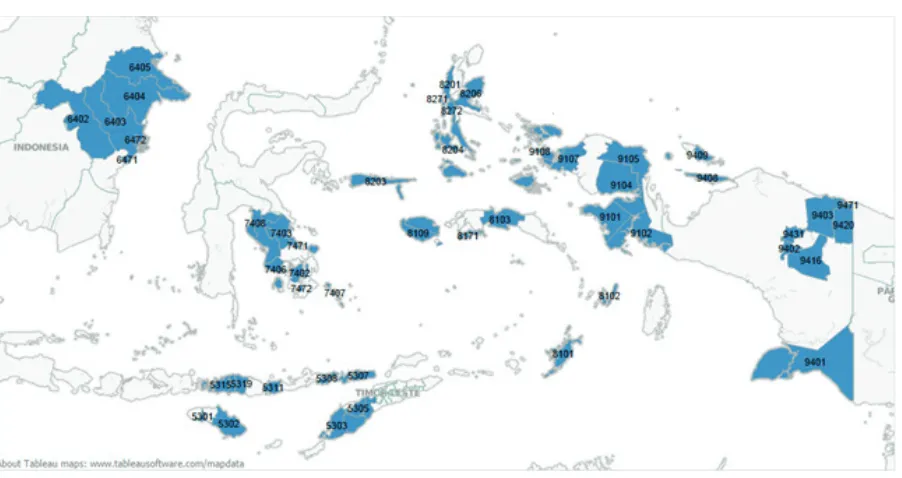
chosen in both Kalimantan and Sulawesi5: Kalimantan Timur (East Kalimantan) and Sulawesi Tengga -ra (Southeast Sulawesi). The remaining five provinces—Nusa Tengga-ra Timur (East Nusa Tengga-ra), Maluku, Maluku Utara (North Maluku), Papua, and Papua Barat (West Papua)—were selected without sampling. Figure 1 presents the geographic position of those provinces in Indonesia. Figure 2 shows the districts included in IFLS East 2012.
Figure 1: Provinces Selected for the IFLS East 2012
Source: Derived by the authors based on IFLS East 2012 data.
4 This chapter draws largely on SurveyMETER (2012) and Sikoki et al. (2014). The authors recommend that readers check the
IFLS East website http://surveymeter.org/research/3/the-indonesia-family-life-survey-east-ifls-east for the latest and updated version of these documents.
Figure 2: Districts Included in the IFLS East 2012
Source: Derived by the authors based on IFLS East 2012 data.
Note: The four-digit district codes from the Central Bureau of Statistics (Badan Pusat Statistik or BPS) were added to the map to permit identification of specific districts. See table A.3 in the appendix for a list of all districts per province included in the IFLS East 2012 survey.
In the second stage, 14 villages, defined as either rural or urban (respectively, desa or kelurahan), were
randomly selected from those villages included in the July 2010 round of Susenas in each of the seven provinces. The sampling frame for the selection of villages was based on those villages included from the Susenas July 2010 round. As a first step, all the villages in the SUSENAS July 2010 survey belonging to the aforementioned provinces have been listed and then 14 were drawn from each province without replacement and with equal probability of being selected. Thus, the sampling frame6 for the villages was
based on the list of villages available in SUSENAS July 2010 rather than on all the villages in the prov
-inces.
In the third stage, enumerators visited the selected villages in order to identify a geographic unit level roughly comparable in population size to the census block level. This process led to the creation of units called the ‘smallest local area unit’ (satuan lingkungan setempat or SLS) by SurveyMETER, which were
sometimes further grouped (in the case of very small size, that is, fewer than 100 households) with other geographically adjacent SLSs. This resulted in having either one or a number of SLS groups in each vil
-lage. After having created and grouped the units, one SLS group was randomly chosen from each vil-lage.
In the fourth stage, the enumerators visited the selected SLS groups in each of the villages and compiled a household listing by visiting each of the households in the chosen SLS groups. Then, for each village and, hence, each SLS group, a simple random sample of 20 (urban) or 30 households (rural) was drawn from the listing7.
6 In Papua, where some villages had to be dropped due to security concerns, remoteness, or inaccessibility, it was necessary to
select replacement villages. In addition, leaders in one village drawn into the sample refused to participate in the Community and Facility Survey. Thus, to compensate for this, a replacement village (in both the Household and Community and Facility Surveys) was added, resulting in a total of 15, not 14, villages selected in Papua.
Survey Components
IFLS East 2012 consisted of two components, a Household Survey and a Community and Facility Survey. The Household Survey included, depending on the specific questionnaire module, questions for each individual of the household or for the household head, mother, etc., whereas the Community and Facility Survey consisted of interviews with village officers, community leaders, and educational and health officers in the corresponding villages. Overall, in the Household Survey, 3,159 households (spread across 99 villages) were selected; the total number of households providing at least a partial interview totalled 2,547; the household response rate was 80.6%8. The 2,547 respondent households jointly had 10,887 household members, of which 10,759 (98.8%) gave at least a partial interview and 9,929 (91.2%) were measured in the biomarker module9. For the number of households and individuals surveyed by province and district, see Figures 3 to 610.
Figure 3: Number of Households Surveyed in IFLS East 2012 by Province
Source: Derived by the authors based on IFLS East 2012 data.
8 See Tables A.1 and A.2 in the appendix for response rates by province and reasons for nonresponse. 9 The biomarker module collected information on anthropometric and health outcomes.
Figure 4: Number of Individuals Surveyed in IFLS East by Province
Source: Derived by the authors based on IFLS East 2012 data.
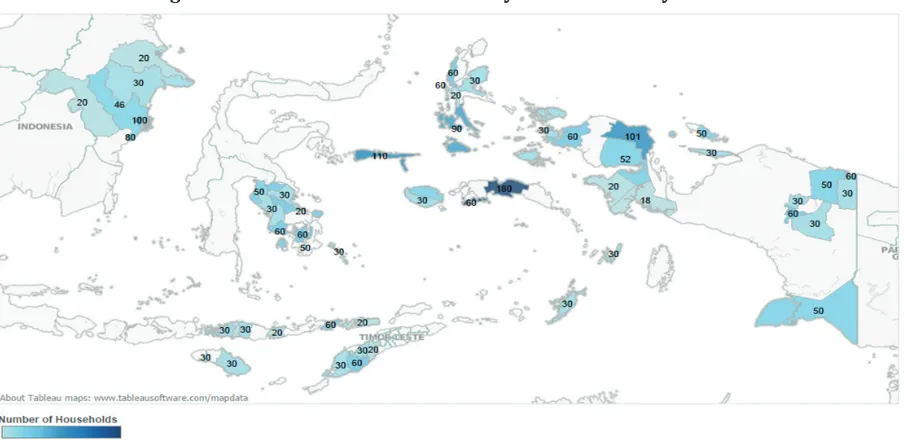
Figure 5: Number of Households Surveyed in IFLS East by District
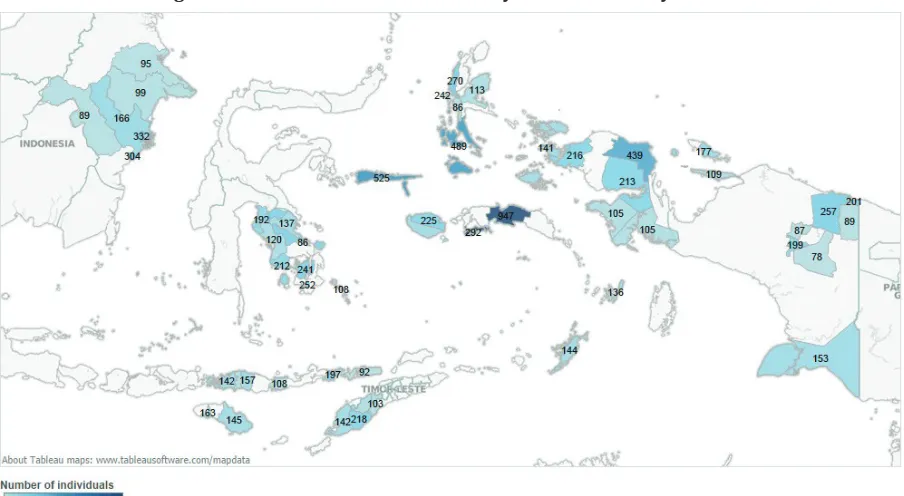
Figure 6: Number of Individuals Surveyed in IFLS East by District
Source: Derived by the authors based on IFLS East 2012 data.
In line with previous IFLS rounds, all members of the selected households were surveyed. If a house
-hold member was not able to respond due to health, cognitive, or other reasons, a proxy interview was conducted with an informant, typically another household member. Furthermore, children under 15 years old were not interviewed themselves; instead, their parents were interviewed about them. All household members were eligible for the biomarker data collection.
The collected data comprise various indicators of the households’ economic situation and social wel
-fare (approximated using household expenditure), their income, and assets. The survey also provides information on labour participation of household members, their education levels, migration patterns, health conditions, use of health-care services, possession and use of health insurance, marital status and history, pregnancy, use of contraception, characteristics of decision making processes, and participation in the community.
Household, Individual, and Biomarker Weights
To permit a sample that is representative of Eastern Indonesia, three different kinds of weights were constructed: household, individual, and biomarker. Sampling in the IFLS East 2012 was stratified by province, with all computations done separately by province. When calculating the weight of the first group (i.e., households), the basic principle adopted was that the weight of a household is inversely proportional to the probability of the household being chosen and thus can be defined as
where indicates the weight of the household, indicates a constant and indicates the probability of the household being chosen11. The probability is equal to
where is the probability that the village was included in the Susenas 2010 sample; is the probability that the village has been included in the IFLS East sample, given that it was in
-cluded in the Susenas 2010 sample; is the probability that the SLS group has been included in the IFLS East sample, given that the village was included (this is the reciprocal of the number of SLS groups in the village); and is the probability that the household was included in the IFLS East sam
-ple, given that the SLS group was included (this equals the number of households in the SLS group in the sample divided by the number of households in the SLS group in the population).
The individual weights were calculated in a similar manner to the one described above; the underlying principle, once more, was that the individual’s weight is inversely proportional to the probability of the individual being included in the sample. Likewise, the formula for this principle is
where is the individual weight, a constant, and is the probability that the individual is in the sample. The formula for the probability has a very similar form to the household weights formu
-la described above; the only difference is that the reference group comprises individuals, rather than households.
In addition, biomarker weights were constructed to use when analysing biomarker data. Two main motives lie behind the use of this distinct category of weights, rather than the individual one described above. First, the fraction of individuals for which there are biomarker data conditional on their house
-hold participating is a bit lower than for the overall sample. Second, the variation across individual characteristics in this subset of the data is somewhat larger than for the overall sample. To calculate the weights, a logit model estimating the probability of participating in the biomarker module (based on various characteristics such as age, gender, marital status, or province) was used. Namely, the predicted probability of the logit model (defined as the value ) was inserted into the following formula, which estimates the weights:
where is the biomarker weight, the household weight, and the predicted probability).
11 The calculations used to obtain the probability of a household being selected in the survey, that is, were based on the
Community and Facility Surveys
In addition to the Household Survey, the IFLS East survey also includes a Community and Facility Survey. In this survey, for each of the 99 villages (corresponding to 99 SLS groups), those health and educational institutions and facilities most frequently mentioned by surveyed households were visited and their staff interviewed. From the remaining facilities available in the area, additional persons were randomly selected for interviews12. The visited health institutions included health centers (puskesmas),
auxiliary mobile health centers (puskesmas pembantu or pustu), as well as private health practices
(i.e., clinics, doctors, midwives (bidan), village midwives, and health posts (posyandu), and the visited
educational institutions consisted of primary schools (sekolah dasar or SD), middle schools (sekolah menengah pertama or SMP), and high schools (sekolah menengah atas or SMA). Furthermore, the
Community and Facility Surveys were complemented by interviews with community leaders and health officers. The village heads and staff were interviewed for information on the socioeconomic condition of the households in the community and availability and accessibility of educational and health facilities in their communities.
Data Collection Process and Questionnaires
The data collection process took place from 17 May to 21 July 2012, organized as follows: the house
-hold teams consisted of 1 local supervisor, 5 to 11 interviewers, and 2 editors; at least 3 of the interview
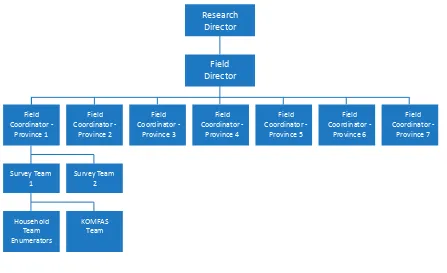
-ers were specifically trained in measuring health outcomes. The community and facility (komunitas fasilitas or KOMFAS) teams comprised about 4 enumerators and 1 person responsible for data editing. Two survey teams operated in each province; each survey team consisted of a household team and a KOMFAS team, except for Papua and Papua Barat, where 4 and 3 teams, respectively, were used. The 2 survey teams per province were supervised by a province-specific field coordinator (7 in all), while all field coordinators were supervised by a field director, who was in turn supervised by SurveyMETER research directors.
12 A list of all health and educational facilities mentioned by households can be found in the List of Existing Facilities (Daftar
Figure 7: Organizational Structure for the IFLS East 2012 Field Work
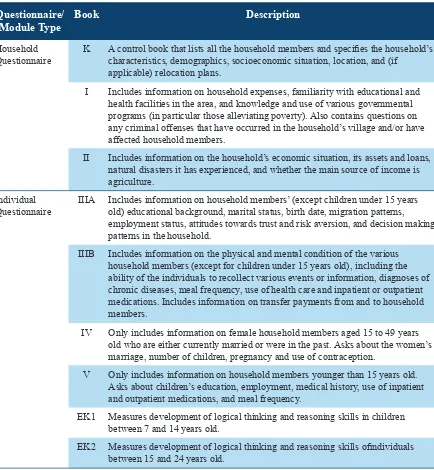
The ILFS East 2012 uses a standardized list of questions (which is seen as an improvement compared with previously used questionnaires in previous IFLS rounds). The questionnaire consists of several books containing different sections (Table 1 provides details). The household component of the survey consists of Books K, I, and II, which served as the basis for interviewing household heads or, in case of their absence, their spouses; therefore, these books include household-level questionnaires. In contrast, Books IIIA, IIIB, IV, V, Ek1, and Ek2 served as the basis for interviewing individual household mem
-bers; therefore, these books included individual-level questionnaires.
Table 1: Description of Books in the Household Survey by Questionnaire Type
Questionnaire/ Module Type
Book Description
Household
Questionnaire K A control book that lists all the household members and specifies the household’s characteristics, demographics, socioeconomic situation, location, and (if applicable) relocation plans.
I Includes information on household expenses, familiarity with educational and
health facilities in the area, and knowledge and use of various governmental programs (in particular those alleviating poverty). Also contains questions on any criminal offenses that have occurred in the household’s village and/or have affected household members.
II Includes information on the household’s economic situation, its assets and loans,
natural disasters it has experienced, and whether the main source of income is agriculture.
Individual
Questionnaire IIIA Includes information on household members’ (except children under 15 years old) educational background, marital status, birth date, migration patterns, employment status, attitudes towards trust and risk aversion, and decision making patterns in the household.
IIIB Includes information on the physical and mental condition of the various
household members (except for children under 15 years old), including the ability of the individuals to recollect various events or information, diagnoses of chronic diseases, meal frequency, use of health care and inpatient or outpatient medications. Includes information on transfer payments from and to household members.
IV Only includes information on female household members aged 15 to 49 years
old who are either currently married or were in the past. Asks about the women’s marriage, number of children, pregnancy and use of contraception.
V Only includes information on household members younger than 15 years old.
Asks about children’s education, employment, medical history, use of inpatient and outpatient medications, and meal frequency.
EK1 Measures development of logical thinking and reasoning skills in children
between 7 and 14 years old.
EK2 Measures development of logical thinking and reasoning skills ofindividuals
between 15 and 24 years old.
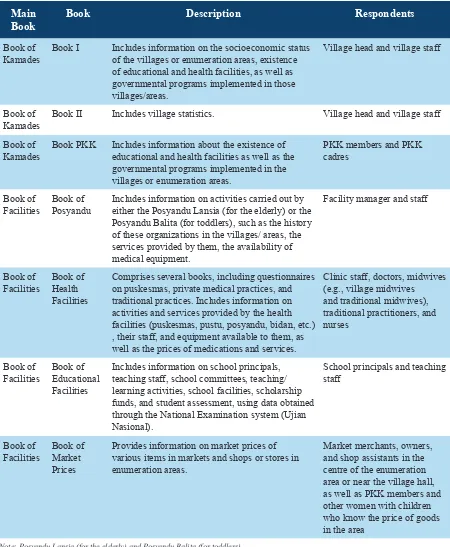
The Community and Facility Survey includes two main books, the Book of Characteristics of the Vil
-lage Population (Karakteristik masyarakat desa or Kamades) and the Book of Facilities, both compris
-ing several modules. The Book of Kamades consists of Books I, II, and Family Welfare Development
(Pemberdayaan dan Kesejahteraan Keluarga or PKK), and the Book of Facilities consists of the Books
Table 2: Description of Books in Community and Facility Surveys by Main Book
Main Book
Book Description Respondents
Book of
Kamades Book I Includes information on the socioeconomic status of the villages or enumeration areas, existence of educational and health facilities, as well as governmental programs implemented in those villages/areas.
Village head and village staff
Book of
Kamades Book II Includes village statistics. Village head and village staff Book of
Kamades Book PKK Includes information about the existence of educational and health facilities as well as the governmental programs implemented in the villages or enumeration areas.
PKK members and PKK cadres
Book of
Facilities Book of Posyandu Includes information on activities carried out by either the Posyandu Lansia (for the elderly) or the Posyandu Balita (for toddlers), such as the history of these organizations in the villages/ areas, the services provided by them, the availability of medical equipment.
Facility manager and staff
Book of
Facilities Book of Health Facilities
Comprises several books, including questionnaires on puskesmas, private medical practices, and traditional practices. Includes information on activities and services provided by the health facilities (puskesmas, pustu, posyandu, bidan, etc.) , their staff, and equipment available to them, as well as the prices of medications and services.
Clinic staff, doctors, midwives
Facilities Book of Educational Facilities
Includes information on school principals, teaching staff, school committees, teaching/ learning activities, school facilities, scholarship funds, and student assessment, using data obtained through the National Examination system (Ujian Nasional).
School principals and teaching staff
Book of
Facilities Book of Market Prices
Provides information on market prices of various items in markets and shops or stores in enumeration areas.
Market merchants, owners, and shop assistants in the centre of the enumeration area or near the village hall, as well as PKK members and other women with children who know the price of goods in the area
Note: Posyandu Lansia (for the elderly) and Posyandu Balita (for toddlers).
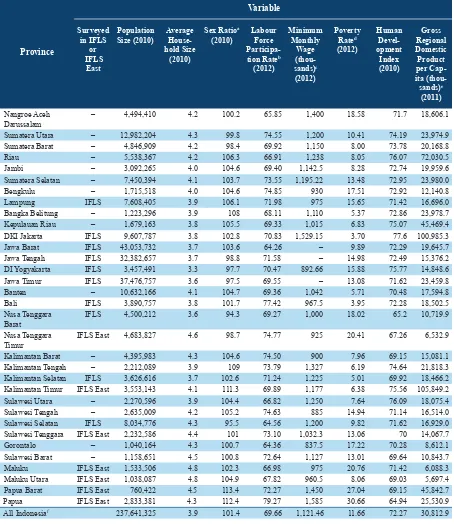
Provinces in the IFLS East: Socioeconomic Background
To get a better idea of the extent to which the IFLS East provinces differ from other provinces in Indo
-vides basic descriptive statistics on some key development indicators in the 33 Indonesian provinces in
201213.
As Table 3 shows, the provinces included in IFLS East 2012 (i.e., Kalimantan Timur, Nusa Tenggara Timur, Maluku, Maluku Utara, Papua, Papua Barat, and Sulawesi Tenggara) are among the least pop
-ulated in the country; their populations total 14,402,366 individuals, accounting for slightly more than 6% of the entire Indonesian population. The average household size in those provinces, which varies from 4.1 to 4.8, is higher than the country’s average of 3.9. The eastern provinces (except for Nusa Tenggara Timur) are characterized by a sex ratio higher than 100, indicating that the number of males in the population exceeds that of females14. This aligns with the national average and most of the re
-maining provinces.
Labour market participation rates in IFLS East 2012 provinces are, in most cases (except for Maluku and Maluku Utara), higher than the national average (Table 3). At the same time, the minimum wages reported for IFLS East provinces are lower than the Indonesian mean in 4 of 7 cases: The four provinces of Maluku, Maluku Utara; Nusa Tenggara Timur, and Sulawesi Tenggara are all characterized by lower than average minimum wages, whereas Kalimantan Timur, Papua, and Papua Barat are characterized by higher minimum wages than the national average (the figures for Papua and Papua Barat substantially higher than for Kalimantan Timur15).
Maluku is characterized by a rather high poverty rate, while poverty in Sulawesi Tenggara is only slight
-ly higher compared with the national average. The on-ly two eastern provinces with lower-than-average poverty rates are Kalimantan Timur and Maluku Utara; the latter has one of the lowest poverty rates in Indonesia.
The human development index largely corresponds to the poverty rates. Those provinces (except for Maluku Utara) characterized by higher-than-average poverty rates have lower-than-average human de
-velopment index levels (Table 3). Overall, the human de-velopment indices are not substantially lower (or, in the case of Kalimantan Timur, higher) than those of the remaining provinces and the national average.
Gross regional domestic product per capita levels rank relatively low in most eastern provinces com
-pared with other Indonesian provinces. Four provinces—Nusa Tenggara Timur, Maluku, Maluku Utara, and Sulawesi Tenggara—have per capita gross regional domestic products that are less than half the national average (Table 3). The value reported for Papua also falls below the Indonesian average, albeit not as much. Only the numbers reported in Kalimantan Timur and Papua Barat are higher than the av
-erage of the remaining provinces; the former is considerable, as it is more than three times higher than the country’s average.
13 At the time of the survey, there were 33 provinces in Indonesia. In 2013, the 34th province of North Kalimantan was es -tablished.
14 Sex ratio is defined as the number of males over the number of females, times 100.
Table 3: Basic Statistics by Province
Darussalam – 4,494,410 4.2 100.2 65.85 1,400 18.58 71.7 18,606.1
Sumatera Utara – 12,982,204 4.3 99.8 74.55 1,200 10.41 74.19 23,974.9
Sumatera Barat – 4,846,909 4.2 98.4 69.92 1,150 8.00 73.78 20,168.8
Riau – 5,538,367 4.2 106.3 66.91 1,238 8.05 76.07 72,030.5
Jambi – 3,092,265 4.0 104.6 69.40 1,142.5 8.28 72.74 19,959.6
Sumatera Selatan – 7,450,394 4.1 103.7 73.55 1,195.22 13.48 72.95 23,980.0
Bengkulu – 1,715,518 4.0 104.6 74.85 930 17.51 72.92 12,140.8
Lampung IFLS 7,608,405 3.9 106.1 71.98 975 15.65 71.42 16,696.0
Bangka Belitung – 1,223,296 3.9 108 68.11 1,110 5.37 72.86 23,978.7
Kepulauan Riau – 1,679,163 3.8 105.5 69.33 1,015 6.83 75.07 45,469.4
DKI Jakarta IFLS 9,607,787 3.8 102.8 70.83 1,529.15 3.70 77.6 100,985.3
Jawa Barat IFLS 43,053,732 3.7 103.6 64.26 – 9.89 72.29 19,645.7
Jawa Tengah IFLS 32,382,657 3.7 98.8 71.58 – 14.98 72.49 15,376.2
DI Yogyakarta IFLS 3,457,491 3.3 97.7 70.47 892.66 15.88 75.77 14,848.6
Jawa Timur IFLS 37,476,757 3.6 97.5 69.55 – 13.08 71.62 23,459.8
Banten – 10,632,166 4.1 104.7 69.36 1,042 5.71 70.48 17,594.8
Bali IFLS 3,890,757 3.8 101.7 77.42 967.5 3.95 72.28 18,502.5
Nusa Tenggara
Barat IFLS 4,500,212 3.6 94.3 69.27 1,000 18.02 65.2 10,719.9
Nusa Tenggara
Timur IFLS East 4,683,827 4.6 98.7 74.77 925 20.41 67.26 6,532.9
Kalimantan Barat – 4,395,983 4.3 104.6 74.50 900 7.96 69.15 15,081.1
Kalimantan Tengah – 2,212,089 3.9 109 73.79 1,327 6.19 74.64 21,818.3
Kalimantan Selatan IFLS 3,626,616 3.7 102.6 71.24 1,225 5.01 69.92 18,466.2
Kalimantan Timur IFLS East 3,553,143 4.1 111.3 69.89 1,177 6.38 75.56 105,849.2
Sulawesi Utara – 2,270,596 3.9 104.4 66.82 1,250 7.64 76.09 18,075.4
Sulawesi Tengah – 2,635,009 4.2 105.2 74.63 885 14.94 71.14 16,514.0
Sulawesi Selatan IFLS 8,034,776 4.3 95.5 64.56 1,200 9.82 71.62 16,929.0
Sulawesi Tenggara IFLS East 2,232,586 4.4 101 73.10 1,032.3 13.06 70 14,067.7
Gorontalo – 1,040,164 4.3 100.7 64.36 837.5 17.22 70.28 8,612.1
Sulawesi Barat – 1,158,651 4.5 100.8 72.64 1,127 13.01 69.64 10,843.7
Maluku IFLS East 1,533,506 4.8 102.3 66.98 975 20.76 71.42 6,088.3
Maluku Utara IFLS East 1,038,087 4.8 104.9 67.82 960.5 8.06 69.03 5,697.4
Papua Barat IFLS East 760,422 4.5 113.4 72.27 1,450 27.04 69.15 45,842.7
Papua IFLS East 2,833,381 4.3 112.4 79.27 1,585 30.66 64.94 25,530.9
All Indonesiaf 237,641,325 3.9 101.4 69.66 1,121.46 11.66 72.27 30,812.9
Source: BPS (2012) and the BPS website (www.bps.go.id)
a Defined as number of males over the number of females, times 100.
b Defined as the number of individuals older than 15 years considered to be in the labour force, divided by the national number of individuals older than 15 years. The labour force itself is defined as those who are working (i.e., those who are working for at least one hour in the past week and those who already have a job but are temporarily not working in the past week) and those who are unemployed (i.e., those who are currently looking for work; those who are preparing for job initiation; those who are currently unable to find job; and those
who have already accepted a job but have not started working yet). c Expressed in current currency.
d Defined (by the government) as the rate of people who have per capita expenditures below the minimum per capita expenditure needed in
the region to attain the basic living needs.
e The compulsory minimum wage rate paid differs by region.
3. Descriptive Statistics from the IFLS East 2012
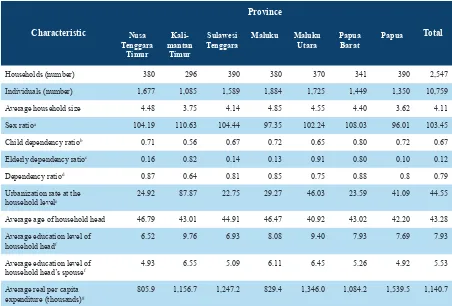
To allow for better understanding of IFLS East 2012, Table 4 presents a range of statistics summarizing the sample collected in IFLS East 201216. Statistics are presented for both the sample and each of the
seven eastern provinces under consideration. Several inferences on the overall sample and provincial subsamples can be made when analysing the table.
First, the number of sampled individuals and households does not greatly differ among the provinces. Overall, the number of individuals surveyed ranges from 1,085 in Kalimantan Timur to 1,884 in Ma
-luku, while the number of households surveyed ranges from 296 in Kalimantan Timur to 390 in both Sulawesi Tenggara and Papua.
Second, some differences exist in the average household size in each of the seven provinces. The lowest mean household size is recorded in Papua (3.62), whereas the highest is in Maluku (4.85); the mean household size for the entire IFLS East is 4.11.
Third, the levels of the sex ratios indicate more males than females in most of the seven provinces (ex
-cept for Maluku and Papua). Overall, the sex ratios vary from 96.01 percent in Papua to 110.63 percent in Kalimantan Timur; the overall sample average is 103.45 percent.
Fourth, the total dependency ratio varies somewhat more among the different IFLS East provinces than the household size and sex rations do. The lowest dependency ratio is reported for Kalimantan Timur (63.65 percent) and the highest for Papua Barat (88.29 percent). The dependency ratio for the entire sample is 79 percent, indicating that, in both the entire population and each of the provinces, there are many more individuals in productive ages than elderly and children combined. When looking at the two components in the total dependency ratio, that is, child dependency ratio and elderly dependency ratio, the former is much higher than the latter for each of the seven provinces. Overall, the entire sample’s child dependency ratio equals 67.22 percent, whereas the elderly dependency ratio is 11.78 percent.
Fifth, the urban population rates, disaggregated both at the individual and household levels, indicate that in almost all provinces (except for Kalimantan Timur), the vast majority of the population/ house
-holds live in rural areas. Except for Kalimantan Timur, the urbanization rate on the individual level var
-ies between 22.29 percent (Sulawesi Tenggara) and 41.99 percent (in Maluku Utara); on the household level, the rate ranges from 22.75 percent to 46.03 percent (in the corresponding provinces). In addition, household head age and education levels (expressed through years of schooling completed) do not show substantial variation among the different provinces. The average age of the household head in the entire sample is 43.28 years, while the provincial means range from 40.92 to 46.79. The sample’s mean number of years of schooling of the household head equals 7.93. Kalimantan Timur is the province with the highest education level with a mean of 9.76 years and Nusa Tenggara Timur the lowest with a mean of 6.52 years.
16 See figures A.1 to A.5 in the appendix for maps illustrating these statistics at the provincial and district levels (for all prov
Sixth, the expenditure levels reported for each of the provinces (expressed as the real per capita monthly expenditure levels) show substantial differences. For instance, the mean expenditure level reported for Nusa Tenggara Timur (Rp. 805,900, the lowest value of all provincial averages) is only slightly more than half the mean expenditure level reported for Papua (Rp. 1,539,500, the highest value of all provin
-cial averages).
Table 4: Descriptive Statistics by Province
Characteristic
Households (number) 380 296 390 380 370 341 390 2,547
Individuals (number) 1,677 1,085 1,589 1,884 1,725 1,449 1,350 10,759
Average household size 4.48 3.75 4.14 4.85 4.55 4.40 3.62 4.11
Sex ratioa 104.19 110.63 104.44 97.35 102.24 108.03 96.01 103.45
Child dependency ratiob 0.71 0.56 0.67 0.72 0.65 0.80 0.72 0.67
Elderly dependency ratioc 0.16 0.82 0.14 0.13 0.91 0.80 0.10 0.12
Dependency ratiod 0.87 0.64 0.81 0.85 0.75 0.88 0.8 0.79
Urbanization rate at the household levele
24.92 87.87 22.75 29.27 46.03 23.59 41.09 44.55
Average age of household head 46.79 43.01 44.91 46.47 40.92 43.02 42.20 43.28
Average education level of
household headf 6.52 9.76 6.93 8.08 9.40 7.93 7.69 7.93
Average education level of
household head’s spousef 4.93 6.55 5.09 6.11 6.45 5.26 4.92 5.53
Average real per capita
expenditure (thousands)g 805.9 1,156.7 1,247.2 829.4 1,346.0 1,084.2 1,539.5 1,140.7
Source: IFLS East 2012
Notes: All statistics are weighted using the respective household or individual survey weights.
a Defined as the number of males divided by the number of females times 100.
b Defined as the number of children (individuals below 15 years of age) divided by the number of individuals in the working age (aged 15 to
64 years old)
c Defined as the number of elderly (i.e., individuals older than 64 years of age) divided by the number of individuals in the working age (aged 15 to 64 years old)
d Defined as the number of both children and elderly divided by the number of individuals in the working age (aged 15 to 64 years old) e Defined as the percentage of urban households among all households
f Approximated using the years of schooling of the household head
References
BPS (Badan Pusat Statistik). 2012. STATISTIK INDONESIA: Statistical Yearbook of Indonesia 2012. Jakarta, Indonesia.
Sikoki, B., F. Witoelar, J. Strauss, E. Meijer, and N.W. Suriastini. 2014. Indonesia Family Life Survey East: Study Design and Field Report. Yogyakarta: SurveyMETER.
Appendix
Table A.1: Response Rates by Province
Province Household Response
Nusa Tenggara Timur 85.0 99.2 95.9
Kalimantan Timur 73.8 97.5 90.8
Table A.2: Reasons for Not Responding Survey by Province and Location
Province
Nusa Tenggara Timur 3.1 1.7 9.4 3.1 9.4 4.2
Kalimantan Timur 0.0 3.0 6.1 5.4 15.5 8.7
Sulawesi Tenggara 6.6 3.2 3.2 12.5 15.6 9.4
Maluku 9.6 4.5 0.8 9.7 10.7 1.9
Maluku Utara 6.0 4.8 6.7 4.0 10.1 12.1
Papua Barat 4.8 7.0 5.4 1.1 2.2 6.7
Papua 7.2 7.8 4.0 13.2 17.4 3.6
Table A.3: Districts by Province
Maluku Maluku Utara Papua Barat Papua
5301 Sumba
Barat 6402 Kutai Barat 7402 Muna 8101 Maluku Tenggara
Barat
8201 Halmahera
Barat 9101 Fakfak 9401 Merauke
5302 Sumba
Timur 6403 Kutai Kartanegara - 7403 Konawe 8102 Maluku Tenggara 8203 Kepulauan Sula 9102 Kaimana 9402 Kab. Jayapura
5303 Kupang 6404 Kutai
Timur 7404 Kolaka 8103 Maluku Tengah 8204 Halmahera Selatan 9104 Teluk Bintuni 9403 Jayawijaya 5304 Timur
Tengah Selatan
6405 Berau 7406 Bombana 8104 Buru 8206 Halmahera
Timur 9105 Manokwari 9408 Kepulauan Yapen
5305 Timur Tengah Utara
6471 Balikpapan 7407 Wakatobi 8109 Buru
Selatan 8271 Ternate 9107 Kab. Sorong - 9409 Biak Numfor
5306 Belu 6472 Samarinda 7408 Kolaka
Utara 8171 Ambon 8272 Tidore Kepulauan 9108 Raja Ampat 9416 Yahukimo
5307 Alor 7410 Konawe
Utara 9171 Sorong 9420 Keerom
5308 Lembata 7471 Kendari 9431 Mambera
-mo Tengah
5311 Ende 7472 Bau-Bau 9471 Jayapura
5313 Manggarai 5319 Manggarai
Timur
Figure A.1: Average Size of Household by Province
Source:Derived from author calculations based on IFLS East 2012.
Figure A.2: Average Real per Capita Expenditure by Province
Figure A.3: Average Years of Schooling of Household Head in IFLS East 2012 by Province
Source: Derived from author calculations based on IFLS East 2012.
Figure A.4: Dependency Ratio by Province
Figure A.5: Urbanization Ratio by Province
The first round of the Indonesia Family Life Survey (IFLS) East was conducted in Eastern Indonesia in 2012. This paper is intended to provide researchers and policy makers alike an introduction to and
brief overview of this new dataset. Topics covered include technical details of survey implementa
-tion (sampling procedure, calcula-tion of weights, and field implementa-tion) and a socioeconomic overview using Central Bureau of Statistics (Badan Pusat Statistik or BPS) data and IFLS East data of the provinces selected in the region.
TIM NASIONAL PERCEPATAN PENANGGULANGAN KEMISKINAN (TNP2K)
Jl. Kebon Sirih No. 35, Jakarta Pusat 10110
Tel: +62 (0) 21 391 2812
Fax: +62 (0) 21 391 2511
E-mail: [email protected]