DISCLOSURE APPENDIX AT THE BACK OF THIS REPORT CONTAINS IMPORTANT DISCLOSURES, ANALYST
CERTIFICATIONS, AND THE STATUS OF NON-US ANALYSTS. US Disclosure: Credit Suisse does and seeks to do
business with companies covered in its research reports. As a result, investors should be aware that the Firm may have a conflict of interest that could affect the objectivity of this report. Investors should consider this report as only a single factor in making their investment decision.
15 January 2016 Asia Pacific
Equity Research
Healthcare
ASEAN Hospitals Sector
SECTOR REVIEW'Defensive growth'
–
a myth?
Figure 1: Consensus EPS revisions (% change) (FY16E)
-1 2
-8
-5 -4
-24 0 1
3
-12 1
-3
-5 -5
-13 -4
-30 -25 -20 -15 -10 -5 0 5 10
IHH KPJ BDMS BH BCH CHG Raffles Siloam Mitra
3M 6M
Source: Bloomberg
■ History suggests 'defensive growth' mostly a myth. 'Defensive growth' is one of the key reasons investors cite for the premium valuations enjoyed by the healthcare sector. Yet, our analysis of history suggests this is mostly a myth: (1) Organic healthcare demand appears to be neither uncorrelated nor less volatile than overall economic growth; (2) reported earnings of private players are more volatile and in line with economic cycles than perceived; and (3) hospital stocks appear to be more resilient during initial stages of an economic downturn, but eventually prove to be less resilient.
■ Is this cycle 'different' or are we setting up for disappointment? There are two key differences this cycle: (1) The pace of capacity expansion by ASEAN players is unprecedented and (2) stocks have already outperformed significantly and are trading at premium valuations going into this economic downturn. But signs of organic growth weakness are evident now—most ASEAN hospitals have seen consensus EPS cuts over the past few months. With stock prices continuing to outperform, we are potentially setting up for disappointment with stocks more reliant on underlying macro.
■ How to play this cycle? IHH & BDMS top picks. We look for stocks with following characteristics: (1) more resilient organic growth drivers (right segments / geographies); (2) strong expansion pipeline / track record; and (3) cheaper relative valuations. Our stock recommendations with a better risk-reward profile: IHH (one of the best structural growth stories), BDMS
(attractive pipeline and track record), Raffles Medical (expansion plans in Singapore / China) and Siloam (best play on Indonesia macro story). Research Analysts
Focus charts
Figure 2: H'care expenditure versus nominal GDP growth—
10-year CAGR (%) – better growth over longer periods…
Figure 3: US—total h'care expenditure YoY versus GDP growth YoY (%) –…but not uncorrelated to overall macro
18.5
1961 1966 1971 1976 1981 1986 1991 1996 2001 2006 2011 US Total Health Exp. (YoY%) US Nom. GDP growth (YoY%)
Figure 4: Quarterly patient volume growth (YoY%)—in the current cycle, organic demand losing momentum...
Figure 5:…driving a top-line growth (YoY%) slowdown across markets
IHH SG IHH MY KPJ BDMS BH BCH CHG Siloam 1Q15 2Q15 3Q15
IHH KPJ BDMS BH BCH CHG Raffles Siloam Mitra
1Q15 2Q15 3Q15
Figure 6: EV/EBITDA (x)—despite earnings volatility, hospital stocks continue to re-rate
Figure 7: 1Y absolute / relative price performance (%)— ASEAN hospital stocks have outperformed significantly
20 19
IHH KPJ BDMS BH BCH CHG Raffles Siloam Mitra 2013 2014 2015
IHH KPJ BDMS BH BCH CHG Raffles Siloam 1Y absolute Relative to market
Defensive growth
–
a myth?
'Defensive growth' is one of the key reasons investors cite for the premium valuations enjoyed by the healthcare sector. In this report, we explore whether this assumption holds true through historical periods of economic slowdown.
Healthcare demand not immune to economic slowdown
Through cycle the long-term growth of healthcare demand appears to outperform the overall economy. However, to be termed 'defensive growth', the healthcare sector needs to either show a low correlation to the overall macroeconomic growth or display less volatile demand characteristics. We fail to see both these characteristics looking at the historical healthcare expenditure growth across countries. Some countries do show more defensiveness than others, mostly due to structural differences. Looking at the historical correlation between nominal GDP growth and private healthcare expenditure growth over the past 20 years, we find a high correlation in most countries. We find that income growth in general explains the volatility in healthcare demand. But surprisingly, the volatility in healthcare demand appears to be more accentuated by changes in income growth and healthcare demand seemingly recovering only with a lag. A look at the healthcare demand characteristics in the US over several decades displays similar characteristics. ASEAN hospitals in general have seen a general slowdown in demand growth so far this year.
Stock performance more defensive than underlying earnings
From an investor perspective, what is probably more important is the impact of macro slowdown on earnings and stock price performance of private healthcare operators. Reported earnings of private players historically appear to be more volatile than expected and more correlated to economic growth through cycles, barring very few exceptions. Most hospitals in our universe have seen consensus EPS cuts over the past few months. The absolute stock price performance appears to be lot more correlated to the overall economic growth than you would expect for a defensive sector.
Interestingly, hospital stocks appear to be more resilient during initial stages of an economic downturn and then eventually tend to follow suit in line with economic growth trends. Almost all hospital stocks in our coverage have massively outperformed their local markets, mainly driven by investor perception of 'defensiveness'. Historically, hospital stock valuations appear to be more correlated to economic cycles than not. Valuation multiples for almost all hospitals stocks in our universe have expanded over the past two years—despite a clearly mixed scorecard in terms in earnings delivery.
How to play the current macro slowdown?
We find two key differences this cycle: (1) The level of capacity expansion by private players across ASEAN is unprecedented and is probably the biggest difference compared to previous cycles; and (2) another key difference from a stock performance perspective is the already expensive valuations (both absolute and relative). We look at three key stock price/valuation drivers to screen sectors/stocks that could prove to be defensive this cycle: (1) more resilient organic growth drivers, (2) strong capacity expansion pipeline and delivery and (3) cheaper relative valuations. Key stock recommendations:
IHH Healthcare: With a good track record of regional expansion and attractive optionalities in India and China, IHH is one of the best structural stories in ASEAN.
BDMS: Attractive medium-term growth potential through greenfield expansion and M&A supported by a strong execution track record.
Raffles Medical: Expansion plans in Singapore and China have significantly improved the medium-term growth and profitability profile.
Siloam: Attractive macro + capacity expansion story, now at a favourable risk-reward.
Healthcare demand has historically been surprisingly more volatile and correlated to macro growth
Can hospital stocks be more resilient this cycle because of unprecedented capacity expansion?
Valuation snapshot
Figure 8: ASEAN hospitals—valuation comparison13-Jan-16 US$ bn LC LC Price performance (%)
Year-end Mkt cap Rating Currency Price TP Ups. 1M 3M 6M 12M YTD 2015 2014 2013
Malaysia
IHH IHHH.KL Dec-14 12.2 O MYR 6.50 6.80 5% 3.2 2.5 11.3 33.7 -1.2 36.5 24.9 14.5
KPJ KPJH.KL Dec-14 1.1 N MYR 4.36 4.00 -8% 3.3 1.9 0.9 17.2 3.3 14.1 -4.6 4.9
Thailand
BDMS BDMS.BK Dec-14 9.2 O THB 21.60 22.50 4% 1.9 11.3 3.8 15.5 -3.1 29.7 46.4 3.5
BH BH.BK Dec-14 4.5 O THB 224.00 245.00 9% 7.7 -2.2 12.0 60.6 6.2 49.6 60.7 18.6
BCH BCH.BK Dec-14 0.7 N THB 9.55 6.50 -32% 15.8 38.4 27.3 17.2 5.5 14.6 30.6 -16.4
CHG CHG.BK Dec-14 0.9 O THB 2.92 2.50 -14% 20.7 30.4 56.1 61.3 9.8 47.8 80.0
-Singapore
Raffles RAFG.SI Dec-14 1.6 O SGD 3.99 5.00 25% -7.9 -10.3 -12.9 3.6 -4.1 6.9 26.6 18.7
Indonesia
Siloam SILO.JK Dec-14 0.8 O IDR 9,400 13,000 38% -2.8 -24.5 -33.9 -30.4 -4.1 -28.5 44.2
-Mitra MIKA.JK Dec-14 2.2 - IDR 2,120 - - -0.7 -23.7 -12.3 - -11.7 - -
-EPS G'th (%) P/E (x) EV / EBITDA (x)
'15E '16E '17E '15E '16E '17E '15E '16E '17E '16E '17E '16E '17E '16E '17E
Malaysia
IHH IHHH.KL 47.9 22.3 20.8 47.7 39.0 32.3 24.8 20.3 17.0 6.4 7.4 2.5 2.4 0.5 0.5
KPJ KPJH.KL 34.5 15.2 12.2 29.5 25.6 22.8 14.3 12.0 10.2 12.5 12.8 2.9 2.7 1.8 1.8
Thailand
BDMS BDMS.BK 7.3 25.2 21.5 43.5 34.7 28.6 25.8 21.8 18.7 17.1 18.6 5.9 5.3 1.4 1.8
BH BH.BK 26.7 22.5 13.0 47.8 39.0 34.5 31.1 26.2 23.5 27.4 26.7 10.7 9.2 1.4 1.6
BCH BCH.BK -23.8 26.0 28.8 59.9 47.5 36.9 21.8 19.4 17.0 11.3 13.5 5.3 5.0 1.4 1.8
CHG CHG.BK 5.1 39.5 22.9 63.6 45.6 37.1 40.4 29.9 24.0 22.2 24.7 10.1 9.2 1.5 1.9
Singapore
Raffles RAFG.SI 8.5 21.6 13.9 31.8 26.2 23.0 22.8 18.6 16.0 12.9 13.0 3.4 3.0 1.5 1.5
Indonesia
Siloam SILO.JK 57.4 61.9 74.9 110.4 68.2 39.0 19.2 13.4 9.1 8.5 13.1 5.8 5.1 0.1 0.3
Mitra MIKA.JK 8.7 16.5 23.6 52.2 44.8 36.2 36.6 30.9 24.7 17.8 19.0 7.9 6.9 0.7 0.8
Yield (%) ROE (%) P/B (x)
Source: Bloomberg, Credit Suisse estimates
Figure 9: P/E (x)
39.0
25.6
34.7 39.0
47.5 45.6
26.2
68.2
32.3
22.8
28.6
34.5 36.9 37.1
23.0
39.0
0 10 20 30 40 50 60 70
IHH KPJ BDMS BH BCH CHG Raffles Siloam 2016E 2017E
Figure 10: EV/EBITDA (x)
20.3
12.0
21.8
26.2
19.4
29.9
18.6
13.4 17.0
10.2
18.7
23.5
17.0
24.0
16.0
9.1
0 5 10 15 20 25 30 35
IHH KPJ BDMS BH BCH CHG Raffles Siloam 2016E 2017E
Healthcare demand not immune to
economic slowdown
'Defensive growth' is one of the key reasons investors cite for the premium valuations enjoyed by the healthcare sector. In this report, we explore whether this assumption holds true through historical periods of economic slowdown.
First, we look at the 'defensiveness' of the macro healthcare demand metrics. Second, we look at the stock valuation and price performance of the healthcare stocks through economic cycles. Finally, we provide our key recommendations on how to play the current macro slowdown in ASEAN.
Healthcare demand outperforms overall economic
growth over longer periods…
Through cycle the long-term growth of healthcare demand clearly appears to outperform the overall economy. In the past 5-10 years, Singapore and Indonesia have seen the fastest growth in healthcare expenditure and have also outperformed the overall GDP growth by the most. Interestingly, the gap between healthcare expenditure and GDP growth appears to have widened in the past five years compared to last ten years.
Figure 11: Healthcare expenditure versus nominal GDP growth—five-year CAGR (%)
Figure 12: Healthcare expenditure versus nominal GDP growth—ten-year CAGR (%)
15.0
8.8
8.2
9.9 12.0
5.9 5.8
6.8
0 2 4 6 8 10 12 14 16
Indo TH MY SG
HC exp. 5Y CAGR (%) GDP 5Y CAGR (%) 18.5
9.9
9.1
10.7 16.8
7.4
9.3
8.4
0 2 4 6 8 10 12 14 16 18 20
Indo TH MY SG
HC exp. 10Y CAGR (%) GDP 10Y CAGR (%)
Source: CEIC, World Health Organisation Source: CEIC, World Health Organisation
…but is not immune to short
-term volatility in the economy
To be termed 'defensive growth', the healthcare sector needs to either show a low correlation to the overall macroeconomic growth or display less volatile demand characteristics. We fail to see both these characteristics looking at the historical healthcare expenditure growth across countries. But some countries do show more defensiveness than others, mostly due to structural differences.
Healthcare demand shows decent correlation to overall macro…
We look at the historical correlation between nominal GDP growth and private healthcare expenditure growth over the past 20 years. We surprisingly find a decent correlation in most countries. It is interesting to note that there is probably a lag between GDP growth and healthcare expenditure growth—implying healthcare expenditure demand probably takes a bit more time to react to turns in an economic cycle.
Singapore: Healthcare demand displays a good correlation to overall GDP growth with a lag, despite highly subsidised healthcare services provided by the government and reliance on medical tourism.
Malaysia: Appears a bit more defensive during certain periods of economic stress, but in general shows decent correlation of overall GDP growth.
Figure 13: Singapore—GDP growth YoY versus healthcare expenditure growth YoY
Figure 14: Malaysia—GDP growth YoY versus healthcare expenditure growth YoY
-20 -10 0 10 20 30 40
2001 2002 2003 2004 2005 2006 2007 2008 2009 2010 2011 2012 2013 SG GDP (YoY%) Total exp. on health (YoY%)
-10 -5 0 5 10 15 20 25 30
2001 2002 2003 2004 2005 2006 2007 2008 2009 2010 2011 2012 2013 Msia GDP (YoY%) Total exp. on health (YoY%)
Source: CEIC, World Health Organisation Source: CEIC, World Health Organisation
Thailand: Probably shows the most correlation to overall economic growth among the ASEAN countries.
Indonesia: Surprisingly appears more volatile than the underlying economic growth.
Figure 15: Thailand—GDP growth YoY versus healthcare expenditure growth YoY
Figure 16: Indonesia—GDP growth YoY versus healthcare expenditure growth YoY
-5 0 5 10 15 20
2001 2002 2003 2004 2005 2006 2007 2008 2009 2010 2011 2012 2013 Thai GDP (YoY%) Total exp. on health (YoY%)
0 5 10 15 20 25 30 35 40 45
2001 2002 2003 2004 2005 2006 2007 2008 2009 2010 2011 2012 2013 Indo GDP (YoY%) Total exp. on health (YoY%)
Source: CEIC, World Health Organisation Source: CEIC, World Health Organisation
…and overall consumption growth
Now we look at how healthcare demand tracks against overall consumption growth in the economy, in trying to understand whether healthcare demand is at least more defensive than broader consumption demand. Popular logic suggests healthcare is more resilient than the broader consumption trends in the economy.
Singapore: Surprisingly, healthcare demand appears to be more volatile that the broader consumption in the economy. Overall, there appears to be some correlation with healthcare expenditure growth lagging overall expenditure.
Malaysia: Healthcare expenditure shows a decent correlation to private consumption growth and with a lag.
Figure 17: Singapore—private consumption growth YoY versus healthcare expenditure growth YoY
Figure 18: Malaysia—private consumption growth YoY versus healthcare expenditure growth YoY
-10
1995 1997 1999 2001 2003 2005 2007 2009 2011 2013
SG Total exp.on health YoY% SG PCE YoY% (RHS)
-10
1995 1997 1999 2001 2003 2005 2007 2009 2011 2013
MY Total exp.on health YoY% MY PCE YoY% (RHS)
Source: CEIC, World Health Organisation Source: CEIC, World Health Organisation
Thailand: Similar to GDP, healthcare expenditure in Thailand shows the best correlation to private consumption growth through economic cycles.
Indonesia: Healthcare expenditure shows less correlation to overall consumption in the economy, but nevertheless appears to be more volatile.
Figure 19: Thailand—private consumption growth YoY versus healthcare expenditure growth YoY
Figure 20: Indonesia—private consumption growth YoY versus healthcare expenditure growth YoY
-4
1995 1997 1999 2001 2003 2005 2007 2009 2011 2013
TH Total exp.on health YoY% TH PCE YoY% (RHS)
0
1995 1997 1999 2001 2003 2005 2007 2009 2011 2013
Indo Total exp.on health YoY% Indo PCE YoY% (RHS)
Income growth the key driver of demand – and a source of volatility
Finally, we look at how healthcare demand tracks against overall income growth in the economy—a key determinant of consumption and affordability. We find that income growth in general explains the volatility in healthcare demand. But surprisingly, the volatility in healthcare demand appears to be more accentuated by changes in income growth and healthcare demand seemingly recovering only with a lag.
Singapore: Changes in healthcare demand appear to be more correlated on the downside. This is probably explained by the fact that Singapore is one of the most penetrated in terms of healthcare expenditure among ASEAN countries and any slowdown in income growth appears to have a disproportionate impact. This is surprising given the level of buffer provided by government subsidies and support from medical tourism.
Malaysia: Appears to be the least volatile and correlated to income growth.
Figure 21: Singapore—income growth YoY versus healthcare expenditure growth YoY
Figure 22: Malaysia—income growth YoY versus healthcare expenditure growth YoY
-4
1995 1997 1999 2001 2003 2005 2007 2009 2011 2013
SG Total exp.on health YoY% SG Wage growth YoY% (RHS)
-4
1995 1997 1999 2001 2003 2005 2007 2009 2011 2013
MY Total exp.on health YoY% MY Wage growth YoY% (RHS)
Source: CEIC, World Health Organisation Source: CEIC, World Health Organisation
Thailand: Shows a decent correlation to the changes in wage growth in the economy.
Indonesia: Healthcare expenditure shows more correlation to wage growth that to overall GDP growth or GDP growth.
Figure 23: Thailand—income growth YoY versus healthcare expenditure growth YoY
Figure 24: Indonesia—income growth YoY versus healthcare expenditure growth YoY
-2
1995 1997 1999 2001 2003 2005 2007 2009 2011 2013
TH Total exp.on health YoY% TH Wage growth YoY% (RHS)
0
1995 1997 1999 2001 2003 2005 2007 2009 2011 2013
Indo Total exp.on health YoY% Indo Wage growth YoY% (RHS)
A look at US healthcare demand through cycles
Looking at the historical trends of US healthcare expenditure growth would be instructive, mainly given the long historical data available.
Over a 50-year period, while overall healthcare expenditure growth has been mostly above nominal GDP growth, it is nevertheless quite volatile and shows good correlation with the overall economic growth.
Figure 25: The US—total healthcare expenditure YoY versus GDP growth YoY (%)
-4 -2 0 2 4 6 8 10 12 14 16 18
1961 1966 1971 1976 1981 1986 1991 1996 2001 2006 2011 US Total Health Exp. (YoY%) US Nom. GDP growth (YoY%)
Source: Bloomberg, Credit Suisse research
A look at the correlation with overall consumption growth in the economy and wage growth further confirms our theory that (1) healthcare expenditure is neither defensive nor immune to the underlying consumption growth in the economy, and (2) wage growth seems to be a critical driver of healthcare expenditure growth.
What is interesting is that these trends seem to hold largely true despite the average income level in the economy, the level of healthcare penetration and difference in the funding mix of healthcare expenditure.
Figure 26: The US—total healthcare expenditure YoY versus consumption YoY (%)
Figure 27: The US—total healthcare expenditure YoY versus wage growth YoY (%)
0 2 4 6 8 10 12
2 4 6 8 10 12 14 16 18
1961 1966 1971 1976 1981 1986 1991 1996 2001 2006 2011
US Total Health Exp. (YoY%) US PCE YoY% (RHS)
-4 -2 0 2 4 6 8 10 12 14
2 4 6 8 10 12 14 16 18
1961 1966 1971 1976 1981 1986 1991 1996 2001 2006 2011 US Total Health Exp. (YoY%) US Wage growth YoY% (RHS)
Source: Bloomberg, Credit Suisse research Source: Bloomberg, Credit Suisse research
Experience so far this cycle: Weakness in healthcare
demand already apparent
ASEAN hospitals in general have seen a general slowdown in healthcare demand growth so far this year. While some hospital players with new developing hospitals have seen better-than-average volume growth owing to capacity addition, the organic volume growth in mature hospitals has remained lacklustre.
Figure 28: Quarterly patient volume growth (YoY %)
7
IHH SG IHH MY KPJ BDMS BH BCH CHG Siloam 1Q15 2Q15 3Q15
Source: Company data
In an environment of weak demand growth and overall weakness in consumption, hospitals are also finding it difficult to push through higher average pricing on services. In the current cycle Thai hospitals (especially BH and CHG) have displayed more demand resilience and have been able to push through price increases in the recent quarters. With weaker local currencies pushing up costs of imported medicines, hospital players are likely to pass through higher costs to patients, further restricting their ability to increase average net revenue per patient. This has further impacted the overall top-line growth.
Figure 29: ASEAN hospitals—quarterly top-line growth (YoY %)
9
IHH KPJ BDMS BH BCH CHG Raffles Siloam Mitra 4Q14 1Q15 2Q15 3Q15
Source: Company data
BDMS and Siloam got a boost from newly opened hospitals
Why has healthcare demand been not so defensive?
While it is too early in the cycle to draw conclusions, we list a few reasons based on our discussions with the stakeholders:
■ Postponement of discretionary / non-emergency procedures. With the increase in macro uncertainty and a slowdown in consumption demand, hospital players see patients delaying certain discretionary / non-emergency procedures. If this is a genuine 'postponement', demand should probably be back within a couple of quarters. If demand does not pick up in 2H15, probably other structural issues drive weaker demand.
■ Move to cheaper alternatives locally. With weaker wage and consumption growth, there is also a general shift in healthcare demand to cheaper alternatives, mainly cheaper services at government facilities. Especially in the case of Indonesia, the roll-out of the government's universal insurance scheme has resulted in some shift of demand away from private healthcare players.
■ Impact of weaker currency / macro on medical tourism. Sustained weakness in emerging market currencies has affected medical tourism demand especially into Singapore. A weaker currency is probably only a minor driver, with weaker overall macro conditions probably having a bigger influence.
Stock performance more defensive
than underlying earnings
From an investor perspective, what is probably more important is the impact of macro slowdown on earnings and stock price performance of private healthcare operators. In this section, we take a look at the sensitivity of earnings and stock price/valuations to macro volatility through cycles. For a lack of history, we restrict this analysis to hospital stocks listed before 2008-09 in Singapore, Malaysia and Thailand.
Reported earnings not all that 'defensive'
We look at how reported earnings have responded to volatility in economic growth over the past cycles to assess 'defensiveness'. Reported earnings historically appear to be more volatile than expected and more correlated to economic growth through cycles.
Figure 30: Raffles Med—EPS versus GDP growth YoY (%) Figure 31: KPJ—EPS versus GDP growth YoY (%)
-15
2Q98 2Q00 2Q02 2Q04 2Q06 2Q08 2Q10 2Q12 2Q14 RFMG - 12M TRAILING EPS GDP YoY% (RHS)
-15
1Q04 1Q06 1Q08 1Q10 1Q12 1Q14 KPJ - 12M TRAILING EPS GDP YoY% (RHS)
Source: CEIC, Datastream Source: CEIC, Datastream
Figure 32: BDMS—EPS versus GDP growth YoY (%) Figure 33: BH—EPS versus GDP growth YoY (%)
1Q06 1Q08 1Q10 1Q12 1Q14 BDMS - 12M TRAILING EPS GDP YoY% (RHS)
-10
1Q06 1Q08 1Q10 1Q12 1Q14 BH - 12M TRAILING EPS GDP YoY% (RHS)
Figure 34: Consensus EPS revisions (% change)
-1
2
-8
-5 -4
-24
0 1
3
-12
1
-3
-5 -5
-13
-4
-30 -25 -20 -15 -10 -5 0 5 10
IHH KPJ BDMS BH BCH CHG Raffles Siloam Mitra 3M 6M
Source: Bloomberg
Stock price performance
–
more resilient in relative terms
We now look at the historic stock performance of hospital stocks through economic cycles to understand the impact of a more volatile than expected earnings profile on stock performance – both in absolute terms and relative to local markets.
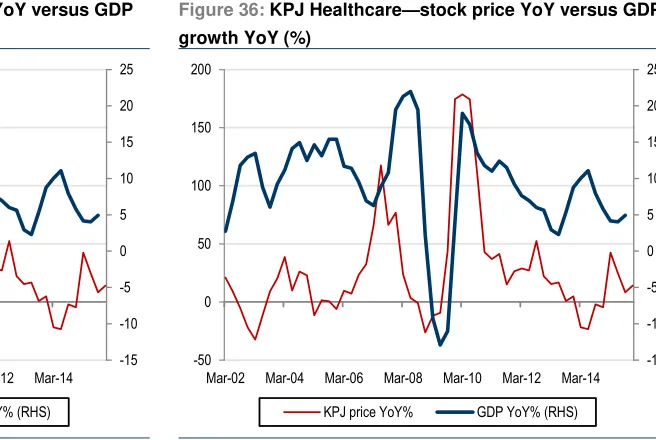
Absolute terms – resilient only during initial stages of an economic downturn
The absolute stock price performance appears to be lot more correlated to overall economic growth than you would expect for a defensive sector. Interestingly, hospital stocks appear to be more resilient during initial stages of an economic downturn and then eventually tend to follow suit inline with economic growth trends.
Figure 35: Raffles Medical—stock price YoY versus GDP growth YoY (%)
Figure 36: KPJ Healthcare—stock price YoY versus GDP growth YoY (%)
-15 -10 -5 0 5 10 15 20 25
-50 0 50 100 150 200
Mar-02 Mar-04 Mar-06 Mar-08 Mar-10 Mar-12 Mar-14 KPJ price YoY% GDP YoY% (RHS)
-15 -10 -5 0 5 10 15 20 25
-50 0 50 100 150 200
Mar-02 Mar-04 Mar-06 Mar-08 Mar-10 Mar-12 Mar-14 KPJ price YoY% GDP YoY% (RHS)
Source: CEIC, Datastream Source: CEIC, Datastream
Figure 37: BDMS—stock price YoY versus GDP growth YoY (%)
Figure 38: BH—stock price YoY versus GDP growth YoY (%)
-10.0 -5.0 0.0 5.0 10.0 15.0 20.0 25.0
-100.0 -50.0 0.0 50.0 100.0 150.0 200.0
Dec-96 Dec-99 Dec-02 Dec-05 Dec-08 Dec-11 Dec-14 BDMS price YoY% GDP YoY% (RHS)
-10 -5 0 5 10 15 20 25
-100 -50 0 50 100 150 200
Dec-95 Dec-98 Dec-01 Dec-04 Dec-07 Dec-10 Dec-13 BH price YoY% GDP YoY% (RHS)
Source: CEIC, Datastream Source: CEIC, Datastream
Relative terms – some evidence of outperformance during downturns
Looking at the performance of hospital stocks relative to their respective local markets, there is no conclusive evidence of consistent outperformance during economic downturns or volatility. But in majority of cases, hospital stocks have indeed outperformed their broader market segments.
More interestingly, partly owing to outperformance during economic downturns, hospital stocks tend to underperform during early stages of an economic recovery.
Both these observations are not conclusive and local/specific issues appear to be affecting stock performance during certain periods.
Figure 39: Raffles Medical—stock price relative to local market versus GDP growth YoY (%)
Figure 40: KPJ Healthcare—stock price relative to local market versus GDP growth YoY (%)
-15.0 -10.0 -5.0 0.0 5.0 10.0 15.0 20.0 25.0
0 100 200 300 400 500 600
Dec-99 Jan-02 Feb-04 Mar-06 Apr-08 May-10 Jun-12 Jul-14 RFMD price perf. Rel to index GDP YoY% (RHS)
-15.0 -10.0 -5.0 0.0 5.0 10.0 15.0 20.0 25.0
0 100 200 300 400 500 600
Mar-02 Dec-03 Sep-05 Jun-07 Mar-09 Dec-10 Sep-12 Jun-14 KPJ price perf. Rel to index GDP YoY% (RHS)
Figure 41: BDMS—stock price relative to local market versus GDP growth YoY (%)
Figure 42: BH—stock price relative to local market versus GDP growth YoY (%)
-10
Dec-95 Jul-98 Feb-01 Sep-03 Apr-06 Nov-08 Jun-11 Jan-14 BDMS price perf. Rel to index GDP YoY% (RHS)
-10
Dec-95 Jul-98 Feb-01 Sep-03 Apr-06 Nov-08 Jun-11 Jan-14 BH price perf. Rel to index GDP YoY% (RHS)
Source: CEIC, Datastream Source: CEIC, Datastream
Hospital stocks in our coverage have massively outperformed in the past year
Except for two, all hospital stocks in our coverage have massively outperformed their local markets, mainly driven by investor perception of 'defensiveness'.
Figure 43: 1Y absolute / relative price performance (%) Figure 44: 2Y absolute / relative price performance (%)
33
IHH KPJ BDMS BH BCH CHG Raffles Siloam 1Y absolute Relative to market
69
IHH KPJ BDMS BH BCH CHG Raffles Siloam 2Y absolute Relative to market
In fact, the healthcare sector has been a standout performer across all countries in Asia.
Figure 45: Overall market versus healthcare sector 2015 price performance (%)
-11 -10 -3 -7
-21 -8
-22 -8
-21 -14 -26 6
-4
0 2
-35 100
12
0 0 8
27
-60 -40 -20 0 20 40 60 80 100 120
NJA CN HK IN ID KR MY PH SG TW TH Market Healthcare
Source: Datastream
Valuations: Not immune historically to economic cycles
With ASEAN hospital valuations continuing to re-rate during the current economic weakness, we look at history to get some sense of whether this can be sustained.
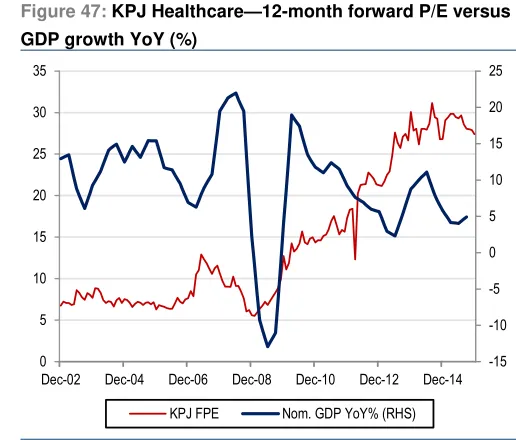
Absolute valuations – mostly correlated to economic cycles
Historically, hospital stock valuations appear to be more correlated to economic cycles than not. In the historical context, the ongoing re-rating of ASEAN hospital in an environment of economic uncertainty appears to be more an anomaly.
This could either mean 'this time is different' or we are in for a significant compression in valuation multiples if the current economic slowdown becomes more prolonged.
Figure 46: Raffles Medical—12-month forward P/E versus GDP growth YoY (%)
Figure 47: KPJ Healthcare—12-month forward P/E versus GDP growth YoY (%)
-15 -10 -5 0 5 10 15 20 25
0 5 10 15 20 25 30 35 40
Apr-97 Apr-99 Apr-01 Apr-03 Apr-05 Apr-07 Apr-09 Apr-11 Apr-13 Apr-15 RFMG FPE Nom. GDP YoY% (RHS)
-15 -10 -5 0 5 10 15 20 25
0 5 10 15 20 25 30 35
Dec-02 Dec-04 Dec-06 Dec-08 Dec-10 Dec-12 Dec-14 KPJ FPE Nom. GDP YoY% (RHS)
Source: CEIC, Datastream Source: CEIC, Datastream
Figure 48: BDMS—12-month forward P/E versus GDP growth YoY (%)
Figure 49: BH—12-month forward P/E versus GDP growth YoY (%)
Aug-03 Aug-05 Aug-07 Aug-09 Aug-11 Aug-13 Aug-15 BDMS FPE Nom. GDP YoY% (RHS)
-10
Nov-03 Nov-05 Nov-07 Nov-09 Nov-11 Nov-13 Nov-15 BH FPE Nom. GDP YoY% (RHS)
Source: CEIC, Datastream Source: CEIC, Datastream
Multiples have expanded meaningfully over the past two years
Valuation multiples for almost all hospital stocks in our universe have expanded over the past two years—despite a clearly mixed scorecard in terms of earnings delivery. The key driver has been the increasingly aggressive expansion strategies announced by the new and incumbent players which has resulted in investors willing to pay ever expanding valuation multiples in hope of an improved medium- to long-term growth outlook. The new hospital openings have also been a drag on reported earnings due to start-up losses.
Figure 50: P/E (x) Figure 51: EV/EBITDA (x)
IHH KPJ BDMS BH BCH CHG Raffles Siloam Mitra 2013 2014 2015
IHH KPJ BDMS BH BCH CHG Raffles Siloam Mitra 2013 2014 2015
Source: Thomson Reuters Source: Thomson Reuters
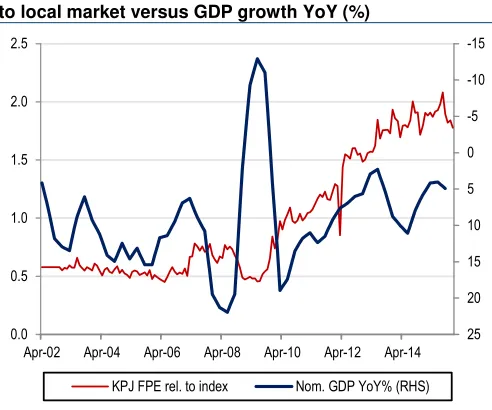
Relative valuations – no evidence of outperformance
While hospital stock relative valuations do indeed continue to improve during periods of economic growth acceleration, there is no evidence that relative valuations improve during economic downcycles.
In fact, relative valuations have deteriorated in a few cases during economic downturns. This might be partly because high growth expectations tend to be priced in, only to be disappointed once reality hits and reported earnings fail to meet expectations.
Figure 52: Raffles Medical—12-month forward P/E relative to local market versus GDP growth YoY (%)
Figure 53: KPJ Healthcare—12-month forward P/E relative to local market versus GDP growth YoY (%)
-15 -10 -5 0
5 10 15 20
25 0.0
0.5 1.0 1.5 2.0 2.5 3.0
Apr-97 Apr-00 Apr-03 Apr-06 Apr-09 Apr-12 Apr-15 RFMG FPE rel. to index Nom. GDP YoY% (RHS)
-15 -10 -5 0
5 10 15 20
25 0.0
0.5 1.0 1.5 2.0 2.5
Apr-02 Apr-04 Apr-06 Apr-08 Apr-10 Apr-12 Apr-14 KPJ FPE rel. to index Nom. GDP YoY% (RHS)
Source: CEIC, Datastream Source: CEIC, Datastream
Figure 54: BDMS—12-month forward P/E relative to local market versus GDP growth YoY (%)
Figure 55: BH—12-month forward P/E relative to local market versus GDP growth YoY (%)
-10 -5 0 5 10 15 20 25
0.0 0.5 1.0 1.5 2.0 2.5 3.0 3.5
Aug-03 Aug-05 Aug-07 Aug-09 Aug-11 Aug-13 Aug-15 BDMS FPE rel. to index Nom. GDP YoY% (RHS)
-10 -5 0 5 10 15 20 25
1.0 1.5 2.0 2.5 3.0 3.5 4.0
Nov-03 Nov-05 Nov-07 Nov-09 Nov-11 Nov-13 Nov-15 BH FPE rel. to index Nom. GDP YoY% (RHS)
How to play the current macro
slowdown?
The key question is, 'Is this cycle different?'. In this section, we look at the key differences this cycle and potential ways to play this cycle from a risk-reward perspective.
Two key differences this cycle
We find two key differences in terms of the underlying earnings profile and valuations:
(1) Aggressive pipeline expansion cycle. The level of capacity expansion by private players across ASEAN is unprecedented and is probably the biggest difference compared to previous cycles (and also used as an in support of relatively higher valuations). In the current environment, management's ability to deliver on their pipeline expansion plans will be under closer scrutiny. Any changes to pipeline expansion plans will also potentially signal management's view on the sustainability of overall healthcare demand.
(2) Relative valuations already quite expensive. Another key difference from a stock performance perspective is the already expensive valuations (both absolute and relative). With stocks already priced for perfection, it would make sustained outperformance all the more difficult. There is also scope for divergence of performance based on earnings delivery.
Who can outperform this cycle?
We look at three key stock price / valuation drivers to screen sectors / stocks that could prove to be defensive this cycle:
(1) Strong organic growth drivers. The current slowdown could help differentiate between the segmentation strategy of the players and resilience of their underlying demand drivers. Hospital players who are better able to adapt to changes in demand fundamentals and better protect their market shares would be in a better position to deliver on earnings growth targets.
(2) Strong capacity expansion pipeline and delivery. In our view, this could be the primary driver of outperformance this cycle. Given the level of expectations priced in, there is a lot of scope for managements to disappoint on their promised pipeline or with potential changes to expansion plans. A challenging demand environment will also test the target ramp-up schedules of developing new hospitals.
(3) Cheaper relative valuations. So far this cycle, hospital stocks with higher valuation multiples have continued to outperform as healthcare demand in general has remained strong and investors have preferred the more expensive stocks with superior expansion pipelines. With weaker-than-expected organic healthcare demand and potential recalibration of expansion plans, the more expensive healthcare stocks are probably primed for disappointment. We would prefer stocks with relatively cheap valuations and better underlying demand fundamentals (based on target customer segments, expansion pipeline delivery track record and also the diversity of earnings streams).
Level of capacity expansion this cycle is unprecedented across markets
Singapore: Near-term risks to organic growth
Figure 56: Singapore hospitals—valuation comparison
13-Jan-16 US$ bn LC LC
Mkt cap Rating Price TP Ups. '16E '17E '16E '17E '16E '17E '16E '17E '16E '17E '16E '17E Singapore
IHH IHHH.SI 12.2 O 2.08 2.67 28% 22.3 20.8 38.2 31.6 20.3 17.0 6.4 7.4 2.5 2.4 0.5 0.5
Raffles RAFG.SI 1.6 O 3.99 5.00 25% 21.6 13.9 26.2 23.0 18.6 16.0 12.9 13.0 3.4 3.0 1.5 1.5
EPS G'th (%) P/E (x) EV / EBITDA (x) ROE (%) P/B (x) Yield (%)
Source: Credit Suisse estimates, Thomson Reuters
Impact of the current macro slowdown on healthcare demand
Slower inbound medical tourism volumes. The weakness in the regional macro environment and a strong SGD has negatively impacted the inbound medical tourist volumes into Singapore. A slowdown in Indonesia, which is a key source of inbound medical tourists, continues to be a drag. To offset weak demand from ASEAN countries, Singapore hospitals have been diversifying into non-traditional sources like Indo-China and Middle East, which has provided a cushion.
Local healthcare demand remains mostly resilient. Driven by an ageing population, local healthcare demand in Singapore has remained robust and has so far been able to partly offset slowing demand from overseas.
Government subsidised schemes remain a key driver. Another key driver of local demand has been the increasing stimulus from Government in the form of higher subsidies and more comprehensive medical insurance schemes. This is likely to remain a key driver of private healthcare demand over the medium term.
Key risks to earnings over the medium term
Sustained weakness in regional macro environment. Sustained economic weakness in Singapore and the region could make a dent on consumer affordability, adversely affecting both the demand growth and pricing power of private hospital players.
Increased supply of government hospital beds. Singapore government has aggressive plans to increase hospital bed supply by as much as 20% over the next three years. While this could benefit supply conditions over the medium term, the pricing power of private hospital players might be affected in the near term (especially for players targeting the middle income segment).
Most and least preferred stocks in the medium term
Raffles Medical is one of our top picks in the ASEAN space driven by a strong growth pipeline in both Singapore and overseas.
Raffles Medical has announced a 70:30 JV with Shanghai LuJiaZui Group to build and operate a 400-bed hospital in Shanghai. We are positively surprised by this development and believe China could be a game changer over the medium term.
With more clarity on its China plans, the optionalities now appear significant: (1) the 400-bed Shanghai hospital could potentially be as valuable as the Singapore hospital given the economics, (2) the 200-bed Shenzhen hospital (still under discussion) could add further upside, and (3) further projects over the medium term cannot be ruled out.
Meanwhile, the Singapore business is likely to see a gradual improvement in profit contribution driven by collaboration with the government on emergency services (2H15), Holland Village specialist centre (1Q16) and Raffles hospital extension (1Q17).
Surprisingly, Singapore is seeing better local demand growth than other markets
Supply of government could prove to be a drag on private demand
Singapore: Key long-term charts
Figure 57: Total healthcare expenditure and % GDP Figure 58: GDP growth YoY versus healthcare expenditure growth YoY
2.9 3.1
2.7 2.8 3.2
3.6
3.9 3.9 4.2
0.0 0.5 1.0 1.5 2.0 2.5 3.0 3.5 4.0 4.5 5.0
1995 1999 2003 2007 2011
Singapore
-20 -10 0 10 20 30 40
2001 2002 2003 2004 2005 2006 2007 2008 2009 2010 2011 2012 2013
SG GDP (YoY%) Total exp. on health (YoY%)
Source: World Health Organization Source: World Health Organization
Figure 59: Annual top line (S$ mn) Figure 60: Annual EBITDA margin (%)
99 113
169 219 273
341 357 349
564 870
979
0 200 400 600 800 1,000 1,200
'00 '02 '04 '06 '08 '10 '12 '14
Raffles Parkway
11 14
17 23
25
24 24
20
25 25
22 24
0 5 10 15 20 25 30
'01 '03 '05 '07 '09 '11 '13
Raffles Parkway
Source: Company data Source: Company data
Figure 61: Stock price relative to market Figure 62: Forward P/E relative to market
0 100 200 300 400 500 600
Dec-99 Oct-01 Aug-03 Jun-05 Apr-07 Feb-09 Dec-10 Oct-12 Aug-14
RFMD price perf. Rel to index
0.7 1.2 1.7 2.2 2.7
Sep-00 Sep-03 Sep-06 Sep-09 Sep-12 Sep-15
RFMG FPE rel. to index
Malaysia: Tough macro conditions likely to test
organic demand
Figure 63: Malaysia hospitals valuation comparison
13-Jan-16 US$ bn LC LC
Mkt cap Rating Price TP Ups. '16E '17E '16E '17E '16E '17E '16E '17E '16E '17E '16E '17E Malaysia
IHH IHHH.KL 12.2 O 6.50 6.80 5% 22.3 20.8 39.0 32.3 20.3 17.0 6.4 7.4 2.5 2.4 0.5 0.5
KPJ KPJH.KL 1.0 N 4.36 4.00 -8% 15.2 12.2 25.6 22.8 12.0 10.2 12.5 12.8 2.9 2.7 1.8 1.8
ROE (%) P/B (x) Yield (%) P/E (x) EV / EBITDA (x)
EPS G'th (%)
Source: Credit Suisse estimates, Thomson Reuters
Impact of the current macro slowdown on healthcare demand
Double impact of GST and slowing economy. Overall consumption demand has seen a visible slowdown hit by a double whammy of a slowing economy and introduction of a new GST earlier this year. The impact of GST on healthcare demand is yet to be ascertained. GST is net margin negative for Malaysian hospitals since healthcare is a GST-exempt sector, but majority of input costs are GST liable. In the near term, this could also curtail the ability of hospitals to increase prices.
Medical tourism remains a work in progress. While Malaysia has been able to attract some cost-conscious medical tourists away from Singapore due to a weaker currency, it continues to underperform on its medical tourism capability. Sustained support from government on improving infrastructure and connectivity would be required to improve Malaysia's medium-term healthcare potential.
Key risks to earnings over the medium term
Weaker currency increases capex outlays. With the bulk of the medical equipment imported, a continued weakness in currency would affect the capex outlays of hospital players—both maintenance capex and purchase of equipment for new hospitals. This could add to cash flow problems in an already challenging environment.
Sustained macro uncertainty could result in pipeline expansion delays. If the demand environment continues to remain lacklustre, hospital players might be forced to reconsider their expansion plans. Any cutbacks could have a significant impact on the premium valuation multiples enjoyed by the hospital stocks.
Risks from overseas expansion plans. Both Malaysian hospital players, KPJ and IHH, have overseas ambitions and venturing into new geographies. M&A and execution risks in new markets remain key medium risks.
Most and least preferred stocks in the medium term
IHH is our top pick in the ASEAN hospital space. We like it both for its strong market positioning in its existing markets and potential upside from expansion into new attractive markets, especially India and China.
IHH has announced they entered into an agreement to buy 73.4% of Global Hospitals (India) at a consideration of Rs12.84 bn (US$196 mn). The Global Hospitals Group is a chain of tertiary / quaternary care hospitals in India having facilities across four cities with approximately 1,100 operational beds in total, with potential to grow up to ~1,900 beds (in five years). We think it is a decent deal for IHH (and not very expensive) that gives decent scale to drive long term growth in a strategically important market in Asia. But execution will be key – so far, management's M&A integration track record has been good across various geographies.
IHH is trading in line with ASEAN peer group average. Now with the establishment of a good growth platform in India and potential China plans, it is shaping up to be a unique pan-Asia player and deserves to trade at a premium.
Local demand is likely to be weighed down by macro factors near term
Will hospitals stick to their expansion plans in the face of macro headwinds
Malaysia: Key long-term charts
Figure 64: Total healthcare expenditure and % GDP Figure 65: GDP growth YoY versus healthcare expenditure growth YoY
2.8 2.9 3.0
3.4
3.7 3.7 3.5
4.0 4.0
0.0 0.5 1.0 1.5 2.0 2.5 3.0 3.5 4.0 4.5
1995 1999 2003 2007 2011
Malaysia
-10 -5 0 5 10 15 20 25 30
2001 2002 2003 2004 2005 2006 2007 2008 2009 2010 2011 2012 2013
Msia GDP (YoY%) Total exp. on health (YoY%)
Source: World Health Organization Source: World Health Organization
Figure 66: Annual top line (RM mn) Figure 67: Annual EBITDA margin (%)
223 583 831
1,267 3,946
5,191 6,758
0 1,000 2,000 3,000 4,000 5,000 6,000 7,000 8,000
'02 '04 '06 '08 '10 '12 '14
KPJ IHH
16 15
13 12 13
12 12
20 20
25
0 5 10 15 20 25 30
'02 '04 '06 '08 '10 '12 '14
KPJ IHH
Source: Company data Source: Company data
Figure 68: Stock price relative to market Figure 69: Forward P/E relative to market
0 100 200 300 400 500 600
Mar-02 Oct-03 May-05 Dec-06 Jul-08 Feb-10 Sep-11 Apr-13 Nov-14
KPJ price perf. Rel to index IHH price perf. Rel to index
0.0 0.5 1.0 1.5 2.0 2.5 3.0 3.5
Sep-03 Sep-05 Sep-07 Sep-09 Sep-11 Sep-13 Sep-15
KPJ FPE rel. to index IHH FPE rel. to index
Thailand: Riding through short-term challenges
Figure 70: Thailand hospitals valuation comparison
13-Jan-16 US$ bn LC LC
Mkt cap Rating Price TP Ups. '16E '17E '16E '17E '16E '17E '16E '17E '16E '17E '16E '17E Thailand
BDMS BDMS.BK 9.2 O 21.60 22.50 4% 25.2 21.5 34.7 28.6 21.8 18.7 17.1 18.6 5.9 5.3 1.4 1.8
BH BH.BK 4.5 O 224.00 245.00 9% 22.5 13.0 39.0 34.5 26.2 23.5 27.4 26.7 10.7 9.2 1.4 1.6
BCH BCH.BK 0.7 N 9.55 6.50 -32% 26.0 28.8 47.5 36.9 19.4 17.0 11.3 13.5 5.3 5.0 1.4 1.8
CHG CHG.BK 0.9 O 2.92 2.50 -14% 39.5 22.9 45.6 37.1 29.9 24.0 22.2 24.7 10.1 9.2 1.5 1.9
EPS G'th (%) P/E (x) EV / EBITDA (x) ROE (%) P/B (x) Yield (%)
Source: Credit Suisse estimates, Thomson Reuters
Impact of the current macro slowdown on healthcare demand
Low- to medium-end segments slowing, high-end resilient. In Thailand, we have seen a diverse impact from the softening economic outlook. The hospitals targeted high-end market such as BH and BDMS (only high-end hospitals) have been resilient and enjoyed margin expansion on rising intensity and pricing power. However, the slowdown has been noticed for hospitals active in low-to-medium end (Phyathai and Paolo brands of BDMS and BCH). Within the low-to-medium end segment, CHG is the only exception, achieving outstanding 20% and 14% revenue growth in 2014 and 1H15, respectively.
Medical tourism remained resilient. BH is the leading player in this segment and has seen revenue contribution from international patients (up to 90% of which is from medical tourism) increase from 60% in 9M14 to 66% in 9M15. Thailand's key advantages include relatively cheap price (versus Singapore), warm hospitality of Thai people and plenty of tourist attractions.
Public spending on healthcare not affected. In light of weakening consumption (affecting mostly low income citizen), we reckon that there could be some shift in demand towards public sector, i.e., Social Security (SSO) and Universal Healthcare (UH) schemes. CHG, the most dominant player public health spending area (which contributes 50% of CHG's revenue), enjoyed 20% YoY revenue growth from this segment during 1H15. Next year, the National Health Security Office (NHSO) has endorsed 8% increase in budget for UH scheme.
Most and least preferred stocks in the medium term
BH: BH is our top pick for the sector. Focusing on premium grade healthcare service with limited competition, we believe BH could retain its strong pricing power for years, making it less susceptible to weak domestic consumption which we think could persist for a while. Its strong financial position allows it to continue investing in medical technology, thereby easily attracting good specialists, qualified medical personnel and eventually customers. Due to lower oil prices, BH could also benefit from a shift in demand from Middle East medical tourists, many of whom still travel to more expensive destinations such as Germany and the US and are likely to consider Thailand as alternative for cheaper prices.
BDMS: BDMS is also our top pick on a combination of factors; relatively cheap valuation against other Thai hospital names, M&A plan and high leverage for future margin improvement; its bed utilisation rate is 65% versus 84% for CHG and 75% for BH. In 2015, several factors have turned against BDMS; launch of several (13) new hospitals has produced a drag on margin, fallout in Russian tourist arrivals hurt the performance of hospital in key tourist destination such as Pattaya and Phuket and weak consumption weigh on top line growth of Phyathai and Paolo brands. But we believe margin recovery would be the key driver for the next two years.
Low-end demand soft, but high end remains strong
Medical tourism still has bright prospect
Public health spending has plenty room to grow
Thailand: Key long-term charts
Figure 71: Total healthcare expenditure and % GDP Figure 72: GDP growth YoY versus healthcare expenditure growth YoY
3.8 3.7
3.4 3.7
3.5 3.5
3.9 3.8 4.5
0.0 0.5 1.0 1.5 2.0 2.5 3.0 3.5 4.0 4.5 5.0
1995 1999 2003 2007 2011
Thailand
-5 0 5 10 15 20
2001 2002 2003 2004 2005 2006 2007 2008 2009 2010 2011 2012 2013
Thai GDP (YoY%) Total exp. on health (YoY%)
Source: World Health Organization Source: World Health Organization
Figure 73: Annual top line (Bt mn) Figure 74: Annual EBITDA margin (%)
1,659 2,374 5,312
15,776
21,348 23,734 45,478
56,054
0 10,000 20,000 30,000 40,000 50,000 60,000
'00 '02 '04 '06 '08 '10 '12 '14
BDMS BH BCH CHG
14 20
23
22 31
27 26 28
32
27 25
0 5 10 15 20 25 30 35 40
'00 '02 '04 '06 '08 '10 '12 '14
BDMS BH BCH CHG
Source: Company data Source: Company data
Figure 75: Stock price relative to market Figure 76: Forward P/E relative to market
0 2,000 4,000 6,000 8,000 10,000 12,000
Dec-95 Jul-98 Feb-01 Sep-03 Apr-06 Nov-08 Jun-11 Jan-14
BH price perf. Rel to index BDMS price perf. Rel to index
0.8 1.3 1.8 2.3 2.8 3.3 3.8 4.3
Nov-03 Nov-05 Nov-07 Nov-09 Nov-11 Nov-13 Nov-15
BDMS FPE rel. to index BH FPE rel. to index
Indonesia: Organic demand under pressure
Figure 77: Indonesia hospitals—valuation comparison
13-Jan-16 US$ bn LC LC
Mkt cap Rating Price TP Ups. '16E '17E '16E '17E '16E '17E '16E '17E '16E '17E '16E '17E Indonesia
Siloam SILO.JK 0.8 O 9,400 13,000 38% 61.9 74.9 68.2 39.0 13.4 9.1 8.5 13.1 5.8 5.1 0.1 0.3
Mitra MIKA.JK 2.2 N 2,120 2,500 18% 16.5 23.6 44.8 36.2 30.9 24.7 17.8 19.0 7.9 6.9 0.7 0.8
Yield (%) EPS G'th (%) P/E (x) EV / EBITDA (x) ROE (%) P/B (x)
Source: Credit Suisse estimates, Thomson Reuters
Impact of the current macro slowdown on healthcare demand
Double impact from the macro slowdown and BPJS. Private healthcare players are facing twin headwinds from a weakening economy and loss of market share to government subsidised healthcare services. The economic slowdown appears to be having a visible impact on overall consumption demand. The rollout of the universal insurance, while a structural positive for Indonesia's healthcare demand over the medium to long term, is diverting healthcare demand away from private hospitals in the near term.
Key risks to earnings over the medium term
Sustainability of BPJS yet to be fully addressed. As the government continues with its planned rollout of its universal insurance scheme, the long-term sustainability of the scheme is yet to be fully addressed. In 2014, the estimated costs per member per month (PMPM) were Rp31,812, while the average contribution amounted to just Rp27,696. Dividing the costs by the contribution results in a claim ratio of 115%. It is obvious that JKN contribution levels are inadequate to cover the health care services, resulting in a deficit of about 15% or Rp4,116 PMPM. In future, the average JKN contribution could rise from Rp27,696 PMPM to Rp34,020 PMPM in 2019, an average increase of 4.6% a year. The gap between the two sides of the equation is shown in the growing claim ratio and the resulting deficit in absolute terms. At this rate, the cumulative deficit by 2019 could rise to Rp96.2 tn (US$6.5 bn). Better clarity on the long-term sustainability of BPJS would critical to achieve the medium-term growth and profitability potential for private players.
Impact of weak macro and currency on expansion plans. With the bulk of the medical equipment imported, a continued weakness in currency would affect the capex outlays of hospital players—both maintenance capex and purchase of equipment for new hospitals. This could add to cash flow problems in an already challenging environment. It appears that in order to address the impact of this issue in the short term, hospital players might choose scale down the range of facilities available at new hospital openings.
Most and least preferred stocks in the medium term
Mitra: We believe Mitra's conservative approach could result in an unexciting growth profile, especially given the huge potential in Indonesia's private healthcare segment. From a medium-term perspective, Mitra might potentially miss out on growth opportunities outside its core focus regions of Jakarta and Surabaya, which in the meanwhile might become more crowded and competitive markets. Driven by a macroeconomic slowdown and BPJS-related risks, near-term earnings risks for the company have increased as well. Key upside risks are from the better-than-expected turnaround in healthcare demand and downside from more stringent regulations and sustained demand weakness.
Siloam: We believe in the medium term, Siloam could be the best play to leverage on the healthcare underpenetration story in Indonesia as it builds a hospital network unrivalled in scope and scale across Indonesia. Margin issues are likely to be short-lived. Siloam's profitability metrics are likely to play catch-up as more hospitals mature. Looking beyond the near-term growth and margin issues, Siloam is probably one of the best growth stories in the region.
BPJS likely the biggest wild card for 2016
Indonesia: Key long-term charts
Figure 78: Total healthcare expenditure and % GDP Figure 79: GDP growth YoY versus healthcare expenditure growth YoY
1995 1999 2003 2007 2011
Indonesia
2001 2002 2003 2004 2005 2006 2007 2008 2009 2010 2011 2012 2013
Indo GDP (YoY%) Total exp. on health (YoY%)
Source: World Health Organization Source: World Health Organization
Figure 80: Annual top line (RP bn) Figure 81: Annual EBITDA margin (%)
1,030
242 270 337 414
0
Source: Company data Source: Company data
Figure 82: Stock price relative to market Figure 83: Forward P/E relative to market
80
Sep-13 Jan-14 May-14 Sep-14 Jan-15 May-15 Sep-15
Silo price perf. Rel to index
4
Oct-13 Jan-14 Apr-14 Jul-14 Oct-14 Jan-15 Apr-15 Jul-15 Oct-15
Silo FPE rel. to index
Companies Mentioned (Price as of 13-Jan-2016) Bangkok Chain Hospital (BCH.BK, Bt9.55)
Bangkok Dusit Medical Services (BDMS.BK, Bt21.6)
Bumrungrad Hospital Pcl (BH.BK, Bt224.0)
Chularat Hospital (CHG.BK, Bt2.92)
IHH Healthcare (IHHH.KL, RM6.5)
KPJ Healthcare Bhd (KPJH.KL, RM4.36)
Raffles Medical Group (RAFG.SI, S$3.99)
Siloam International Hospitals (SILO.JK, Rp9,400)
Disclosure Appendix
Important Global Disclosures
Anand Swaminathan, Thaniya Kevalee and Ella Nusantoro each certify, with respect to the companies or securities that the individual analyzes, that (1) the views expressed in this report accurately reflect his or her personal views about all of the subject companies and securities and (2) no part of his or her compensation was, is or will be directly or indirectly related to the specific recommendations or views expressed in this report.
The analyst(s) responsible for preparing this research report received Compensation that is based upon various factors including Credit Suisse's total revenues, a portion of which are generated by Credit Suisse's investment banking activities
As of December 10, 2012 Analysts’ stock rating are defined as follows:
Outperform (O) : The stock’s total return is expected to outperform the relevant benchmark* over the next 12 months.
Neutral (N) : The stock’s total return is expected to be in line with the relevant benchmark* over the next 12 months.
Underperform (U) : The stock’s total return is expected to underperform the relevant benchmark* over the next 12 months.
*Relevant benchmark by region: As of 10th December 2012, Japanese ratings are based on a stock’s total return relative to the analyst's coverage universe which consists of all companies covered by the analyst within the relevant sector, with Outperforms representing the most attractive, Neutral s the less attractive, and Underperforms the least attractive investment opportunities. As of 2nd October 2012, U.S. and Canadian as well as European ratings are based on a stock’s total return relative to the analyst's coverage universe which consists of all companies covered by the analyst within the relevant sector, with Outperforms representing the most attractive, Neutrals the less attractive, and Underperforms the least attractive investment opportunities. For Latin American and non -Japan Asia stocks, ratings are based on a stock’s total return relative to the average total return of the relevant country or regional benchmark; prior to 2nd October 2012 U.S. and Canadian ratings were based on (1) a stock’s absolute total return potential to its current share price and (2) the relative attractiveness of a stock’s total return potential within an analyst’s coverage universe. For Australian and New Zealand stocks, the expected total return (ETR) calculation includes 12 -month rolling dividend yield. An Outperform rating is assigned where an ETR is greater than or equal to 7.5%; Underperform where an ETR less than or equal to 5%. A Neutral may be assigned where the ETR is between -5% and 15%. The overlapping rating range allows analysts to assign a rating that puts ETR in the context of associated risks. Prior to 18 May 2015, ETR ranges for Outperform and Underperform ratings did not overlap with Neutral thresholds between 15% and 7.5%, which was in operation from 7 July 2011.
Restricted (R) : In certain circumstances, Credit Suisse policy and/or applicable law and regulations preclude certain types of communications, including an investment recommendation, during the course of Credit Suisse's engagement in an investment banking transaction and in certain other circumstances.
Volatility Indicator [V] : A stock is defined as volatile if the stock price has moved up or down by 20% or more in a month in at least 8 of the past 24 months or the analyst expects significant volatility going forward.
Analysts’ sector weightings are distinct from analysts’ stock ratings and are based on the analyst’s expectations for the fundamentals and/or valuation of the sector* relative to the group’s historic fundamentals and/or valuation:
Overweight : The analyst’s expectation for the sector’s fundamentals and/or valuation is favorable over the next 12 months.
Market Weight : The analyst’s expectation for the sector’s fundamentals and/or valuation is neutral over the next 12 months.
Underweight : The analyst’s expectation for the sector’s fundamentals and/or valuation is cautious over the next 12 months. *An analyst’s coverage sector consists of all companies covered by the analyst within the relevant sector. An analyst may cover multiple sectors.
Credit Suisse's distribution of stock ratings (and banking clients) is:
Global Ratings Distribution
Rating Versus universe (%) Of which banking clients (%)
Outperform/Buy* 55% (31% banking clients)
Neutral/Hold* 30% (27% banking clients)
Underperform/Sell* 14% (36% banking clients)
Restricted 1%
Credit Suisse’s policy is to update research reports as it deems appropriate, based on developments with the subject company, the sector or the market that may have a material impact on the research views or opinions stated herein.
Credit Suisse's policy is only to publish investment research that is impartial, independent, clear, fair and not misleading. For more detail please refer to Credit Suisse's Policies for Managing Conflicts of Interest in connection with Investment Research:
http://www.csfb.com/research-and-analytics/disclaimer/managing_conflicts_disclaimer.html
Credit Suisse does not provide any tax advice. Any statement herein regarding any US federal tax is not intended or written to be used, and cannot be used, by any taxpayer for the purposes of avoiding any penalties.
See the Companies Mentioned section for full company names
The subject company (IHHH.KL, SILO.JK, BH.BK, KPJH.KL) currently is, or was during the 12-month period preceding the date of distribution of this report, a client of Credit Suisse.
Credit Suisse provided investment banking services to the subject company (IHHH.KL, SILO.JK, KPJH.KL) within the past 12 months.
Credit Suisse has received investment banking related compensation from the subject company (IHHH.KL, SILO.JK, KPJH.KL) within the past 12 months
Credit Suisse expects to receive or intends to seek investment banking related compensation from the subject company (IHHH.KL, SILO.JK, BH.BK, BCH.BK, KPJH.KL, RAFG.SI) within the next 3 months.
Credit Suisse may have interest in (SILO.JK)
Credit Suisse may have interest in (IHHH.KL, KPJH.KL)
For other important disclosures concerning companies featured in this report, including price charts, please visit the website at https://rave.credit-suisse.com/disclosures or call +1 (877) 291-2683.
Important Regional Disclosures
Singapore recipients should contact Credit Suisse AG, Singapore Branch for any matters arising from this research report.
The analyst(s) involved in the preparation of this report may participate in events hosted by the subject company, including site visits. Credit Suisse does not accept or permit analysts to accept payment or reimbursement for travel expenses associated with these events.
Restrictions on certain Canadian securities are indicated by the following abbreviations: NVS--Non-Voting shares; RVS--Restricted Voting Shares; SVS--Subordinate Voting Shares.
Individuals receiving this report from a Canadian investment dealer that is not affiliated with Credit Suisse should be advised that this report may not contain regulatory disclosures the non-affiliated Canadian investment dealer would be required to make if this were its own report.
For Credit Suisse Securities (Canada), Inc.'s policies and procedures regarding the dissemination of equity research, please visit https://www.credit-suisse.com/sites/disclaimers-ib/en/canada-research-policy.html.
Credit Suisse has acted as lead manager or syndicate member in a public offering of securities for the subject company (IHHH.KL, SILO.JK, BDMS.BK) within the past 3 years.
As of the date of this report, Credit Suisse acts as a market maker or liquidity provider in the equities securities that are the subject of this report.
Principal is not guaranteed in the case of equities because equity prices are variable.
Commission is the commission rate or the amount agreed with a customer when setting up an account or at any time after that.
For Thai listed companies mentioned in this report, the independent 2014 Corporate Governance Report survey results published by the Thai Institute of Directors Association are being disclosed pursuant to the policy of the Office of the Securities and Exchange Commission: Bangkok Dusit Medical Services (Very Good) , Bumrungrad Hospital Pcl (Good) , Chularat Hospital (Good) , Bangkok Chain Hospital ()
To the extent this is a report authored in whole or in part by a non-U.S. analyst and is made available in the U.S., the following are important disclosures regarding any non-U.S. analyst contributors: The non-U.S. research analysts listed below (if any) are not registered/qualified as research analysts with FINRA. The non-U.S. research analysts listed below may not be associated persons of CSSU and therefore may not be subject to the NASD Rule 2711 and NYSE Rule 472 restrictions on communications with a subject company, public appearances and trading securities held by a research analyst account.
Credit Suisse AG, Singapore Branch ... Anand Swaminathan ; Dawei Lee
Credit Suisse Securities (Thailand) Limited ... Thaniya Kevalee
PT Credit Suisse Securities Indonesia ... Ella Nusantoro