The Quality of Risk Disclosure: Evidence from Infrastructure Industry in
Indonesia
Ira Geraldina
STIE Indonesia Banking School
Email: [email protected]
1. Introduction
Infrastructure development is one of the top priority in Indonesia's development plans. It was stated in Master Plan for the Acceleration and Expansion of Indonesian Economic Development for 2011-2025. It is such an opportunity as well as a challenge for the infrastructure industry in Indonesia, because Indonesia has a relatively higher political and business instability condition. As disclosed by Euro monitor International (2014), the business risk environment index in Indonesia is relatively high compared to other countries. Indonesia’s rank index was 159 out of 203 countries in the world or placed 36 out of 47
regional countries in 2012, in terms of the index of political stability and absence of violence. In terms of the ease of doing business index, Indonesia placed 120 out of 189 countries that were surveyed in early 2014. It means that the bureaucracy of running business in Indonesia is relatively high.
For those reasons above, infrastructure firms are required to have a good ability in managing risk, both internal and external risks. Internal risks include operational risk, compliance risk, and the risk of internal control weaknesses that are closely related to the reliability of financial reporting A R T I C L E I N F O R M A T I O N A B S T R A C T
Article history:
Received date: 19 July 2017
Received in revised form: 29 Agustus 2017 Accepted: 29 September 2017
Available online: 20 October 2017
The objective of this study was to analyze the quality of mandatory and voluntary risk disclosure in Indonesia during the period of 2011 and 2012. The risk disclosure quality is defined as the quality of risk information that are disclosed by firms in term of relative quantity (adjusted by type of sub-industry and firm size), depthness (the potential impact of risk disclosed on firm’s future performance), the coverage within every type of risk, and the outlook profile of firm’s risk management. This study used samples of 48 firm-years of infrastructure companies that were listed in Indonesia Stock Exchange. Infrastructure industry was chosen due to the strategic role of this industry to support the acceleration and expansion of Indonesia's economic development. By using a descriptive qualitative method, the result showed that firms were still emphasizing on relative quantity dimension compared to the other three dimensions: coverage, depth, and outlook profile of firm risk management. In addition, the quality of mandatory risk disclosure was better than voluntary risk disclosure either for depth, coverage, or an outlook profile of firm risk management dimension. In other words, financial risk items (mandatory risk disclosure items) have better quality rather than non-financial risk items (voluntary risk disclosure items).
©2017 FEB USK. All rights reserved. Keywords:
Quality of mandatory risk disclosure, quality of voluntary risk disclosure, relative quantity, depth, coverage, and an outlook profile of firm risk management.
systems. External risks include country risk factors and competitive risk.
Therefore, firms are required to communicate those risks, especially with external parties, including investors and creditors who are interested to assess the firm risk. Risk disclosure can be used as a medium to communicate the risks that are managed by firms. Risk disclosure reduces the asymmetry information between firm and investors that can increase liquidity of the stock price and decrease cost of capital (ICAEW, 2011; Kim & Verrecchia, 2001; Diamond & Verrecchia, 1991; Healy & Palepu, 2001). The spirit of risk disclosure is in-line with future reporting criteria that should be forward-looking, non-financial, and soft information. The risk information is needed by investors to assess the ability of firms in addressing the changes of their business environments (Beattie, 2000).
The regulation regarding risk disclosure in Indonesia is still limited to the financial risk due the existence of risk exposure that arises from the used of financial derivative instruments. Meanwhile, firms also should manage another kind of risk, including the business, integrity, strategic, environmental risk, etc. The more comprehensive, the more likely the benefits that can be obtained by the firms. Therefore, there is a demand to investigate the risk disclosure quality in Indonesia, especially for firms who are engaged in the infrastructure industry.
Previous studies in Indonesia conducted by Syabani & Siregar (2013) and Wulandari & Djuminah (2013) were analyzed only the quantity of risk disclosure and used a number of words as a proxy to measure risk disclosure quality. In fact, the number of words alone did not capture other dimensions of quality disclosures, such as the coverage of disclosure, the depth, and the outlook profile of firm risk management (Beretta & Bozzolan, 2004; Beattie, McInnes, & Fearnley, 2004). disclosures that had been not used yet in the study of Syabani & Siregar (2013) and Wulandari & Djuminah (2013), which are relative quantity, coverage, depth, and outlook profile of firm risk management dimensions. By using these four dimensions, the study aimed to be able capturing the more comprehensive quality dimensions of risk disclosure (Beretta & Bozzolan, 2004; Miihkinen, 2012).
This study used a descriptive qualitative method to analyze firms’ risk disclosures quality. The data obtained from the firms’ annual report were analyzed by using a semi-objective approach to create a single index amount that represents the quality of risk disclosure, including textual and mechanistic analysis. The relative quantity of risk disclosure represented the mechanistic approach, while the coverage, depthness, and the outlook profile of firm risk management represented textual analysis approach (Beattie et al., 2004; Beretta & Bozzolan, 2004; Miihkinen, 2012).
In general, this study found that the quality of mandatory risk disclosure had a better score compared to the voluntary risk disclosure. Firms were still emphasizing on the number of risk information (relative quantity dimension), but disclosed a few regarding the impact of the risk disclosed to firms’ future performance (depthness dimension) and how firms managed their risk (outlook profile of risk management dimension). The coverage among risk items also still low.
2. Literature Review and Hypothesis Development
The Analysis of Risk Disclosure Quality
emphasizes on the impact of uncertainty that can be managed by firms. Therefore, the study of risk disclosure was to analyze the information regarding firm’s opportunities or prospects, threat
(hazard), danger (harm) or the exposure of the firm disclosed that have potential impact on firm in the future (Linsley & Shrives, 2006).
Table 1
Items of Risk Disclosure
No. Items of Risk Indicators References
A. Mandatory Disclosure Items
1. Financial Risk Credit Liquidity
Market (commodity/present value) Interest rate
Exchange rate Contingent Risk
Bapepam-LK No. KEP-347/BL/2012
PSAK No. 60 (Revisi 2010).
PSAK 57 (Revisi 2009) Linsley & Shrives
(2006) B. Voluntary Disclosure Items
1. Operations risk Customer satisfaction Product development Efficiency and performance Sourcing
Stock obsolescence and shrinkage Product and service failure Environmental
Health and safety Brand name erosion
Linsley & Shrives, (2006)
2 Empowerment
risk
Leadership and management Outsourcing
Performance incentives Change readiness
Communications
Linsley & Shrives (2006)
3. Information processing and technology risk
Integrity
Access
Availability Infrastructure
Linsley & Shrives (2006)
4. Integrity risk Management and employee fraud
Illegal acts
Reputation
Linsley & Shrives (2006)
5 Strategic risk Environmental scan
Industry
Business portfolio Competitors Pricing Valuation Planning Life cycle
Performance measurement Regulatory
Sovereign and political
Linsley & Shrives (2006)
Analysis of risk disclosure in the study included both mandatory that covers financial items and voluntary risk that covers non-financial items which are disclosed in the firm’s annual
items in this study were adopted from Linsley & Shrives (2006) as used by Geraldina et al. (2015). The reason in choosing their study was because of their components were based on ICAEW guidelines risk disclosure framework, enhanced the framework of Beretta & Bozzolan (2004), and adopted by many researchers with few of modification.
In addition, this study used semi-objective analysis by using two approaches which was suggested by Beattie et al. (2004) to the analysis of risk disclosure quality, textual and form-oriented (mechanistic) analysis. Mechanistic approach was conducted by considering the number of sentences that disclose about risk information, while textual analysis was conducted by analyzing the content of sentences that disclose about risk information. Textual analysis was also known as thematic or linguistics analysis.
This study used both mechanistic and textual analysis to analyze the risk disclosure quality.This study used four dimensions of risk disclosure quality, that were: (i) the relative quantity of risk disclosure, (ii) coverage, (iii) depthness, and (iv) the outlook profile of firm risk management. The relative quantity of risk disclosure represented the mechanistic approach, while the coverage, depthness, and the outlook profile of firm risk management represented textual analysis approach (Beattie et al., 2004; Beretta & Bozzolan, 2004; Miihkinen, 2012).
The dimension of relative quantity of risk disclosure was the actual number of firm risk disclosure adjusted by the size and complexity or the industry where the firm operates (Beattie et al., 2004; Beretta & Bozzolan, 2004). The greater relative quantity of risk disclosure of a firm, the higher the risk disclosure quality. Dimension of coverage of risk disclosure captures the concentration of disclosure among risk categories. The higher coverage of disclosure means risk disclosure are not concentrated in a particular type of risk, then the higher the quality of a firm risk disclosure (Beattie et al., 2004; Miihkinen, 2012).
The dimension of depthness of risk disclosure capture the quantitative and qualitative of the economic impact of the risk on firms future performance (Beretta & Bozzolan, 2004; Miihkinen, 2012). The economic impact of these risks can be positive or negative. Dimension of outlook profile of firm risk management was used to capture how management communicates the approach in managing firm risk management. This dimension could be assesed from the current management expectations of future performance and operation of the firm regarding the risk are managed by the firm, the actions or programs or policy taken to address those risks (Beretta & Bozzolan, 2004; Miihkinen, 2012).
Therefore, this study combined the dimensions to measure the risk disclosure quality which were previously conducted by Beretta and Bozzolan (2004) and Miihkinen (2012). Beretta & Bozzolan (2004) used only three dimensions, namely: relative quantity, depth, and outlook profile of firm risk management, but did not use the coverage dimension in measuring risk disclosure quality as proposed by Beattie et al. (2004). Meanwhile, Miihkinen (2012) used four dimensions by adding coverage dimension to measure risk disclosure quality, but did not use relative quantity dimension as used by Beretta and Bozzolan (2004).
3. Research Method Data and Sample
be a medium to communicate the risk that are managed by firms to investors.
16 annual reports were not available and 8 of them could not be used due to the type of files which were not readable by the software. The selection of the period of study was associated with two mandatory risk disclosure regulation which has effective in 2011 and 2012. They are PSAK 57 (Revised 2009) regarding accounting standard on risk contingency, PSAK60 (2010) regarding accounting standard on risk of financial instrument disclosure that was regulated under Bapepam-LK No. KEP-347/BL/2012. The disclosure of contingent risk was included due to this disclosure has potential impact on the firm’s cash flow in the future.
Data Analysis Methods
This study used of descriptive qualitative methods to analyze the data of risk disclosures in each firm’s annual report. The information was analyzed using semi-objectively approach by considering the form-oriented (mechanistic aspects) and textual analysis. In addition, the data were analyzed by comparing the time periods between 2011 and 2012 to address the differences in the application of mandatory risk disclosure. This study also used four dimensions to analyze risk disclosures quality, relative quantity, coverage, depth, and outlook profile of firm risk management. To identify the risk information that was disclosed by firms in their annual reports, this study used NVivo 10 to identify, classify, and disclosure sentences that are adjusted relative to the size of the firm and the industry where the firm operates (Bozzolan, 2004). The greater relative quantity of risk disclosure of a firm, the higher the risk disclosure quality. RQT is measured by
residual value after estimating the number of firms in the same subindustry (IND) and the natural logarithm of the total assets of the firm (LnSIZE) to the actual number of sentences of the firm's risk disclosure as shown in equation 1 below.
Dimension of coverage of disclosure captures concentration or distribution between each category of risk disclosure. The more distribute means risk disclosure are not concentrated in a particular type of risk, the higher quality of firms' risk disclosure (Beattie et al., 2004; Miihkinen,
Pi is the proportion of the number of sentences on the topic of risk disclosures with the total number of sentences of risk disclosure. 1/H is used to demonstrate the greater number of the Herfindahl index, the more extensive the distribution of risk disclosure among topics. This study adjusted the formula of Miihkinen (2012) by sorting the value of the Herfindahl index into percentile values, so-called Coverage Rank (Cov_Rank). This procedure was done in order to create the output value of the coverage - dimension is identical to the three other dimensions which are expressed in the form of a number of sentences. So the value would be in the range of 1-10.
economic impact which are affecting the future the impact of risk to the firm’s future performance, given a value of 1 if the risk disclosure is expressed qualitatively, and a value of 0 if the sentence of j is not expressed either quantitatively or qualitatively.
The dimension of outlook profile (OPR) was used to capture the way of manager communicates the approach which is adopted in managing firm’s risk. The dimension appeared from the manager’s expectation regarding current risk exposure on future operation and performance of a firm, the actions or policies or programs were taken to address the risk(Beretta & Bozzolan, 2004; Miihkinen, 2012).
(5)
is an outlook profile index of firm i; rfli is the number of sentences of risk are disclosed by the firm i; kj is the number of sentences of risk disclosure in the firm's annual report j; ACPijis given a value of 1 if the sentence of j in the annual report of firm j is containing with information relating to the actions or policies or programs are taken to address the risk, and given a value of 0 if otherwise.
The four dimensions of risk disclosure quality above were composed to create a risk disclosure index (RDQI). The indexes were analyzed separately either for mandatory risk disclosure (RDQI_Mand) or voluntary risk disclosure (RDQI_Vol). Mandatory risk disclosure covered financial risk items, while voluntary risk disclosured covered non-financial risk items as presented in Table 1.
(6)
4. Result and Discussion Descriptive Statistics
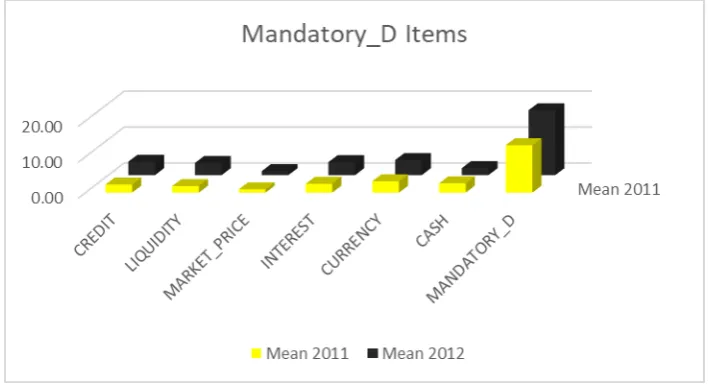
Table 2 presents the descriptive statistics of the risk items and risk quality dimension of the mandatory risk disclosure. Based on the minimum value in Table 2, the data show that several observations did not disclose the six items of the mandatory risk disclosure, neither credit risk, liquidity, market prices, interest rates, foreign exchange rates (currency), or contingent risk item (cash). Of the six items of those mandatory risk disclosures, the mean value of currency risk’s item has the highest score, amounting around 3.69 (4) sentences. Therefore, the currency risk will be discussed further in the next section.
Another interesting finding is the mean value of the actual quantity of risk disclosure (MAND_D) is different from the mean value of the relative quantity of risk disclosure (ABSRQT), respectively are 15.65 (16) and 7.25 (7) sentences. This finding indicates the possibility of firm’s discretion in disclosing the number of sentences of risk that is influenced by the type of industry where a firm operates and the size of a firm.
Table 2
Descriptive Statistics of Mandatory Risk Disclosure Items
Risk Disclosure
Dimensions/Items N Minimum Maximum Mean Std. Deviation
CREDIT 48 0 10 3.00 2.35
LIQ 48 0 10 2.63 2.19
MARKET 48 0 6 1.02 1.21
INTEREST 48 0 12 3.04 2.56
CASH 48 0 29 2.27 5.21
MAND_D 48 0 47 15.65 11.83
TA (Million Rp) 48 2,835,511 111,000,000,000 14,859,567,726.44 23,758,432,507.72
SUBIND 48 3 20 11.21 7.59
ABSRQT 48 .30 27.47 7.25 5.72
DPT 48 0 45 9.88 9.87
COV 48 0.00 .94 .61 0.22
COV_RANK 48 1 10 5.60 2.80
OPR 48 0 21 5.42 3.94
RDQI_MAND 48 3.45 99.47 28.15 16.92
Items of mandatory risk disclosures consist of: (1) credit risk (CREDIT); (2) liquidity (LIQ); (3) the market price (MARKET); (4) interest rate (INTEREST); (5) the change of foreign exchange risk (CURRENCY), and (6) contingent risk (CASH). The five items are measured by the number of sentences which are disclosed by a firm, either is expressed qualitatively, quantitatively, or none both of them. MANDATORY_D is actual sentences of the total number of the six items of the mandatory risk disclosure.
RDQI_MAND is mandatory risk disclosure quality index which is composed by using 4 dimensions, namely: (1) the number of relative quantity of risk disclosure (ABSRQT); (2) depth (DPT); (3) scope/concentration of risk disclosure (COV_RANK); and (4) the outlook profile of risk management (OPR). ABSRQT dimension is measured by the residual value of the quantity relative model, obtained after estimating variable natural logarithm of TA and SUBIND on variable MAND_D. SUBIND is number of firms who compete in the same sub industry. DPT dimension is measured by giving value of 1 if the sentence of the six items of risk is disclosed qualitatively, giving value of 2 if disclosed quantitatively, and giving value of 0 if the sentence is disclosed risk but do not express both way. COV_RANK dimension is measured by forming 10 portfolios (percentile rank) of Herfindahl index for those six items of risk disclosure. OPR dimension is measured by giving a value of 1 if a firm discloses the actions or policies or programs are taken to address the risk, and given value of 0 if otherwise.
Meanwhile, the dimension of depth (DPT) and the OPT are zero respectively. It can be concluded that there were firms who did not disclose those six items of mandatory risk disclosure which discloses the impact of those risks on future firm’s performance, neither qualitatively or quantitatively. In addition, there were firms who did not disclose the actions or policies or programs taken to mitigate those six items of risk. The minimum, maximum, and mean value of COV_RANK dimension are respectively 0,10, and 5.60. The findings suggested that risk disclosure among the six items was fairly distributed among one item to another. The mean value of mandatory risk disclosure quality index (RDQI_MAND) is 28.15 (28) sentences. The lowest value is 3:45 sentences and the highest is 99.47, each of them belongs to PT Steady Safe Tbk. and PT Indosat Tbk.
Table 3 presents the descriptive statistics of the risk items and risk quality dimension of the voluntary risk disclosure. Based on the minimum value in Table 3, the data show that there were observations who did not disclose the five items
of the voluntary risk disclosure items: business risk, empowerment, technology and information, integrity, and strategy items. The mean value of strategy’s risk item has the highest score compared to others, amounting to 18.65 (19) sentences. Therefore, this item will be discussed further in the next section.
mean value of COV_RANK dimension are respectively 0, 10, and 5:58. The findings suggested that risk disclosure among the five items is fairly distributed among one item to another. The mean value of mandatory risk disclosure quality index (RDQI_VOL) is 49.47 (50) sentences. The lowest value is 9:45 sentences and the highest is 151.88, each of them belongs to PT Mitra International Resources Tbk. and PT Telecommunications Indonesia (Persero) Tbk.
From the both descriptive statistics, in general, it can be concluded that firms who engaged in the infrastructure industry have considered the four dimensions of risk disclosure quality. Firms still emphasize on the number of
sentences of risk disclosure, have not yet provided more information on the impact of the mandatory or voluntary risk disclosure on the firms’ future performance, either qualitatively or quantitatively. However, the risk’s information is more disclosed quantitatively rather than qualitatively for mandatory risk disclosure items, but opposite finding for voluntary risk disclosure items. Similarly, the coverage or distribution among risk items for mandatory or voluntary risk disclosure items is not too high or medium. The good news is some firms have disclosed the outlook profile of risk management for voluntary risk disclosure items, although there are some firms did not.
Table 3
Descriptive Statistics of Voluntary Risk Disclosure Items
Variables N Minimum Maximum Mean Std. Deviation
BUSINESS 48 0 48 12.92 11.43
EMPOWER 48 0 13 2.33 2.82
IT 48 0 13 1.79 2.87
INTEGRITY 48 0 54 9.75 11.92
STRATEGY 48 0 67 18.65 17.65
VOL_D 48 0 162 45.44 41.73
TA (Million
Rupiah) 48 2,835,511.00 111,000,000,000.00 14,859,567,726.44 23,758,432,507.72
SUBIND 48 3.00 20.00 11.21 7.59
ABSRQT 48 0.26 75.88 24.68 18.70
DPT 48 0 71.00 12.52 16.62
COV 48 0 0.82 0.55 0.18
COV_RANK 48 1.00 10.00 5.58 2.81
OPR 48 0 69.00 6.69 12.89
RDQI_VOL 48 9.45 151.88 49.47 35.89
Items of voluntary risk disclosure consists of: (1) business risk (BUSINESS); (2) empowerment (EMPOWER); (3) and information technology (IT); (4) integrity (INTEGRITY); and (5) strategy (STRATEGY). The five items are measured by the number of sentences which are disclosed by a firm, either is expressed qualitatively, quantitatively, or none both of them. VOLUNTARY_D is actual sentences of the total number of the five items of the voluntary risk disclosure.
The Quality of Mandatory Risk Disclosure Items
The Dimension of Relative Quantity of Risk Disclosure (ABSRQT)
Table 4 presents the test result of homogeneity of variance for four quality dimensions of risk disclosure and the risk disclosure quality index between 2011 and 2012. The test was conducted as a prerequisite before conduct One Way Anova test that is assuming there is equal variation among the two groups. The result showed that there was equal variation of data of 2011 and 2012 for each variable, except
for the OPR dimension of voluntary risk disclosure. The OPR dimension is only one dimension which is composing the RDQI_VOL index and the variation of RDQI_VOL is equal between data in 2011 and 2012 period, so the One Way Anova test is still continued.
Table 5 presents the result of One Way Anova Test. By using alpha 5%, the result showed that there is no difference in four quality dimensions of risk disclosure and the risk disclosure quality index between the period 2011 and 2012 for mandatory items.
Table 4
Homogeneity of Variance Test
Variables
Mandatory Risk Disclosure Voluntary Risk Disclosure
Levene Statistic Sig. Levene Statistic Sig.
ABSRQT 3.777 .058 1.794 .187
DPT 1.183 .282 .042 .838
COV_RANK .010 .919 .000 1.000
OPR 1.130 .293 4.268 .044
RDQI_MAND .669 .418
RDQI_VOL 1.701 .199
Table 5
Risk Disclosure Quality Between 2011-2012 Period
Variables Mean Square F Sig.
ABSRQT Between Groups 121.716 3.958 .053
Within Groups 30.753
DPT Between Groups 75.000 .766 .386
Within Groups 97.962
COVARIANCE_R ANK
Between Groups .021 .003 .959
Within Groups 7.988
OPR Between Groups .083 .005 .943
Within Groups 15.861
RDQI_MAND Between Groups 7.889 .027 .870
Within Groups 292.225
The result indicated that the difference of the effective period of the implementation for mandatory risk disclosures was not significantly different. The possible explanation for this result was there was a possibility of early adoption for PSAK No. 60 (Revised 2010) and regulation issued by Bapepam-LK No. KEP-347/BL/2012 regarding the disclosure of financial risk. Thus, we can conclude that it would not be a problem including contingency risk items under PSAK No.
57 (Revised 2009) which was becoming effective starting January 1, 2011.
Chart 1
The Comparison of Mandatory Risk Disclosure Quality Indexfor the 2011 & 2012 Period
Chart 2
The Comparison of Actual Number of Risk Disclosure Itemsfor the 2011 & 2012 Period
The Dimension of Depth of Risk Disclosures (DPT)
The dimension of depth (DPT) reflects the impact of risk which disclosed by firms on future performance, qualitatively or quantitatively. Qualitative disclosure is identified in sentences that are contained positive or negative impact of the risk managed by a firm on a firm's future performance. The chart 1 shows the mean value of DPT greater in 2012 compared to 2011 period, although the difference was not significant, as presented in Table 5. The mean value of DPT in 2011 and 2012 period, respectively were 8.63 and 11:13 sentences.
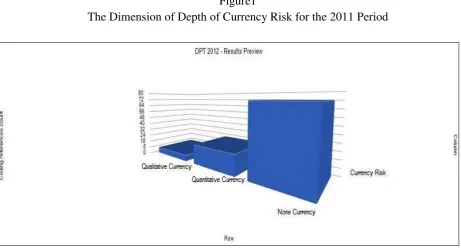
Since the currency item has the highest score compared to five other mandatory risk items, this
item will explore more rather than other items. Figure 1 and 2 showed the disclosure of the currency risk for either in 2011 or 2012 was still emphasizing to disclose risk without adding qualitative and quantitative information to the disclosure’s sentences. In addition, the firms provided more quantitative rather than qualitative information.
This finding at least showed an indication regarding the possibility of firms trying to increase the quantitative information to comply with regulations of financial risk disclosure (PSAK No.
60, 2010 and Bapepam-LK No. KEP-
currency risk has a negative impact and harms the firms.
Figure1
The Dimension of Depth of Currency Risk for the 2011 Period
Figure 2
The Dimension of Depth of Currency Risk for the 2012 Period
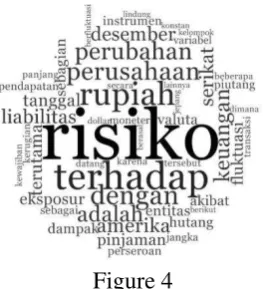
To investigate the narrative disclosure of the currency risk item during the periods, this study identified 50 most frequent words found in the narrative of currency risk disclosure sentences. The bigger the font size, the more often the word found in the currency risk disclosure sentences. Figure 3 and 4 show the identical words. The common words show on both words-clouds are (in Bahasa): “risiko, perusahaan, perubahan,
liabilitas (kewajiban), eksposur, amerika, serikat,
dan keuangan”. In English, those words mean:
Figure 3
Words-Cloud of Currency Risk Disclosure Item for the 2011 Period
Figure 4
Words-Cloud of Currency Risk Disclosure Item for the 2012 Period
Furthermore, those fifty words were used as keywords to explore sentences using those words in the narrative of currency risk disclosure. The result, as shown in the Words Tree (see Appendix 1) showed that firms were not only got exposed from the risk of changes of the USD currency, but also got exposed from the risk of changes in of Japanese Yen currency (JPY). The both currency risk exposures were not only impact on the position of the fair value of liabilities of the firms at current financial position, but also have an impact on the firms’ operation. This happens due to firms used both foreign currencies in their transactions. The impact of currency risk exposure among firms were stated differently. Some firms, state that the impact was significantly harming for them, some of them stated that the impact was still tolerated, some of them state that they were successful to prevent the risk exposure, and some of them did not feel the negative impact of the change of currency risk.
The Dimension of Coverage of Risk Disclosure (COV_RANK)
The dimension of coverage shows the level of concentration of risk disclosure between risk disclosure items. Graph 1 shows the mean values of COV_RANK in 2011 and in 2012 were almost equal, the value was about 5 sentences and the difference was not significant, as presented in Table 5. Since the range of COV_RANK value lies between number 1-10, so if the mean value was about 5 sentences, it showed that the distribution of risk disclosure between items of mandatory risk disclosure was quite good (medium).
numbers of sentence of risk disclosure among those three items was not too wide from one item to another.
The Dimension of Outlook Profile of Risk Management (OPR)
The dimension of outlook profile of risk management (OPR) indicates the existence of plans, policies, actions, or programs taken to mitigate risk. Chart 1 shows that the mean values of OPR in 2011 and 2012 period were almost equal, which was amounting about 5 sentences and the difference was not significant, as presented in Table 5.
Based on Table 2, there were firms who did not disclose information about an outlook profile of risk management (OPR). For the 2011 period, they were PT Wintermar Offshore Marine Tbk, PT Steady Safe Tbk, and PT Jasa Marga (Persero) Tbk. All firms disclose information about an outlook profile of risk management (OPR) for the period 2012.
The similar procedure was conducted as previous section to explore how the firms disclose their OPR (figures of words cloud and words trees are not presented). There were identical words presented on words cloud of 2011 and 2012, such as words (in Bahasa): “risiko, dengan, perusahaan, kebijakan, melakukan, mengelola, manajemen, kredit, likuiditas, eksposur, pinjaman,
kontrak, lindung, etc”. In English, those words
mean: risk, with, firms, policies, conduct, manage, management, credit, liquidity, exposure, loans, contracts, hedging, etc. Those words convey a message that the firms have policies, actions, or programs to mitigate:(i) the credit risk, specifically associated with customers, (ii) foreign exchange risk by conducting hedging contract, and (iii) liquidity risk.
Based on word-trees (the figures are not visualized) shows that firms generally have written
policies or guidelines regarding financial risk management, especially credit risk, liquidity, interest rate, and foreign exchange risk (currency risk). Firms conducted swap contracts to manage interest rate risk and hedging contracts to manage foreign exchange risk. Firms also conducted monitoring on customer credit’s balance to mitigate credit risk, only having transaction with particular parties, and impose the limit of the amount of credit which has been approved by authorities. To mitigate the liquidity risk, firms maintain their cash sufficiently by analyzing the availability of cash flow, monitoring actual cash flows, and maintaining adequate savings.
The Quality of Voluntary Risk Disclosure Items The Dimension of Relative Quantity of Voluntary Risk Disclosure (ABSRQT)
Chart 3
The Comparison of Voluntary Risk Disclosure Quality Indexfor the 2011 & 2012 Period
Chart 4
The Comparison of Actual Number of Risk Disclosure Items for the 2011 & 2012 Period
The Dimension of Depth of Voluntary Risk Disclosure (DPT)
Chart 3 shows the mean value of DPT was greater for 2011 rather than 2012 period, although the difference was not significant, as presented in Table 5. The mean value of DPT for 2011 and 2012 periods were respectively 13:04 and 12 sentences. As an illustration, the strategic risk was the item of risk that is most disclosed by firms both in 2011 and 2012 period. Similar to the currency risk disclosure in the mandatory disclosure items, strategic risk disclosure during both periods is still emphasizing on the number of sentences without adding qualitative and quantitative information. However, firms provided more qualitative rather than quantitative information. This finding is not surprisingly because voluntary risk disclosure items are non-financial risk disclosure. It is not as easy as
financial risk items to disclose the voluntary risk disclosure quantitatively.
regulation risk or government policy risk regarding to the firm’s operation or development of Indonesia that may affect the firm negatively in 2011. The finding supports (the chart is not presented) that regulation's risk indicator (Risiko Regulasi) as one of the most strategic risk which was disclosed by firm in 2011.
On the other hand, the most frequent words disclosed as risk strategy for the 2012 period were (in Bahasa): “dengan, perusahaan, indonesia, bisnis, peluang, pertumbuhan, layanan, dampak, negatif, prospek, investasi, pendapatan, risiko,
etc.”. Those words mean (in English): firm,
Indonesia, business, opportunity, growth, service, impact, negative, prospect, investment, income, risk, etc. Those words conveyed a massage firms who engaged in the infrastructure industry manage risk which were closely linked to prospects, growth, and investment opportunities which may affect the firm's business in 2012 negatively. Those words were usually found in the narrative of plan indicator as one of indicator for strategic risk. This finding supports (chart is not presented) that plan risk indicator (Risiko Perencanaan) as one of the most strategic risk disclosed by firm in 2012.
Based on word trees (figures are not shown), words that were related to the regulation or government policy found on branch of word tree on telecommunications group, Ministry of Energy and Mineral Resources, and MP3EI (Master Plan for the Acceleration and Expansion of Indonesian Economic Development). It indicates that there are regulatory or government policy's risk managed by firms who are engaged in sub-industry of telecommunications, energy, and construction (sub-industry of toll road, airport, harbor & allied products).
Sub-industry of telecommunication has a problem with some regulatory risk, such as changes in regulation of interconnection services which is issued by Ministry of Information and Communication, the telecommunication’s tower regulation risk, and the risk premium message’s
regulation. Based on the policy of the Ministry of Information and Communication in 2011, the rate of interconnection services has fallen around 1.5% to 3%. The new regulation of telecommunication tower allows competitors to utilize tower, which is owned by telecommunications operator. The competitors who do not have their owns tower take advance over firms who have a large network of tower enjoy huge potential cost savings, while the tower owner had already invested heavily to build the towers. Both of these regulations negatively affecting firms’ margin and market share.
On the other hand, sub-industry of toll road, airport, harbor & allied production gain facilities from new regulation. One of program of MP3EI in 2011 (Master Plan for the Acceleration and
Expansion of Indonesian Economic
Development), which is disclosed by firms in their annual report is the accelerated development of highway infrastructure and electricity infrastructure, either by increasing the number of power plants or expanding electricity transmission network. To support the MP3EI program, House of Representative has legalized regulation regarding land acquisition for public used in 2011. The regulation of “Land Acquisition Act” strengthen the legal basis by providing clearer and measurable mechanism in the process of land regarding shortage of supply of natural gas for State Owned Electricity Firm and domestic industry’s need. The program is under supervision of Ministry of Energy and Mineral Resources.
of the gas. The program is under supervision of Ministry of State Owned Firms.
The objective of the programs is to increase the supply of natural gas as well as the exploration activities, so have an impact on the change of business climate in the natural gas industry.
The words-tree for strategic risk item for 2012 period (figure is not presented) describes narration of sentences such as potential, opportunity, growth prospects and investment that firms should consider in planning strategy. The planning strategy better customers based, focus on business expansion, operational cost efficiencies, and build synergy with related parties.
The Dimension of Coverage of Risk Disclosure (COV_RANK)
Dimension coverage for the voluntary risk disclosure items do not much different from the mandatory risk disclosure items as shown on Chart 4.3. The mean value of COV_RANK for the 2011 and 2012 period is equal around 5:58 sentences. The difference is not significant as presented in Table 5. It tells that the distribution of risk disclosure between voluntary risk disclosure items is medium too. item, business risk, and integrity for both periods. The fourth and the fifth rank (second group) alternately occupied in both periods, respectively, are information technology risk and empowerment risk item. It looks like there were large gap regarding the number of sentences of voluntary risk disclosure items between first and second groups.
Based on the distribution among the five items of voluntary risk disclosure and across each sub-item (indicator) for each item in 2011 and 2012, sub-item of strategic risk item looks better than four other voluntary risk disclosure items
(information processing and technology risk, empowerment, integrity, and business risk) in terms of the dimension of relative quantity and coverage (figures are not presented).
The Dimension of Outlook Profile of Risk Management (OPR)
Chart 3 shows that the mean value of OPR in 2011 was higher than 2012, respectively 8.83 and 4:54 sentences. However, the difference was not significant, as presented in Table 5. Not all the firms disclose the outlook of risk management during the periods. The similar procedure is conducted as previous section to explore the narrative of strategic risk disclosure during both periods, then create words-cloud and words-tree (figures are not presented).
There are some similar words on words-cloud for the period 2011 and 2012, such as (in Bahasa):
“risiko, dengan, perusahaan, kebijakan,
melakukan, mengelola, manajemen,
pengembangan, lingkungan, evaluasi, sistem,
karyawan, prosedur, etc”. In English, those words
mean: risk, with, firms, policies, conduct, manage, management, development, environment, evaluation, systems, employees, procedures, etc. It conveys messages that the firms have policies, actions, or program to mitigate environmental risk, resources (human resources/employee), and reputation (control).
After exploring the words-tree for the period
2011 and 2012, to mitigate human
5. Conclusions, Limitations, and Recommendations
The objective of this study was to analyze the quality of mandatory and voluntary risk-disclosure infrastructure listed-firms during the period 2011 and 2012. The risk disclosure quality used four dimensions, namely: the relative quantity, depth, coverage (distribution), and outlook profile of risk management. This study found that firms had considered those four dimensions of quality to disclose their risk, either for mandatory and voluntary risk disclosures.
The dimension of relative quantity of mandatory and voluntary risk disclosures provided a more dynamic result in explaining the quantity of sentences disclosed by firms compared to the actual quantity of disclosure sentence itself. The result indicated that industry competition and the size of a firm affects the firm’s discretion in disclosure information was lack of qualitative and quantitative information regarding the effect of risk which are disclosed by the firms to future performance (the depth dimension). However, quantitative information discloses more rather than qualitative information for mandatory risk disclosure items. The finding was not surprising, since the mandatory risk disclosure items were financial risk items while voluntary risk disclosure items were non-financial items. Thus, qualitative information discloses more rather than quantitative information for voluntary risk disclosure items.
The coverage among risk disclosure items was medium. For mandatory risk disclosure items, the highest score of the actual number of disclosures was currency risk. While for voluntary risk disclosure items, the highest score of the actual number of disclosures was strategy risk. The distribution among sub-items (indicators) of
strategic risk was the highest than any other of voluntary disclosure risk items.
The outlook profile of risk management for mandatory risk disclosure items was better than the voluntary risk disclosure items. In 2011, there were three firms who did not disclose the outlook profile of risk management for mandatory risk disclosure items and there were 6 firms who did not disclose the outlook profile of risk management for voluntary risk disclosure items. In 2012, all the firms disclosed the outlook profile of risk management for mandatory risk disclosure items, but there were eight firms who did not disclose the outlook profile of risk management for voluntary risk disclosure items.
In other words, this study found that mandatory risk disclosure has better quality compared to voluntary risk disclosure. Firms were still emphasizing on the number of risk information (relative quantity dimension), but disclose a few regarding the impact of the risk disclosed to firms’ future performance (depth dimension) and how firms manage their risk (outlook profile of risk management dimension). The coverage among risk items also still low.
These findings provided some practical implications for firms and regulators. In order to increase risk disclosure quality in the future, firms are suggested to increase the depth, coverage, and outlook profile of risk management in their annual reports.
the outlook for a risk management profile of both types of voluntary risk is still inadequate.
This study did not consider the level of accuracy dimension to measure voluntary risk disclosure quality which covers non-financial risk items. The level accuracy dimension provides information regarding the association of non-financial risk information on firm’s future cash flows. The more accurate, the more confident for investor to predict the impact of non-financial risk information on the level of firm’s future cash flows. Therefore, future studies are suggested to consider this limitation.
References
Beattie, V. (2000). The future of corporate reporting: a review article. Irish Accounting Review 7(1) , 1-36.
Beattie, V., McInnes, B., & Fearnley, S. (2004). A methodology for analysing and evaluating narratives in annual reports: a comprehensive descriptive profile and metrics for disclosure quality attributes. Accounting Forum , 205–236.
Beretta, S., & Bozzolan, S. (2004). A framework for the analysis of firm risk communication. The International Journal of Accounting, 39, 265–288.
Berger, T., & Gleißner, W. (2006). Risk Reporting and Risk Reported: A Study on German HDAX-listed Firms. 5th International Conference on Money, Investment & Risk (pp. 1-20). Nottingham: Risk Management Competence Centre Europe.
FRC. (2005). Internal Control: Revised Guidance for Directors on The Combined Code. London: The Financial Reporting Council. Geraldina, I., Rossieta, H., Wardhani, R., &
Fitriany. (2015). The Effect of Risk Disclosure Quality on Shares Liquidity. 10th International Conference on Business and Management Research (p. 91). Lombok: Management Research Centre.
ICAEW. (2011). Reporting business risk: Meeting expectations. Information for better market initiative. UK: Financial Reporting Faculty of ICAEW.
Jensen, M. C., & Meckling, W. H. (1976). Theory of the Firm: Managerial Behavior, Agency
Costs and Ownership Structure. Journal of Financial Economics, 3, No. 4, 305-360. Kim, O., & Verrecchia, R. E. (2001). The relation
among disclosure, returns, and trading volume information. The Accounting Review, 76, 633-654.
Linsley, P. M., & Shrives, P. J. (2006). Risk reporting: A study of risk disclosures in the annual reports of UK firms. The British Accounting Review, 38, 387–404.
Miihkinen, A. (2013). The usefulness of firm risk disclosures under different firm riskiness, investor-interest, and market conditions: New evidence from Finland. Advances in Accounting, incorporating Advances in International Accounting 29, 312–331. Miihkinen, A. (2012). What Drives Quality of
Firm Risk Disclosure? The Impact of a National Disclosure Standard and Reporting Incentives under IFRS. The International Journal of Accounting, 47, 437–468.
Muhammad, F., & Siregar, S. V. (2013). Pengungkapan segmen operasi: Faktor-faktor yang mempengaruhi dan dampaknya terhadap biaya modal ekuitas. Simposium Nasional Akuntansi XVI. Working Papers (pp. 651-676). Manado: IAI KAPd.
Scott, W. R. (2012). Financial Accounting Theory. United States of America: Pearson Prentice Hall.
Shrives, P. J., & Abraham, S. (2013). Improving the relevance of risk factor disclosure in corporate annual reports. The British Accounting Review , 1-17.
Syabani, A., & Siregar, S. V. (2013). Determinants of risk disclosure level: Case of Indonesia. Simposium Nasional Akuntansi XVI (pp. 5285-5303). Manado: IAI KAPd. Verrecchia, R. E. (2001). Essays on disclosure.
Journal of Accounting and Economics, 32, 97–180.
APPENDIX