ANALYSIS OF VITAMIN C LEVEL CONTAINED IN MANGO GADUNG (Mangifera indica L) WITH VARIED
RETENTION TIME
Anjar Purba Asmara
Chemistry Department, Faculty of Science and Technology UIN Ar-Raniry Banda Aceh
email: [email protected]
Abstracts: This research is aimed to determine the level of vitamin C in the mango Gadung which stored as long as 0 days; 1 day; 2 days; and 3 days. It is used iodimetric titration. Standard iodine solution used as titrant while starch as the indicator. Determination of raw normality iodine standardization carried out by titration of iodine with sodium thiosulphate solution primer. Normality primary sodium thiosulphate solution (0.0125 N) are determined through standardized sodium thiosulphate with potassium dichromate. Levels of vitamin C in the fruit is determined by linear regression analysis were made based on the graph of the vitamin C levels versus volume of iodine standard solution which used in the titration. The curve gives the equation as following: y = 413.8 x – 1.238. Levels of vitamin C of mango Gadung which has varied retention time as follows: 0.26% (0 days); 0.22% (1 day); 0.20% (2 days); and 0.16% (3 days).
Keywords: mango Gadung, vitamin C, iodimetric titration, varied retention time.
INTRODUCTION
Vitamins are divided into six types, namely vitamins A, B, C, D, E, and K. The division is based on the chemical structure and its dominant inluences into human body. According to solubility, vitamins can be divided into two groups: fat-soluble vitamins (A, D, E, and K) and water-soluble vitamins (B and C). Fat soluble vitamins are stored by the body for participating stored in body fat. On the other hand, water-soluble vitamins are stored dificulty because they follow the human excretory system. Besides water-soluble, the vitamin is also easily damaged by oxidation, heat, and alkali.
the connectivity of tissue remains normal and helps the healing of wounds. It can not be manufactured by the body. Humans should consume foods that contain this vitamin, namely vegetables and fruits which are brightly colored. Vegetables that contain vitamin C include spinach, broccoli, peppers, cabbage, etc. Fruits that contain vitamin C include mango, pineapple, watermelon, cantaloupe, oranges, etc.
One kind of fruits that contain lots of vitamin C is a mango. The fruit is easily obtainable in the tropics such as Indonesia. Every 100 grams of ripe mango edible supply as much as 41 mg of vitamin C, a young mango and even up to 65 mg. Means, by consuming 150 grams of ripe mango or mango Golek 200 grams (1/2 pieces of small size), the adequacy of vitamin C which recommended for men and women per day (60 mg each) can be met.
By the facts that vitamin C is very important for the body but easily damaged and be lost, it is necessary to study about decreasing of vitamin C levels in mango fruit by variation of retention time. The study was conducted in variation retention time for 1 day, 2 days, and 3 days. The method which used in vitamin C level determination is iodimetric titration with starch as the indicator. Iodimetric titration is one of the method which applied the concept of oxidation and reduction reactions.
METHODS
The variable in this study is the level of vitamin C in the mango Gadung which stored for 0 day, 1 day, 2 days, and 3 days expressed in mass % (w/w). The level has a meaning as the amount of vitamin C in 50 grams of mango titrated by iodimetric method. Instrument validation test aims to determine whether the tools used in this study had a high validation or not. The study was conducted by path ways as following below.
1. Preparation
a. Make a solution of I2 0.1 N.
In 1 liter of solution containing 0.1 grek
I2 (aq) + 2e 2I¯ (aq)
1 grek I2 = ½ mol
0.1 grek I2 = 0.1 x ½ mol I2 = 0.05 mol I2
As much as 12.7 grams of I2 inserted into 1000 mL lask in which already contains 4 grams of KI dissolved in 25 mL of hot distilled water. Whisk until I2 dissolve completely, add distilled water up to the mark boundaries, in order to obtain a solution of I2 with a concentration of 0.1 N. Dilution process in performed to obtain I2 0.01 N. Dilution formula is as follows: V1 x N1 = V2 x N2
V1 x 0.1 N = 100 x 0.01 N V1 = 10 mL
Iod 10 mL of 0.1 N diluted with distilled water until 100 mL, then shaken until dissolved I2. The 0.01 N iodine solution is put in a dark reagent bottle and sealed.
b. Make a 1% starch indicator
Weighing 2.5 grams starch, then placed in a beaker of 250 mL of hot distilled water then added and stirred until dissolved and then added again to the mark of lask, then stored in a sealed bottle.
c. Make a Na2S2O3 solution of 0.1 N
In 1 liter of solution Na2S2O3. 5 H2O containing 0.1 grek.
I
2(aq) + 2S
2O
32-(aq) 2I
-(aq) + S
4O
62-(aq)
1 grek 2 S2O32- = 1 mol
In a 500 mL solution containing = 500/1000 x 0.1 mol = 0.05 mol Mass Na2S2O3. 5 H2O = 0.05 mol x Mr Na2S2O3. 5 H2O
= 0.05 mol x 248 g / mol = 12.4 grams
Weighed 12.4 grams Na2S2O3.5 H2O then diluted with distilled water (that is heated and then cooled) using 500 mL lask. Then add more distilled water to mark boundaries. Na2S2O3 solution is a secondary solution still needs to be standardized normality again to obtain validity as a requirement for standardization solution of I2.
d. Standardization
1) Standardization of Na2S2O3 solution
solution can be calculated by the formula: V1 x N1 = V2 x N2
2) Standardization of iodine solution
Measure 10 mL of Na2S2O3 solution which has been standardized by volume pipette and insert into erlemeyer 125 mL, plus approximately 2 mL of 1% starch solution (enter dropwise). This solution is titrated with a solution of iodine (I2) to the right blue. Normality iodine solution can be calculated by the formula:
V1 x N1 = V2 x N2 e. Preparation of sample
1) Measure Gadung 50 grams of ripe mango, crushed with a blender until it is destroyed, plus 100 mL of distilled water and iltered. The iltrate distillate plus distilled water to a volume of 500 ml. Then take 10 ml and diluted to a volume of 50 mL and put in a dark reagent bottle (A snippet).
2) Measure gadung 50 grams of ripe mango, stored in the open air for one day and then crushed with a blender until it is destroyed, plus 100 mL of distilled water and iltered. The iltrate distillate plus distilled water to a volume of 500 mL. Then take 10 mL and diluted to a volume of 50 mL and put in a dark reagent bottle (snippets B).
3) Measure Gadung 50 grams of ripe mango, stored in the open air for 2 days and then crushed with a blender until it is destroyed, plus 100 mL of distilled water and iltered. The iltrate distillate plus distilled water to a volume of 500 mL. Then take 10 mL and diluted to a volume of 50 mL and put in a dark reagent bottle (snippet C).
4) Measure Gadung 50 grams of ripe mango, stored in the open air for 3 days and then crushed with a blender until it is destroyed, plus 100 mL of distilled water and iltered. The iltrate distillate plus distilled water to a volume of 500 mL. Then take 10 mL and diluted to a volume of 50 mL and put in a dark reagent bottle (trailer D).
2. Implementation of research
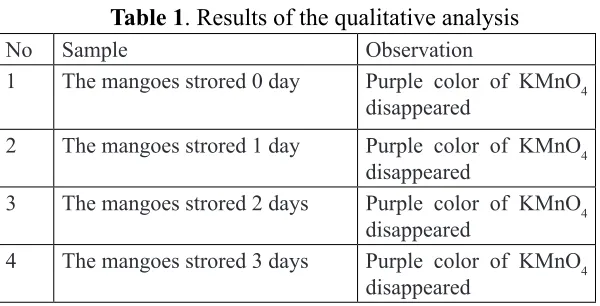
a. Qualitative test
Taking 5 mL iltrate Gadung mangoes stored for 0 day, 1 day, 2 days and 3 days, then drip with KMnO4 solution 0.1 N. When the purple color of KMnO4 solution is disappeared, the sample contains vitamin C.
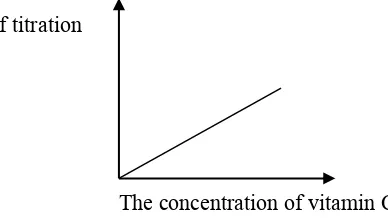
Prior titrate sample solution with a solution of I2, prior to the titration of the standard solution of vitamin C (which the vitamin C standard solution prepared solution of vitamin C 0.02%; 0.04%; 0.06%; 0.08% and 0.1 %), for example vitamin C content of 0.02% was prepared by dissolving 0.02 g of vitamin C in water up to a volume of 100 mL. Results of titration standard solution of vitamin C made chart:
The concentration of vitamin C Volume of titration
Figure 1. Graph of the relationship between volume titration with concentration
From the graph, it obtained the equation y = ax + b.1 Titration done by 3 times for each sample. Taken each 10 mL trailer (trailer A, B, C, and D) and included in erlemeyer 125 mL, each snippet solution is titrated with 0.01 N solution of I2 with starch indicator. It was used a burette 10 mL. From the data volume, it can be calculated levels of vitamin C in the sample using the equation of a line graph of standard solution of vitamin C, ie y = ax + b. By: y is the volume of solution required to titrate I2 footage and x is the concentration of vitamin C in the trailer.
RESULTS AND DISCUSSION
1) Observation Data
a. Qualitative analysis
To test whether or not vitamin C in excerpts, it was carried out qualitative analysis. It used reagent potassium permanganate solution (KMnO4). The results of the qualitative analysis is shown
1Equations of straight lines,
in Table 1.
Table 1. Results of the qualitative analysis
No Sample Observation
1 The mangoes strored 0 day Purple color of KMnO4 disappeared
2 The mangoes strored 1 day Purple color of KMnO4 disappeared
3 The mangoes strored 2 days Purple color of KMnO4 disappeared
4 The mangoes strored 3 days Purple color of KMnO4 disappeared
b. Quantitative analysis of data
1. Before being used to titrate solution of I2, Na2S2O3 solution standardized by 0.01 N K2Cr2O7. The indicator, 1% starch, dripped when titration runs to avoid the complex reactions with 0.01 N K2Cr2O7 solution.
Table 2. Data standardization solution of I2 by K2Cr2O7 0.01 N
No Volume of K2Cr2O7
(mL) Volume of Na2S2O3 (mL) 1
2 3
10 10 10
1.1 0.6 0.7
2. Before used in titration of solution trailer, I2 standardized by 0.1 N Na2S2O3 irst. The indicator dripped when titration running in order to avoid complex reaction with Na2S2O3.
Table 3. Data standardization solution of I2 by Na2S2O3 solution 0.1 N No Volume larutan Na2S2O3 (mL) Volume larutan I2 (mL) 1
2 3
10 10 10
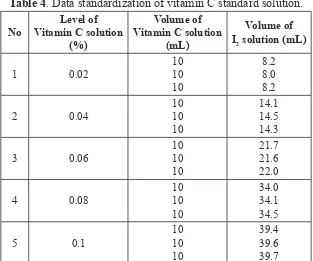
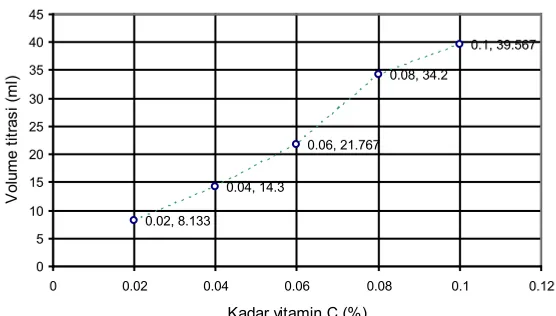
The normality of I2 solution is 0.009146 N. Data of titration standard solution of vitamin C with standard I2 solution used to create graphs of relationship between the concentration of vitamin C (x axis) with volume titration (y axis). The graph is used to determine the linear equation (y = ax + b) which will be used to calculate the levels of vitamin C in solution trailer. Data titration results are presented in Table 4.
Table 4. Data standardization of vitamin C standard solution.
0.02, 8.133
Figure 2. Graph of the relationship between the concentration of vitamin C with volume titration
Graph of the relationship between the concentration of vitamin C and titration volume is presented in Figure 2. The linear regression equation obtained through the calculations is y = 413.8x
– 1.238. The value of rxy = 0.99 where it compared with rtablegiving
r
count > rtable, which means that there is a correlation between levels of vitamin C or concentration and volume titration.2 The equation will then be used to calculate the levels of vitamin C in solution trailer.
3. I2 solution used to titrate solution is a solution of I2 sample 0.009146 N previously standardized by Na2S2O3 solution 0.0125 N.
As much as 10 mL solution of sample taken with a pipette
volume then titrated with a standard I2 solution using 10 ml burette size in order to more thoroughly and with the starch indicator dropped during titration carried out. Titration was done 3 times. Titration results are presented in Table 5.
2Determination of Amount of Vitamin C in a Commercial Product by
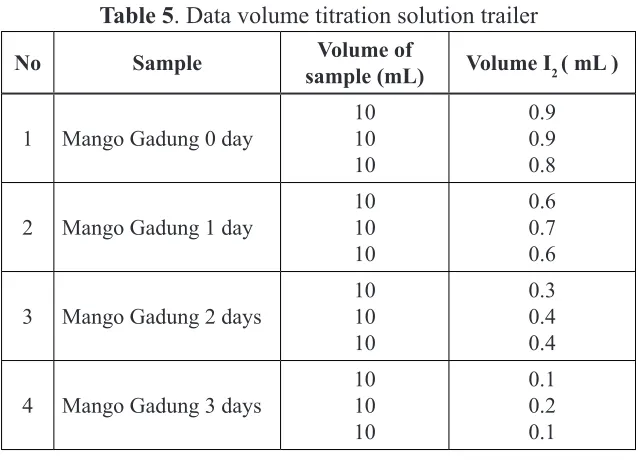
Table 5. Data volume titration solution trailer
No Sample Volume of
sample (mL) Volume I2 ( mL )
1 Mango Gadung 0 day
10
2 Mango Gadung 1 day
10
3 Mango Gadung 2 days
10
4 Mango Gadung 3 days
10
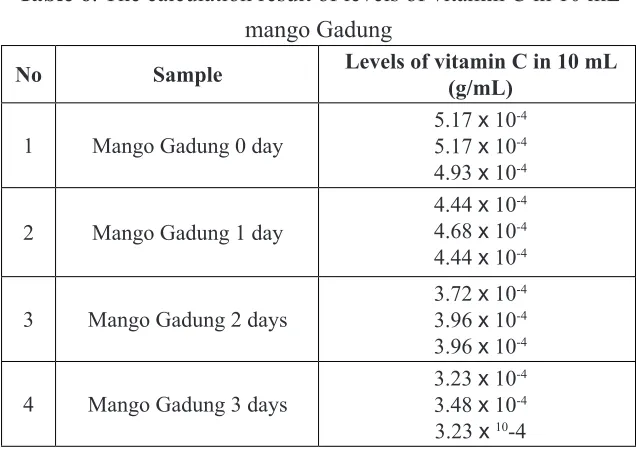
Levels of 10 mg of vitamin C in the trailer can be calculated using linear regression data calculation results are presented in Table 6.
c. Data analysis
According to the Table 6, levels of vitamin C per 50 grams of mango Gadung (a) can be obtained. It is the concentration in 10 mL sample multiplied by the dilution factor, which is 250. It can be used to calculate vitamin C in (w/w) by using formula:3
Levels of vitamin C (w/w) = (
The calculation results be shown in Table 7.
3 Lidia Barreriro & Teresa Naves, Content and Lan-guage Integrated Learning (CLIL) Materials in Chemistry and English: Iodometric Titrations,
www.ub.edu/.../BarreiroNaves-2007CLILChemistryStds.pdf, (online), Accessed on May 29th,
Table 6. The calculation result of levels of vitamin C in 10 mL mango Gadung
No Sample Levels of vitamin C in 10 mL
(g/mL)
1 Mango Gadung 0 day
5.17 x 10⁻⁴ 5.17 x 10⁻⁴ 4.93 x 10⁻⁴
2 Mango Gadung 1 day
4.44 x 10⁻⁴ 4.68 x 10⁻⁴ 4.44 x 10⁻⁴
3 Mango Gadung 2 days
3.72 x 10⁻⁴ 3.96 x 10⁻⁴ 3.96 x 10⁻⁴
4 Mango Gadung 3 days
3.23 x 10⁻⁴ 3.48 x 10⁻⁴ 3.23 x10⁻⁴
Table 7. Levels of vitamin C in 50 grams of mango Gadung
No Sample Levels of vitamin C in 50 grams
of mango Gadung (%)
1 Mango Gadung 0 day
0.26 0.26 0.25
2 Mango Gadung 1 day
0.22 0.23 0.22
3 Mango Gadung 2 days
0.19 0.20 0.20
4 Mango Gadung 3 days
2) Discussion
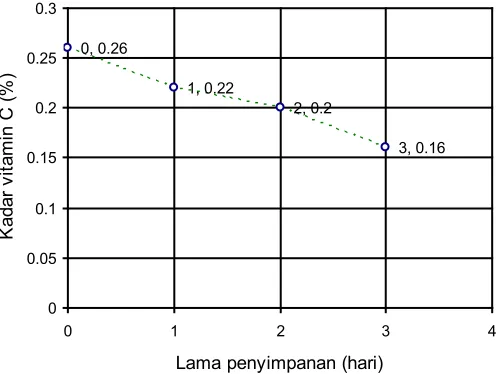
Based on the qualitative analysis data, the mango stored for 0 day, 1 day, 2 day, and 3 day contained vitamin C. This statement is proved by the loss of purple color after added a solution of potassium permanganate (KMnO4). The quantitative gave the values which can be used to obtain the levels of vitamin C per 50 grams of mango Gadung. Then, it can be used to make a graph to retention time in order to show the relationship of the both variables. The graph shown in Figure 3.
0, 0.26
Figure 3. Graph relationship between retention time and levels of vitamin C
This study aims to determine and prove the presence or absence of the effect of storage time on levels of vitamin C in the mango Gadung. It used iodimetric methods, the application of oxidation-reduction (redox), because the titration includes directly titration using a solution of the oxidation potential lower than the iodine-iodide system. It will reduce the iodine into iodide because it is done with the strong oxidizing agent. It used reagent thiosulphate (S2O32-) as oxidizing agent in determining of the standard normality. The reaction is as follows:
The irst step of the experiment is the preparation of a solution of iodine (I2) 0.01 N as titrant. In order to get a valid data, it is necessary to standardize the iodine solution with sodium thiosulphate (Na2S2O3) 0.1 N standardized. A primary standard solution of Na2S2O3 0.1 N was obtained from standardization of the secondary Na2S2O3 solution (12.4 grams of Na2S2O3 crystalline dissolves into 500 mL of distilled water) by a solution of K2Cr2O7 0.01 N. It used 1% starch indicator.
Potassium permanganate (KMnO4) is used to test the amount of vitamin C in the sample solution (qualitative test). Tests conducted by dripping a solution KMnO4 into a pure ascorbic acid (vitamin C standard) and a solution of sample. Based on the observations, addition of KMnO4 into vitamin C standard and the sample showed the disappearing of purple color and the resulting of yellowish white color. The loss of purple proved that the sample which have been stored for 0 day, 1 day, 2 days, and 3 days containing vitamin C qualitatively. The yellowish white color arising due to KMnO4 dripped already exceeded on the equivalent point or all of ascorbic acid has been oxidized to form dehydroascorbic acid. The reaction is as follows:4
The next step is the titration of samples by iodine solution. It produced a blue color at endpoint. Having stopped a few moments, the solution’s color will return to its original state (yellow) but more pale (pale yellow). It shows that the indicator has been hydrolyzed into maltose since acidic conditions. The results of the titration of
4Determination of Amount of Vitamin C in a Commercial Product by
vitamin C standard solution by the iodine solution showed that a greater levels of vitamin C caused the volume of iodine needed to reach the equivalence point is also getting bigger. It happens because iodine included as weak oxidizing agent therefore it takes more iodine to oxidize the greater vitamin C.
The calculation results of vitamin C levels in the mango indicate that longer storage of the samples causing the vitamin C content is decreased. This is caused by:
1. Vitamin C susceptible to irreversible oxidation into dehydroascorbic acid.5
2. Storage in the opened system will cause accelerating of vitamin C oxidation due to room temperature, direct sunlight, and also presence of oxygen.6
3. Time storage of mango will give more time for the course of the oxidation reaction of vitamin C so that vitamin C content got less after stored.
4. Mechanical destruction of the trailer using a blender also reduce the content of vitamin C in the mango due to friction, heat from friction and electric current, as well as the decay of vitamin C when dissolved into the remaining water in a blender.
CONCLUSSION
The study gives information that levels of vitamin C 50 grams of mango Gadung which has varied retention time as follows : zero (0) days: 0.26%; one (1) day: 0.22%; two (2) days: 0.20%; and three (3) days: 0.16%.
5Determination of Amount of Vitamin C in a Commercial Product by
Redox Titration, www.webassign.net/labsgraceperiod/.../lab_14/manual.pdf, (online), Accessed on 29th, May 2016.
6Determining the Amount of Vitamin C (Ascorbic Acid) in a
Bibliography
Anna Poedjadi. (1994). Dasar-Dasar Biokimia. Jakarta: UI Press. Determining the Amount of Vitamin C (Ascorbic Acid) in a Sample,
www.sardissecondary.ca/.../default/.../Chemistry%20 12%20-%, (online), Accessed on 29th, May 2016.
Anitra C Carr and Balz Frei, Toward A New Recommended Dietary Allowance for Vitamin C Based on Antioxidant and Health Effects in Humans, Am J Clin Nutr 1999;69:1086–107. Dina Eriana I. (2007). Pengaruh Lama Penyimpanan Terhadap
Kadar Vitamin C pada Buah Labu dengan Metode Iodometri.
Laporan Penelitian. Yogyakarta : FMIPA UNY.
Lidia Barreriro & Teresa Naves, Content and Language Integrated Learning (CLIL) Materials in Chemistry and English: Iodometric Titrations, www.ub.edu/.../ BarreiroNaves2007CLILChemistryStds.pdf, (online), Diakses pada 29 Mei 2016.
Hanny. (2001). Mangga Kaya Antioksidan Betakaroten. Jakarta : Kompas edisi Rabu 19 Desember 2001.
Harjadi. (1999). Ilmu Kimia Analitik Dasar. Jakarta: Gramedia. Lehninger. (1990). Dasar-Dasar Biokimia. Jakarta : Erlangga.
Equations of straight lines, www.mathcentre.ac.uk/resources/.../ mc-ty-strtlines-2009-1.pdf, (online), Diakses pada 29 Mei 2016.
Determination of Amount of Vitamin C in a Commercial Product by Redox Titration, www.webassign.net/labsgraceperiod/.../ lab_14/manual.pdf, (online), Accessed on 29th, May 2016. Winarno. (1994). Kimia Pangan dan Gizi. Jakarta : Gramedia
Pustaka.
http://www.webmd.com/vitamins-and-supplements/nutrition-vitamins-11/fat-water-nutrient?page=2. Accessed on May 22th, 2016.