Persidangan Kebangsaan Ekonomi Malaysia ke VIII (PERKEM VIII) “Dasar Awam Dalam Era Transformasi Ekonomi: Cabaran dan Halatuju” Johor Bahru, 7 – 9 Jun 2013
Evaluation of Syariah Mutual Fund Performance: Empirical Study
in The Indonesia Stock Exchange
Marlina Widiyanti
Finance Management Programme, Faculty Of Economic,
Universitas Sriwijaya, Sumatera Selatan, Indonesia
Muhammad Adam
Finance Management Programme, Faculty Of Economic,
Universitas Sriwijaya, Sumatera Selatan, Indonesia
Abdul Ghafar Ismail Economic Programme, Faculty Of Economic,
Universiti Kebangsaan Malaysia, Bangi 43600 Selangor, Malaysia
ABSTRACT
Focusing of this study is portfolio evaluate its performance evaluation of mutual fund performance (portfolio) are specifically just measure of return and risk of portfolio investment (funds) in indonesia stock exchange period of 2005 until 2011. The sample choosing based on method purposive sampling with seven stock fund industry as samples than 16 stock fund syariah existing mutual fund shares and 14 conventional. According to Fabozzi (1995) baseline performance can be conducted by way of comparing benchmark (Yardstick) or comparable rate of return and risk each funds and using performance indicators by Sharpe, Treynor, and Jensen. Benchmark in performance evaluation should really represent portfolio investment policy of portfolio, and according to purpose resurfacing than investment (Sharpe, et al.1999). Benchmark based on heaviness using capitalization all shares so that it becomes yardstick performance all share. Results found in January 2005 until December 2011 average rate of return and risk a mutual fund shares conventional higher than the rate of return and market risk (IHSG). We find is mutual fund shares 9 % average return of conventional produce lower than the market (IHSG). Mutual fund shares 6 % of conventional risk average yields lower than market risk. Value of market risk resulting 0.07273. While average rate of return and risk a mutual fund shares syariah lower than the rate of return and market risk (JII). Fund stock average return syariah produce lower return than the market. While market value return generated by 0.01682. 38 % average risk that produces higher risk than the market (JII).Value of market risk resulting 0.07768.
Keywords: Mutual fund syariah, mutual fund conventional, market share, benchmark.
PRELIMINARY
The rise of islam in Indonesia economic this phenomenon adult being attractive and exciting especially for Indonesia population that is predominantly sunni muslems. The practice of conventional economic activity especially in the stock-market contains elements of speculation as one of its components will still become psychological barriers for muslems to also active in investment especially in the field of capital market.
The basic principles distinguishing syariah funds with conventional is that funds their investment portfolios, in managing syariah funds not only consider return or return rate of investment merely, but also consider legal of instruments to be bought, that is not an instrument that produces usury. Moreover if instrument bought the stake, instruments the company it is a company not associated either directly or indirectly, with things like alcohol cigarettes gambling, armament, nuclear project pornography, prostitution and other respects illegitimated by islamic syariah.
The principles guiding Islamic banks are significantly different from those for conventional banks. Islamic banks are organized under and operate upon principles of Islamic law (the Syariah) which requires risk sharing and prohibits the payment or receipt of interest (riba). In contrast, conventional banks are guided mainly by the profitmaximization principle. If the differences between the two types of banks are not just semantic (as some critics of Islamic finance have maintained), Islamic and conventional banks should be distinguishable from one another on the basis of financial information obtained from company balance sheets and income statements. However, since all banks operate in the same competitive environment and are regulated in the same way in most countries, it is possible that Islamic and conventional banks display similar financial characteristics.
It is generally believed that the role of Islam is paramount in the operations of Muslim economies. For instance, Baldwin (1990, p. 34) notes: ‘‘In Islam, there are no concepts of ‘mosque’ and ‘state’ as specially religious and political institutions. Religion and state are believed to be fused together; the state is conceived as the embodiment of religion and religion as the essence of the state.’’ Stepan (2000) argues, however, that such a statement has little theoretical meaning; furthermore, in present times few current Muslim states have featured the type of theocratic government implied by this statement, other than Iran and Taliban Afghanistan.
For the most part the discussion of economic matters in the Qur’an is sufficiently general that it is very difficult to derive from it many testable propositions about the economic system or the performance of Muslem economies, just as it is very difficult to derive from the New Testament similar propositions for predominantly Christian countries. Nevertheless, Muslim doctrines of possible relevance to the economy have been drawn from passages in the Qur’an, various Had_ith and Sunnah (short texts concerning customs of the Muslim community, as well as sayings of Muhammad and legends about his life), the Shari’ah (Muslim laws and their interpretation), and the Ijma_’ (consensus of the religious authorities).
Difficulties for Muslim policy makers arise because many of these doctrinal sources and their interpretation by the major schools of Muslim jurisprudence often do not completely agree with each other on specific issues, especially those not explicitly covered in canonical texts, or leave many issues open. In this regard Abdul-Rauf (1979, p. 14) notes: ‘‘The Muslim doctrine of economics permits degrees of individual freedom and state intervention, but leaves the determination of these degrees to the wisdom and conscience of those involved, who should take current conditions into account. This flexibility has made Muslim economies open to alternative options within its framework.’’
See the diversity of Indonesian people with different interests existing invest, towards a goal then the presence of funds conventional and mutual fund industry investment will further increase multiple diverse instruments available for indonesians. Thus the purpose funds trying to help and mobilizing financier small or individual in investing in capital markets, can be realized soon with the increasing number of parties can participate in various investment investment in accordance with diverse goals and values held.
One indicator to measure the progress of a country lies in capital market instruments level variation investment available. The more advanced capital market the varying capital market instruments and more varied instrument traded on exchanges. More instruments offered will make many option for investors and the possibility the market in demand by investors both local and foreign. Capital market instruments large, divided into two groups namely instrument possession (equity), as stock and debt instruments such as bonds. In addition to shares and bonds, capital markets also have other instrument like mutual funds, asset-backed securities and rights (Suta & Ramaniya warrants quoted in Widjaja 2006).
One of the instruments to perform appertain investment in capital markets are safe enough funds. Invested in a mutual fund in principle is diversified investments namely an investment in several tools spread traded investment in capital market as of stocks and bonds. With these investors can minimize the possibility that will arise, risk if one instrument investment losses can still be neutralized with advantage obtained from other instruments investment (Waelan, 2008).
important thing to do. Measurement of mutual fund performance is not solely based on the rate of return (return) obtained, because the position or rank the performance of a mutual fund more dependent on target level risks (risk) contained in the funds, portfolio analog the current market (Rahmad Hidayat, 2011).
THEORITICAL PORTOFOLIO SYARI’AH AND CONVENTIONAL
According to article 95/1 no.8 law on capital market funds ( investment fund / mutual fund ) can be defined as a container used for collecting fund from public financier henceforward effect by invested in portfolio investment managers. In this sense contained three essential elements. First, the fund from public financier (investor). Second, the fund invested in portfolio effect, the assemblage (combination) securities or effect managed. Third, the funds managed by investment managers. Funds administered by investment managers are owned by joint of the financier, and investment managers are parties entrusted to manage or the fund invested in a mutual fund (Ilyas, quoted in Ramaniya & Widjaja, 2006).
The basic principles distinguishing syariah funds with conventional is that funds their investment portfolios, in managing syariah funds not only consider return or return rate of investment merely, but also consider legal of instruments to be bought, that is not an instrument that produces usury. Moreover if instrument bought the stake, instruments the company it is a company not associated either directly or indirectly, with things like alcohol cigarettes gambling, armament, nuclear project pornography, prostitution and other respects illegitimate by Islamic syariah.
While conventional funds not accommodate things that concern among investors funds syariah. See the diversity of indonesian people with different interests existing invest, towards a goal then the presence of funds conventional and mutual fund industry investment will further increase poly instruments available for indonesians. Thus the purpose funds trying to help and mobilizing financier small or individual in investing in capital markets, can be realized soon with the increasing number of parties can participate in various investment investment in accordance with diverse goals and values held. In indonesia means the issuance and trading stock focusing on open end funds or kind of open funds (Satrio, 2005). The funds self-circulating indonesia market shows growth encouraging. Until the end of December 2011 the existing funds reach 765 funds. As shown in the table below: Shares provide funds growth potential investment value greater than with the other with mutual funds assets rp 60,4 trillion ( 30 % ). Mutual fund shares being alternate attractive to investors with growth potential investment value greater.
The funds self-circulating Indonesia market shows growth encouraging. Until the end of December 2011 the existing funds reach 765 funds. As seen on the Table 1. Shares provide funds growth potential investment value greater than with the other with mutual funds assets 60,4 trillion (30%). Mutual fund shares being alternate attractive to investors with growth potential investment value greater.
Research on mutual fund performance many undertaken in indonesia and some other country. Research conducted abroad by, among others Mansor and Ishaq (2009) declaring that the fund ' s better than the market. Mansor and Ishaq do research aimed to evaluate its performance and prospects for 1999 syariah funds until 2009. This research shows that generally average the performance of stock fund syariah better than benchmark KLCI ( Fadillah Fansor & M. Ishaq bhatti, 2010).
While in Indonesia research has been carried by Ambarwati (2007) and Sri (2010) obtaining results that average return fund stock market was sitting on the conventional (IHSG). Andi Wijaya (2008); found that risk and return the funds conventional stock higher than the rate of return and market risk (IHSG). Wardjianto (2005) obtaining results that average return stock portfolio syariah lower than the market (JII). Arman (2007) found that risk funds rate of return and syariah stock lower than the rate of return and market risk (JII).
Bencmark
second benchmark heaviness based on using capitalization all shares so that it becomes yardstick performance all shares (source: BEI).
Return Mutual Funds and Return Benchmark
a. Return mutual fund Return mutual funds constitute an added value which is expected to be acquired by the investor at the end of a certain period as a result of ownership on the instrument it’s invest. Return mutual funds according to Jogiyanto (2007: 109):
Return Benchmark
Return benchmark is a set of abilities or achievements work accomplished by comparison (benchmark) shown from the market return (market performance) according to the type of mutual fund that is observed. Measurement of the return is used to compare with the market return stock mutual funds, mutual funds and fixed income mutual funds mix based on the method of measurement used, included on the variable market for contrast (benchmark) in accordance with the respective type of mutual funds (Pratomo and Ubayd Allah, 2009).
Risk Free
Investment is risk-free (the risk free asset) by definition have a definite return, asset of this type must be a fixed yield securities that do not have the possibility of default. Because of all the securities of the company in principle has the possibility of default, the risk-free asset cannot be published by companies, but should the securities issued by the Government (Sharpe, 1997).
Elfakhani Hassan (2005) concluded that the performance of Shariah-compliant mutual fund better in the results as well as some of the risk. Fadilla Mansor (2011) examines the performance of mutual funds shares include the market bullish and bearish, obtained results that conventional mutual fund performance no better than syariah stocks mutual funds. Similarly, research conducted by Arman (2007) and Andi Wijaya (2008) by doing a comparison of the performance of the Shariah with stock mutual funds stock mutual funds shows that the performance of conventional mutual funds shares better than the performance of conventional mutual funds shares. Where the performance of mutual fund shares still underperformed the majority of Syariah compared to stock mutual funds.
METHODOLOGY
The measurement of the performance of mutual funds according to Fabozzi (1995) can be done by comparing directly with its benchmark or comparison by looking at rates of return and risk of each investment fund and basing his calculations on the size of the performance of Sharpe, Treynor, Jensen. Researchers will compare the performance of conventional stock mutual funds with stock mutual funds a Shari'ah listings in Indonesia stock exchange period 2005 up to 2011.
The Data used in this study, is the Net Assets value of the data (NAB) monthly for the period 2005-2011. While data on the development of the composite stock price index (IHSG) and the Jakarta Islamic Index (JII) monthly period 2005-2011. The number of samples used in the study was derived as much as 21 (14 conventional stock mutual funds, and stock mutual funds 7 Syariah) as in the table below: Table 2 Sample Conventional Stock mutual funds.
Method of measurement of Sharpe or Reward-to-Variability Ratio (RVAR). This method measures the difference in return with a risk-free interest rate (excess return) a portfolio of standard deviation or total risk (Jones, 2000 & Sharpe, 1999). In the performance measures the size of the Sharpe, Sharpe or value if it has a large value of the RVAR Sharpe index market. The larger the value of Sharpe a mutual fund, then it shows a better performance of mutual funds.
The method of measurement or Reward to Valatility Treynor Ratio (RVOL) States the ratio of excess return of a portfolio of beta (Jones, 2000). Like the RVAR, RVOL reveals the relationship between the return on a portfolio of risks. But, RVOL distinguish between systematic risk and risk, assuming the portfolio has diversified with good, so do not use the standard deviation RVOL but simply beta or this systematic risk. Treynor index measurement of it can be seen the higher numbers of such mutual fund index then the better the performance.
approach of the CAPM is the expected return is the return on a future date, but the rate of return should have happened based on the level of risk in the past (Jones, 2000). Jensen argued that a good guard fund is the performance of mutual funds that have the performance of the portfolio exceed market performance according to the systematic risk. The index is often also referred to as Jensen Jensen alpha. Of measurement index Jensen can be seen that the higher the index number then mutual funds are the better the performance.
Data Analysis using a Method of Analysis of The Difference in Performance to Conventional Stocks Mutual Funds with Syariah Stock Mutual Funds Performance
1. Look for return every guard fund every month.
Ri Monthly = Where:
Ri = actual return from reksa dana i
NABt = Activa value clean at time G
NABt – 1 = Activa value reksa pada waktu sebelumnya
1. Find the average return mutual funds per month from each mutual fund. Above average return mutual funds per month is calculated by using the Microsoft Excel function enables the average or median of individual mutual funds.
2. The formula to calculate the standard deviation:
Where:
σ = deviasion standard Ri = return ke i R = everage return N = total monitoring
3. Beta calculate with formula (Sharpe, et all, 2000):
Where:
βiI = beta portfolio
σiI = kovarians phase of return portfolio i with portfolio market σ2
I = varians of portfolio market
5. Look for returnbenchmark IHSG dan JII every month
where:
KIHSG = Return IHSG
IHSGt = Return market IHSG last month IHSGt-1 = Return market IHSG last month before
where:
JIIt = Return Pasar JII akhir bulan
JIIt-1 = Return pasar JII akhir bulan sebelumnya
6. Find return benchmark JCI and JII per month. Above average return mutual funds per month is calculated by using the Microsoft Excel function enables the average of each mutual fund.
7. Look for return risk free SBI.
Where:
Rf = Return investment free risk
RF1t , RF2t , RFnt = Rate of SBI period t
n = Total of investigate
8. Look for the performance of each investment fund and benchmark its performance evaluation of mutual funds:
a. Sharpe measure size
Where:
RVAR = value risk Sharpe
RP = everage grade investigation portfolio RF = everage risk free rate
RP - RF = excess return portofolio about risk free rate σP = total risk or standar deviasi portofolio
b. Performance Measures Treynor
Where:
RVOL = value risk Treynor RP = everage rate of portfolio RF = rata-rata risk free rate
RP - RF = excess return portfolio terhadap risk free rate βP = beta or systematic risk of portfolio
c. Performance Measures Jensen α = (Rp – RF) –(β(Rm – RF)) where:
α =value riskJensen Rp everage rate of portfolio RF = rata-rata risk free rate
Rm = rata-rata tingkat pengembalian pasar β = beta atau risiko sistematik suatu portofolio
REPORT
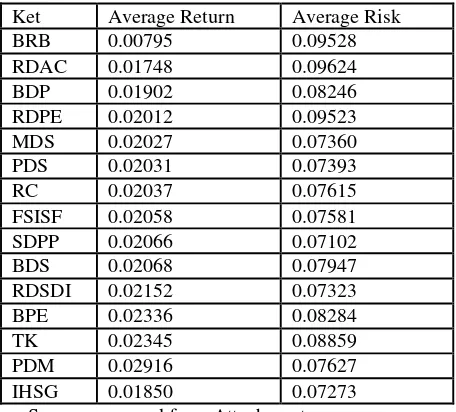
A descriptive analysis of the Return and the Risk of conventional stock mutual funds this research aims to find out how the performance of conventional stock mutual funds during January 2005 up to December 2011. Before going to first see the description of the average return and the average risk of conven A descriptive analysis of the Return and the Risk of conventional stock mutual funds this research aims to find out how the performance of conventional stock mutual funds during January 2005 up to December 2011. Before going to first see the description of the average return and the average risk of conventional stock mutual funds as follows:
Based on the results of the descriptive statistics in table above can be explained that in the period from January 2005 until December 2011, the average return mutual fund shares of conventional higher than market return. Individually, only 9 % of conventional stock mutual funds that generate an average return is lower than the return. The return value is the resulting of 0.01850. While the average stock mutual fund risk higher than conventional risk market. Individually, only 6% of conventional stock mutual fund that produces an average risk is lower than the risk. The value of risk generated by 0.07273.
A descriptive analysis of the Return and the Risk of Islamic stock mutual funds this research aims to study how Sharia stock mutual funds performance during January 2005 up to December 2011. Before going to telebih before seen descriptions of average return and the average stock mutual fund manager of Sharia and JII as follows:
Based on the results of the descriptive statistics in table above can be explained that in the period from January 2005 until December 2011, the average stock mutual fund return lower than the return of Sharia. The return value is the resulting of 0.01682. While the average stock mutual fund risk syariah lower than risk. The value of risk generated by 0.07768.
The performance of stock mutual funds to conventional methods used to measure the performance of Conventional stock mutual funds and mutual fund Shares of Sharia in this research is a method of Sharpe, Treynor, Jensen. Of processing with the use of the methods of value obtained third Sharpe, Treynor, Jensen as follows:
Analysis of the rate of Return and Risk mutual funds shares of conventional and Syariah Stocks mutual funds
A. Rate of Return and Risk of conventional Mutual Funds Shares
Based on the results of the research done on the average return and the risk of conventional stock mutual funds, found that the average rate of return and risk of conventional stock mutual funds are higher than the market rate of return and risk. Empirical evidence supports the research that has been done by Ambarwati (2007) and Sri (2010) the results of research that the average return mutual fund shares is above the conventional market return. And Andi Wijaya (2008), found that the rate of return and risk of conventional stock mutual funds are higher than the market rate of return and risk.
B. Rate of Return and Risk of Syariah Stocks mutual funds
The existence of a positive relationship between return and risk in investing is known for its high risk-high return, meaning that the greater the risk to be borne, the greater is the return generated. Return the result from investments. Return can be either return the realization that this has happened or return expectations that have yet to happen but that is expected to happen in the future. While the risk of the portfolio consists of the systematic risk and not systematic. The second risk is often referred to as the total risk (Jogiyanto, 2003). Any investor who invested in mutual funds, including of course expect a high rate of return, however, to achieve a high level of return is not an easy thing, because each investment will be exposed to the risk or risk. Where any investment that has a high rate of return, then the risk or risks that must be borne by the investor are also high. Vice versa, an investment with a low rate of return will be exposed to levels of risk or a low risk.
Rate of return and risk of each mutual fund is not the same, this can be caused by many factors, both from within and from outside the investment management company. Nevertheless, the risks of investing in mutual funds can be minimized by diversifying investments. Therefore, a manager must be able to manage the Investment performance of mutual funds with good in order to generate mutual funds that have high rates of return by level of risk (risk). The choice of investment in mutual funds depend also dipengeruhi by each investor's preferences towards risk (risk). This is the investment manager role to assist investors in selecting the types of mutual funds in accordance with the characteristics of the owners of capital investment.
CONCLUSION
From the results of this study found that of the conventional stock mutual funds overall, from January 2005 up to December 2011, the average return on the market return. As well as the average risk on top of risk market. As for the whole syariah stocks mutual funds from January 2005 until December 2011, Syariah stocks mutual funds had an average return under the market return. As well as the average risk under risk market.
Results of the comparison of the performance of conventional stock mutual funds with stock mutual funds performance of Syariah with three measurement methods, namely the performance of mutual funds that Sharpe, Treynor method, and Jensen found that the performance of conventional mutual funds shares better (outperform) compared to stock mutual funds. The performance of mutual funds over a period of research is highly influenced by the performance of the market, and the risk-free interest rate.
The results found that in Indonesia Islamic mutual funds can only put their money into investment instruments are free from riba and practices is not permissible according to Shariah. However, there are still obstacles for Shariah-compliant mutual funds to obtain optimal return because the number of shares outstanding of Sharia be limited compared to the conventional Stock mutual funds.
Based on the results of different trials performance return and risk for the data in this study, muslim and non-Muslims to investors or potential investors Muslims and non-Muslims need not worry to choose Islamic mutual funds as an option to invest, because of the risk of lower syariah mutual funds especially in the period of crisis, Islamic instruments are more safe from speculative practices. Especially for entrepreneurs in muslim countries that the majority of the inhabitants are muslim, will certainly be more feel calm if invested with the syariah-based instruments as well as more easing liver because it has gone through the process of cleansing to cleanse the income deemed to accrue from illegitimate activities.
This results research similary conducted by Fadilla Mansor (2011) examines the performance of mutual funds shares include the market bullish and bearish, obtained results that conventional mutual fund performance no better than syariah stocks mutual funds.
REFERENCE
Albaity, M. & Ahmad, R. 2008. Performance of Syariah and Composite Indices: Evidence from Bursa
Malaysia. Asian Academy of Management Journal of Accounting and Finance.
Baasir, F. 2004. Prospek dan Risiko dalam Investasi Syariah. Pikiran Rakyat. 1 Maret 2005.
http://www.pikiran-rakyat.com/cetak/0304/01/0802.html diakses 3 Oktober 2011.
Bank Negara Indonesia. 2011. Reksa Dana Syariah. http://www.bni.co.id/produklayan/p_syariah.html diakses 23 September 2011.
BAPEPAM. 2009. Panduan Reksa Dana. Jakarta: Badan Pengawas Pasar Modal. Jakarta. Diakses dari http://www.bapepam.go.id, tanggal 3 Oktober 2011.
_______.2005. Statistik Pasar Modal. Jakarta: Badan Pengawas Pasar Modal. Jakarta. Diakses dari http://www.bapepam.go.id, tanggal 3 Oktober 2011.
_______. 2011a. Reksa Dana Yang Aktif Berdasarkan Manajer Investasi 2005 – 2011. Jakarta: Badan Pengawas Pasar Modal. Jakarta. http://www.bapepam.go.id, diakses 3 Oktober 2011.
_______. 2011b. Nilai Aktiva Bersih Reksa Dana 2005 – 2011. Bapepam – LK. 2010. Siaran Pers Akhir Tahun 2010. Jakarta.
Elfakhani, Said. & Hassan, M.K. 2005. Comparative Performance of Islamic Versus Secular Mutual Funds. 12th Economic Research Forum.
Fabbozi, Frank. 1995. Investment Management. New Jesey: Printice- Hall.
Ghozali, Imam, 2005, “Aplikasi Analisis Multivariate Dengan Program SPSS”, Badan Penerbit Universitas Diponegoro, Semarang.
Hesham, M & Hassan, K.M. 2010. Performance of Islamic Mutual Funds in Saudi Arabia. International Conference on Islamic Economics and Finance
Hidayat, Rahmat. 2011. Dana Kecil Dengan Investasi Reksa Dana Syariah. http://www.dana-kecil-dengan-investasi-reksa-dana.html, diakses 24 Februari 2012.
Islam, M. (2003). Development and performance of domestic and foreign banks in the GCC countries. Managerial Finance, 29(2/3), 42−72.
Jones, Charles P (2000), Investment: Analysis And Management, 10th ed, Jon Willy and Sons: New York.
Mansor, Fadillah. 2011. Kinerja Reksa Dana Syariah Malaysia Selama Kondisi Pasar Bullish dan Bearish. Konferensi Internasional Bisnis dan Penelitian Ekonomi
Mansor, Fadillah dan Ishaq M. Bhatti. 2009. Kinerja Reksa Dana Syariah Malaysia. Konferensi Tahunan Perbankan dan Keuangan
Pesaran, M., & Timmermann, A. (1992). A simple nonparametric test of predictive performance. Journal of
Business and Economic Statistics, 10(4), 461−465.
Rachmayanti, T. Farida. 2006. Analisis Kinerja Portofolio Saham Syariah Pada Bursa Efek Jakarta 2001-2002. Jurnal Ekonomi Keuangan dan Bisnis Islami, Vol. 2. No. 3, Juli-September. Rudiyanto. 2012. Mengenal Evaluasi Kinerja Reksa Dana. http:// Rudiyanto » Mengenal Metode
Evaluasi Kinerja Reksa Dana.htm, diakses 26 April 2012.
Sharpe, William F., Gordon J. Alexander dan Jeffery V. Bailey. 1999. Investasi. Terjemahan oleh: Hendry Njooliangtik dan Agustino, Jilid 1. Dadi Kayana Abadi. Jakarta.
Siagian, Victor. 2006. Penggunaan Metode Jensen Dalam Pengukuran Kinerja Reksa Dana: Studi
Kasus Tujuh Reksa Dana Saham. Jurnal Akuntabilitas (September): 22 – 33.
Tandelilin, Eduardus. 2010. Portofolio dan Investasi Teori dan Aplikasi, Edisi Pertama. Kanisius:Yogyakarta.
Treynor, J.L. 1965. How to Rate Management Investment Funds. Harvard Business review 43. January- February p: 63 – 75.
Undang- Undang No. 8 tahun 1995 Tentang Pasar Modal. Jakarta. http://www.investorindonesia.com, diakses 3 Oktober 2011.
Waelan. 2008. Kemampuan Memilih Saham dan Market Timing Manajer Investasi Reksa Dana Saham di Bursa Efek Indonesia. JAAI, Volume 12 No 2. (Desember): 167 – 176.
TABLE 1: Amount Stocks Mutual Funds And Net Asset Value
No Mutual Funds Account Value Net Activa
1. Fixed Revenue 106 Rp 28,4 triliun
2. Stock Exchange 78 Rp 60,4 triliun
3. Money Market 29 Rp 9,6 triliun
4. Mixed 91 Rp 21,4 triliun
5. Protection 316 Rp 40,4 triliun
6. Indeks 1 Rp 0,106 triliun
7. Syariah– Fixed Revenue 8 Rp 0,571 triliun
8. Syariah – Stock Exchange 11 Rp 0,918 triliun
9. Syariah – Mixed 16 Rp 1,767 triliun
10. Syariah – Protection 14 Rp 2,085 triliun
11. Syariah – Indeks 1 Rp 0,130 triliun
12. ETF 2 Rp 0,563 triliun
13. PT 92 Rp 35,2 triliun
Total 765 Rp 201,53 triliun
Source : Data at December 2011. Bapepam-LK, report last year 2011.
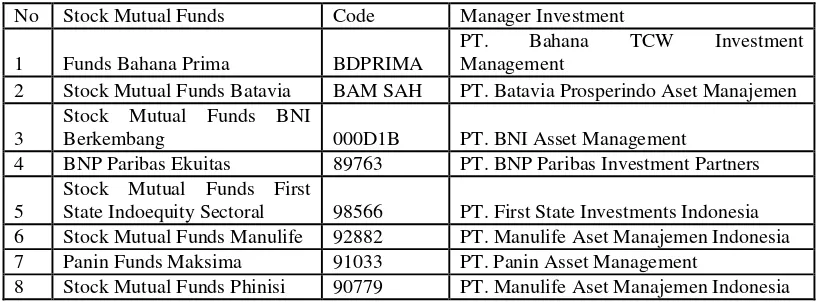
TABLE 2:Sample Conventional Stock mutual funds
No Stock Mutual Funds Code Manager Investment
1 Funds Bahana Prima BDPRIMA
PT. Bahana TCW Investment Management
2 Stock Mutual Funds Batavia BAM SAH PT. Batavia Prosperindo Aset Manajemen
3
Stock Mutual Funds BNI
Berkembang 000D1B PT. BNI Asset Management
4 BNP Paribas Ekuitas 89763 PT. BNP Paribas Investment Partners
5
Stock Mutual Funds First
State Indoequity Sectoral 98566 PT. First State Investments Indonesia 6 Stock Mutual Funds Manulife 92882 PT. Manulife Aset Manajemen Indonesia 7 Panin Funds Maksima 91033 PT. Panin Asset Management
9
Stock Mutual Funds Axa Citra
dinamis BIIDINA PT. AXA Asset Management Indonesia
10
Ekuitas 94532 PT. Pratama Capital Assets Management 12 Rencana Cerdas 91017 PT. Cipta Dana Asset Management
13 Funds Schroder Prestasi Plus 90829
PT. Schroder Investment Management Indonesia
14 Trim Kapital 000D2B PT. Trimegah Asset Management Source: Bapepam- LK
TABEL 3:Sample Syariah Stock Mutual Funds
No Stock Mutual Funds Code Manager Investment
1
Growth Syariah 85480 CIMB Principal Asset Management 3 Cipta syariah Equity (Syariah) 82594 PT. Cipta Dana Asset Management 4 Mandiri Investa Atraktif-Syariah 84863 PT. Mandiri Manajemen Investasi 5 Funds RD Trim Syariah 86363 PT. Trimegah Asset Management
6
Ekuitas Syariah 35600493431 PT. PNM Investment Management Source: Bapepam- LK
TABEL 4:Average Return dan Risk of Convensional Stocks Mutual Funds Periode January 2005 – December 2011
MIAS 0.01177 0.05093
CSE 0.01186 0.13566
RMSSA 0.01359 0.05497
JII 0.01682 0.07768
Source: prepared from Attachment
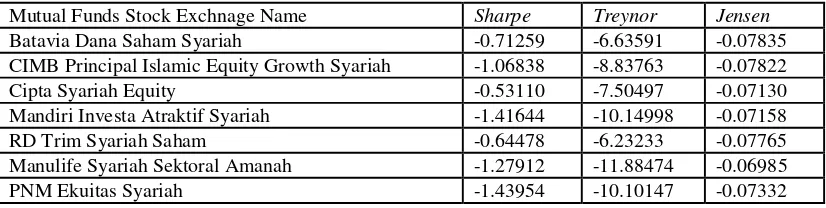
TABEL 6: Performance of Syariah Stock Mutual Funds (With Metode Sharpe, Treynor, dan Jensen)
Mutual Funds Stock Exchnage Name Sharpe Treynor Jensen Batavia Dana Saham Syariah -0.71259 -6.63591 -0.07835 CIMB Principal Islamic Equity Growth Syariah -1.06838 -8.83763 -0.07822
Cipta Syariah Equity -0.53110 -7.50497 -0.07130
Mandiri Investa Atraktif Syariah -1.41644 -10.14998 -0.07158
RD Trim Syariah Saham -0.64478 -6.23233 -0.07765
Manulife Syariah Sektoral Amanah -1.27912 -11.88474 -0.06985
PNM Ekuitas Syariah -1.43954 -10.10147 -0.07332