ESS Extension of Social Security
Can the European elderly afford the financial burden
of health and long-term care?
Assessing impacts and policy implications
Xenia Scheil-Adlung
Jacopo Bonan
ESS Paper N° 31
Global Campaign on Social Security and Coverage for All
International Labour Office
Copyright © International Labour Organization 2012 First published 2012
Publications of the International Labour Office enjoy copyright under Protocol 2 of the Universal Copyright Convention. Nevertheless, short excerpts from them may be reproduced without authorization, on condition that the source is indicated. For rights of reproduction or translation, application should be made to ILO Publications (Rights and Permissions), International Labour Office, CH-1211 Geneva 22, Switzerland, or by email:
[email protected]. The International Labour Office welcomes such applications.
Libraries, institutions and other users registered with reproduction rights organizations may make copies in accordance with the licences issued to them for this purpose. Visit www.ifrro.org to find the reproduction rights organization in your country.
ILO Cataloguing in Publication Data
Can the European elderly afford the financial burden of health and long-term care: assessing impacts and policy implications/ Xenia Scheil-Adlung; International Labour Office, Social Security Department. Geneva: ILO, 2012 v. 48 p.
ISBN:9789221262930; 9789221262947 (web pdf)
International Labour Office; Social Security Dept
social protection / medical care / long term care / health insurance / consumption of health care / older people / EU countries
02.03.1
ILO Cataloguing in Publication Data
The designations employed in ILO publications, which are in conformity with United Nations practice, and the presentation of material therein do not imply the expression of any opinion whatsoever on the part of the International Labour Office concerning the legal status of any country, area or territory or of its authorities, or concerning the delimitation of its frontiers.
The responsibility for opinions expressed in signed articles, studies and other contributions rests solely with their authors, and publication does not constitute an endorsement by the International Labour Office of the opinions expressed in them.
Reference to names of firms and commercial products and processes does not imply their endorsement by the International Labour Office, and any failure to mention a particular firm, commercial product or process is not a sign of disapproval.
ILO publications and electronic products can be obtained through major booksellers or ILO local offices in many countries, or direct from ILO Publications, International Labour Office, CH-1211 Geneva 22, Switzerland. Catalogues or lists of new publications are available free of charge from the above address, or by email:
Visit our web site: www.ilo.org/publns
Contents
Page
Abbreviations ... v
1. Introduction ... 1
2. European social protection systems aimed at alleviating the financial burden of health and long-term care: Key characteristics ... 3
2.1. Public expenditure investments in health and long-term care ... 3
2.2. Coverage and financing mechanisms... 5
2.3. Extent of benefit packages and financial protection ... 8
2.4. Availability and quality of services: the role of the workforce ... 9
3. Assessing the burden of private health and long-term care expenditure on the elderly ... 11
3.1. The utilization of health and long-term care by the elderly ... 11
3.2. Incidence of out-of-pocket payments among the elderly population ... 14
3.2.1. Health-related out-of pocket payments ... 15
3.2.2. Long-term care-related out-of-pocket payments ... 16
3.2.3. Excessive out-of-pocket payments for health and LTC ... 18
4. Who are the most vulnerable among the elderly? ... 19
4.1. Incidence and extent of out-of-pocket payments by income group ... 19
4.1.1. Health care ... 19
4.1.2. Long-term care ... 21
4.2. Incidence and extent of out-of-pocket payments with increasing age ... 22
4.2.1. Health care ... 23
4.2.2. Long-term care ... 24
4.3. Incidence and extent of out-of-pocket payments on long-term care among elderly women ... 26
5. Assessment of the findings and policy implications ... 29
5.1. Closing gaps in coverage and financial protection ... 30
5.2. Addressing deficits in the availability of services ... 31
5.3. Achieving equitable access for the most vulnerable ... 31
6. Summary and conclusions ... 33
Appendix ... 35
Abbreviations
ADLs activities of daily living
EC European Commission
ILO International Labour Office
GDP gross domestic product
LTC Long-term care
NHS National health system
OECD Organisation for Economic Co-operation and Development
OOP Out-of-pocket
SHARE Survey of Health, Ageing and Retirement in Europe
SSA Social Security Association (United States)
WB World Bank
1.
Introduction
Demographic changes, ageing in particular, as well as related public expenditure on health and long-term care (LTC), are a source of concern in many European countries. Public health and LTC expenditure have already been growing over the last decades in all European countries and are expected to increase even more, given the significant improvements in life expectancy by about ten years between 1960 and 2009 and the accelerated growth of people aged 85+ as compared to younger cohorts (figure A1). As a result, public health expenditure is projected to rise in countries of the European Union
from 6.4 per cent of GDP in 2007 to 8.6 per cent in 2060 (figure A2), 1 and expenditure on
LTC from 1.3 per cent of GDP in 2007 to 2.9 per cent in 2050 (figure A3). 2
While demographic ageing impacts on public expenditure have been widely analyzed and assessed in depth, for instance by international organizations (European Commission (EC), 2009), much less attention has been paid to the economic consequences of demographic changes for individuals and households, particularly the elderly: older people are more likely to experience health shocks, cost-intensive chronic illnesses, and have a higher probability of living with severe functional limitations compared to younger people. While “healthy ageing” might have a positive impact on the health development of some elderly persons, the financial situation of others will be aggravated by the fact that elderly persons are frequently economically vulnerable and at higher risk of poverty than younger cohorts, as disposable income decreases with age. Consequently, the increasing demand for health and LTC and the financial vulnerability of older persons might create a significant financial burden for the elderly if related costs are not covered by social protection systems. In particular, out-of-pocket (OOP) expenditures occurring on account of deficits in financial protection might have severe impacts, given their regressive nature, and thus increase inequities between the rich and the poor (WHO, 2010). Such deficits in the financial protection of elderly persons might be aggravated by a lack of services due to constraints in the trained work force and require that services by unskilled personnel be paid privately.
These aspects are crucial when developing social protection policies targeting elderly persons both within the areas of health and LTC and beyond – e.g. regarding income support and old age pensions or other components of national social protection floors (ILO, 2010). Against this background, we aim to assess the financial consequences of health care and LTC expenditure for the elderly, in particular the impact of OOP expenditures at the time of service delivery-related policy implications.
Key factors influencing and explaining differences of OOP payments for health and LTC expenditure across countries will be analyzed. These factors include demographic developments; institutional aspects such as the social health protection system; and the level of public expenditure, utilization, and workforce supply.
1
The projection refers to the “pure demographic” scenario” set out in: European Commission: 2009 Ageing Report: Economic and budgetary projections for the EU-27 Member States (2008-2060)
(Luxembourg, 2009).
2
We employ survey data provided from the Wave 1 of the Survey of Health, Ageing and Retirement in Europe (SHARE, 2004), which is representative for the elderly population
(over 50 years) in eleven European countries. 3
For the purpose of this publication, we define LTC as a wide range of non-medical support services provided over a prolonged period of time. This may be due to the presence of chronic conditions or disabilities, defined as the inability to perform basic activities of daily living (ADLs) such as limitations in dressing, walking across the room, bathing or showering, eating, getting in and out of bed, and using the toilet autonomously. Disability in such terms is predominant in older ages: between 30 and 40 per cent of the population aged 80 + years have one or more disabilities (on average two), as compared to between 12 and 19 per cent among those aged 65 + (figure A4).
3
2.
European social protection systems aimed at alleviating
the financial burden of health and long-term care:
Key characteristics
2.1. Public expenditure investments in health and long-term care
In Europe, public health care provision constitutes as a share of GDP the second largest
expenditure item for the elderly after pension schemes (Rodrigues and Schmidt, 2010), ranging from around 5.5 per cent to 8.5 per cent across European countries.
Far fewer public resources are devoted to LTC expenditure. Levels of public expenditure
on this care vary from country to country, ranging from less than 0.5 per cent of GDP in Greece and Spain, to around 3.5 per cent in Sweden and the Netherlands. The majority of countries allocate around 1 to 1.5 per cent of GDP (figure 1).
! "
#! $ % & ' ( % )' $* +, - .
# & / " 0
Health care and LTC expenditure are age-related, as they are linked to morbidity and disabilities, both of which develop with age and, in turn, determine the need for health care and LTC, respectively. Examining health spending as a percentage of GDP in countries by age cohort clearly demonstrates that expenditure increases with age: The increment is steeper towards older age. This pattern is especially evident for LTC that shows flat expenditure up to the 60-64 cohort and sharp increases regarding older ages across all countries (figure 2).
0 1 2 3 4 5 6 7 8 9
%
o
f
G
D
P
! " # $
% ! " #
% ! " #
+, #! ! 2 . ! .
! " # $ % & ! &
' % 3 ! 4 )3 2*
2.2. Coverage and financing mechanisms
As regards health care, European countries have achieved nearly universal population
coverage through tax-funded national health systems (NHS), social health insurance schemes or mixed schemes. Social health insurance prevails in countries such as Austria, Belgium, France, Germany and Netherlands, whereas tax-funded national health systems are implemented in countries like Denmark, Italy, Sweden and the United Kingdom. A third financing mechanism – OOP – occurs to a varying extent in all countries and is linked to the utilization of services (Scheil-Adlung and Bonnet, 2011).
Universal coverage in LTC is far from being achieved despite high expenditure and can scarcely be afforded by individuals and households lacking social protection:
• In the United Kingdom, lifetime costs of LTC for elderly aged 65 + are estimated to
exceed £ 30,000 on average per person (corresponding to about €36,000), based on current prices of service and current patterns of disability (Comas-Herrera and Wittenberg, 2010).
• In the United States, the cost of formal care is estimated at an average of about US$
home care. These amounts correspond to three times the average disposable income of the population aged 65 + (Gleckman, 2010).
Thus, if the elderly lack social protection coverage, financial distress and impoverishment are common scenarios despite the existence of some form of social protection for LTC in most European countries. Existing financing mechanisms are not universal but usually targeted, e.g. involving needs or means-testing (table 1).
However, they allow for fair burden sharing through risk pooling for the covered population. Related financing mechanisms consist of tax-based LTC systems, social and LTC insurance schemes financed through contributions, and a combination of both. Private insurance for LTC has not been widely developed and has been shown to be ineffective in addressing related risks (Barr, 2010). Most countries, including the Nordic countries (Denmark, Norway and Sweden), have adopted tax-funded systems. Only a few countries, such as Germany, have developed specific LTC insurance schemes – but also in these public subsidies from Government budgets are provided.
Nonetheless, irrespective of the financing mechanism chosen, in all countries schemes and systems involve co-payments at the point of service delivery.
Furthermore, a strong reliance on informal and family carers may be observed in many countries, in accordance with their culture and values. Another common feature in all European countries consists of the limited availability of public resources for LTC.
& ' ! ! (&# )
* ! + ,- . ! ,
3 " #! +,
5 3 0 6 7 6 2 2
8 9 &" ! 5
! ! 27:
4 ; ; ; ; ;
- )5* ; 6 2 7 0 6 6
/ & )5* ; 0 4 0
&" +, " !
! ! 27: ; 4$ 20 7 $4 4 2 6
! <! <! ! & ! ! && ! ! && ! ! && = ! && ! ! && > 9 #
3 . # < / -
3 . # < / - + # # # 3 =
3 = =
+, ! = ? ! ! = 3 " ! = ?! ! =
> !
3 " ! = ! = 3 " ! = ! = ! ? ? ? ? ? 1 5 " . ? ?
> ? -
/- &
?%
= ?% "
= " . = = ; + , ! . = ; & , " . / - ) * 1 !! 1 ! " ) !!
*
! &! =
#! ! )" % * 8 1 @ 1 - ?% = & ! &! =
#!
! - &
/ &
/ &
+ = "
1 & 7 277
<& &
! "
- & 7 2$7
<& - ? % 44
7
1 4
& 6 $6 <& !
.!
?! .& ? ; ;
- & ! #
& 70 $
<&
- & ! #
; ;
2.3. Extent of benefit packages and financial protection
In countries of the European Union, the scope of health care benefits is widely in line with
the ILO Social Security (Minimum Standards) Convention, 1952 (No. 102). However,
benefits addressing needs for LTC show large variations across European countries.
Generally, LTC benefits are provided either in cash (e.g. in Belgium), in-kind (e.g. in France), or as a combination of both (e.g. in Austria, Germany, the Netherlands and the United Kingdom) (Scheil-Adlung and Kuhl, 2011). A typical in-kind LTC benefit consists of the direct provision of services at home, at institutions, or at nursing homes – such as in Nordic countries. However, cash benefits may include allowances to finance home care, institutional care and assistance. These cash benefits may be used to purchase services directly from public or private LTC providers. Related regulations frequently aim at creating a competitive environment among service providers (both for institutional and home care), which may enhance the quality of overall services offered. This is the case in the Netherlands and Germany where public, non-profit and for-profit providers compete in LTC markets to provide services. Alternatively, cash benefits can be used either to support the income of informal carers or to support users’ expenses in LTC. The amount of cash benefits varies from country to country, and might depend on the severity of disabilities (namely any ADL restrictions), as is the case in Austria, Germany and Spain, or might be fixed, as is the case in Italy. Moreover, additional resources are assigned to individuals with severe need and economic difficulties through social programmes that are financed by the general budget – as in Germany (table 1).
The level of LTC benefits is frequently inadequate to cover the costs of the services required. The gap in access to formal LTC service delivery might be estimated by comparing the share of the elderly who have declared they have one or more disability with the total number of users of LTC services, either at institutions or at home.
Figure 3 shows the number of individuals aged 65+ with one or more ADL restrictions compared to individuals utilizing LTC services (institutional and home care) in selected European countries in 2004: while in some countries the number of LTC users is close to the number of people with disabilities, such as in Sweden, we find remarkable gaps in Greece and Switzerland, where utilization levels are extremely low – 98 per cent and 91 per cent of old people with disability, respectively, do not utilize any LTC services in these two countries. Moderate gaps can be observed in Italy (61 per cent not accessing LTC), Germany (57 per cent), Spain (34 per cent), and Austria (31 per cent). In some countries the number of users is superior to the number of individuals with disabilities, which is most likely related to differences in the method of assessing the functional and medical
conditions of disability required to qualify for LTC benefits. 4
4
0 + 1 $2 3 - * ( 4 %
1 1 5 (&# 1 4 %
1 $2 3 6
; A " & )* + ,
- " &! . ! & . / & ! !
! ! ! & ! & % ;= 1 ? !
= =
2.4. Availability and quality of services: the role of the workforce
The affordability of and access to health and LTC services are strongly linked to the availability of services. In this context the healthcare workforce constitutes a central issue, both for health and LTC. The existing shortage of the health workforce in European countries is recognized and addressed by governments and dealt with at the heart of
European Agenda: in 2008, for instance, the European Commission issued the Green
Paper on the European Workforce for Health. While the professional workforce providing LTC faces similar if not worse shortages, the problem in this sector does not seem to be sufficiently addressed. The sector often employs informal carers who might be inadequately qualified and have to be financed on a private basis. As a result, related workers are frequently not covered by social security provisions and it is difficult to regulate the quality of services. In addition, significant amounts of informal OOP payments are incurred for LTC.
Formal LTC can be supplied by the public or private sector and delivered at home or in institutions. Home LTC – as covered by social protection schemes – is delivered directly in the patient’s home by professionally trained health care personnel or care assistants on a long-term basis. Institutional LTC is supplied in institutions like nursing homes where trained personnel assist the elderly in need.
Informal care can be provided by:
• family members or friends who do not receive payments;
0.0 5.0 10.0 15.0 20.0 25.0 30.0
%
o
f
p
o
p
u
la
ti
o
n
a
ge
d
6
5
+
• informal carers who receive cash benefits or allowances provided by LTC programmes in the context of social protection (however, in many countries, this is considered to be formal home LTC);
• undeclared or irregular informal caregivers who receive direct payments from users
but work without formal contracts. This group frequently consists of undocumented migrants (Fujisawa, 2009) and is in need of protection, such as that provided for under the new ILO Domestic Workers Convention, 2011 (No.189) concerning decent work for this category of workers.
Available data on the informal LTC workforce are scarce given the variety of workers providing LTC and related definitions. However, different sources confirm the prevalence of informal LTC delivery over formal care (OECD, 2011): Formal caregivers constitute a significantly smaller share of the total LTC workforce than informal caregivers. For instance, it amounts to:
• around 3 per cent in Italy;
• 10 per cent in the Netherlands; and
• 1.8 per cent in the United Kingdom.
The share of family members providing care in the total LTC workforce is at its highest in Italy, with 16.2 per cent, followed by Spain (15.3 per cent); it is at its lowest, with 8 to 10 per cent, in Austria, Denmark, Greece and Sweden.
3.
Assessing the burden of private health and long-term care
expenditure on the elderly
3.1. The utilization of health and long-term care by the elderly
When evaluating the burden of health and LTC on the elderly, patterns of utilization of care play a key role. In fact, the distribution and severity of private OOP expenditures are closely linked to the extent to which individuals make use of services: the utilization levels. Furthermore, the analysis of utilization levels makes it possible to identify inequities if – despite equal needs – utilization across income groups differs.
Utilization rates for health care do not differ substantially across European countries:
among the elderly aged 50 +, between 77 per cent in Denmark and 93 per cent in France and Belgium had, in 2004, visited a medical doctor within the past year. The share of the elderly population hospitalized overnight was much smaller and varied between 9 per cent in the Netherlands and Greece and 20 per cent in Austria (figure 4). As a general rule, the utilization of health services is equitable across income groups in European countries.
6 , 1 1 2 ! 1 1
1 7 6
; " & )* ) +*
= 1 ? ! = =
As shown in figure 5, common trends in the utilization of LTC across countries illustrate the fact that:
• home care is more frequently used than institutional care by the 65 + and 80 + groups;
• the number of users increases with age.
In total, between 5 per cent in Spain and 20 per cent in Switzerland of the younger cohort utilize LTC; for the older cohort, the variation is 15 respectively 45 per cent. These differences in utilization may be explained by variations in the generosity of social protection benefits, eligibility criteria and assessment methods. Further, the availability of the workforce might explain the differences observed.
0 20 40 60 80 100
S
h
a
re
o
f
p
o
p
u
la
ti
o
n
a
g
e
d
5
0
+
2 (&# 4$2 3 3%
1 8 9
; A "
Within countries, significant inequities in utilization can be observed with regard to the income level of those in need. While health care utilization rates seem to be fairly equal distributed across income classes, in most of European countries (Van Doorslaer et al., 2000 and 2004) LTC utilization rates show that more people in the lower income quintile use LTC services than people in the highest income quintile. This is the case for Denmark, France, Netherlands, Spain and Sweden and reflects the fact that poor people are more likely to be constrained by ADL restrictions and thus more likely to be in need of LTC than the richer.
However, this is not the case in Austria, Germany and Italy, where the rich take up LTC services more frequently than the poorer members of the community (figure 6) This might be due to high co-payments (OOP) that cannot be afforded by the poor and the need to pay for private home care in the absence of formal home carers and the high costs for unwanted institutional care. The latter is reflected in the declining utilization trends of institutional care as compared to the increasing utilization of home care over the past 20 years (figures 7 and 8).
0 5 10 15 20 25 30 35 40 45 50 age 65+ age 80+ age 65+ age 80+ age 65+ age 80+ age 65+ age 80+ age 65+ age 80+ age 65+ age 80+ age 65+ age 80+
Spain Germany Finland Denmark Sweden Norway Switzerland
L T C u se rs a s sh a re o f re fe rr in g c o h o rt p o p u la ti o n
$ , 1 2 3 5 (&# 1 4 % !
: 6
; A " & )* ) 4*
= 1 ? ! = =
8 & 5 (&# 5 99 9
; A "
0.00 5.00 10.00 15.00 20.00 25.00
Austria Belgium Denmark France Germany Italy Netherlands Spain Sweden 1st income quintile 5th income quintile
2 3 4 5 6 7 8 9
1990 1992 1994 1996 1998 2000 2002 2004 2006 2008
S
h
a
re
o
f
p
o
p
u
la
ti
o
n
a
g
e
d
6
5
+
Belgium Netherlands
Norway Sweden
& 5 99 9
; A "
3.2. Incidence of out-of-pocket payments among the elderly population
While co-payments of the elderly covered by social health and LTC systems and other OOP exist in all European countries, there are significant differences in their design and extent. OOP can take the form of:
• flat user fees – such as for LTC services in Belgium;
• income-related cost sharing up to certain ceilings, e.g. in Sweden; or
• residual differences between the price of services and benefit packages provided for,
such as in Germany.
Related impacts of OOP expenditure on household income, especially at high levels, may constitute barriers to taking up benefits, and result in inequitable access to needed services, regressive financing and impoverishment. Hence, financial protection against high OOP plays a key role in ensuring equity and avoiding care-related impoverishment.
In order to assess the burden of OOP payments upon households, we evaluate the total household OOP payments as a share of household total gross income across countries. In the analysis that follows, two factors are taken into account to evaluate the impact of OOP expenditure. The first is frequency – the share of the population (households or individuals) experiencing positive levels of OOP payments. The second is severity – the extent to which OOP expenditure constitutes a burden impacting the income of those with OOP expenditures. This allows us to compare the effectiveness and equity of social health protection systems, regardless of prices of services and treatments as well as different living costs.
The assessment of the burden upon the elderly in terms of private OOP payments is completed through data from Wave 1 of SHARE, which was carried out in 2004 (SHARE 2004). The database includes micro data on health, socio-economic status and social and
0 5 10 15 20 25
S
h
a
re
of
p
op
u
la
ti
on
a
g
e
d
6
5
+
Netherlands Norway
Sweden Austria
family networks of individuals aged 50 and over. The sample is representative of the elderly population of 11 European countries (Austria, Belgium, Denmark, France, Germany, Greece, Italy, Netherlands, Spain, Sweden and Switzerland). The survey provides information on 19,411 households (28,357 individuals), in which at least one member is aged 50 or more. Calibrated cross sectional weights are employed in the analysis so that the potential selectivity bias generated by non-respondent households and
individuals is minimized. 5 Basic descriptive statistics of the sample are showed in
table A1.
3.2.1. Health-related out-of pocket payments
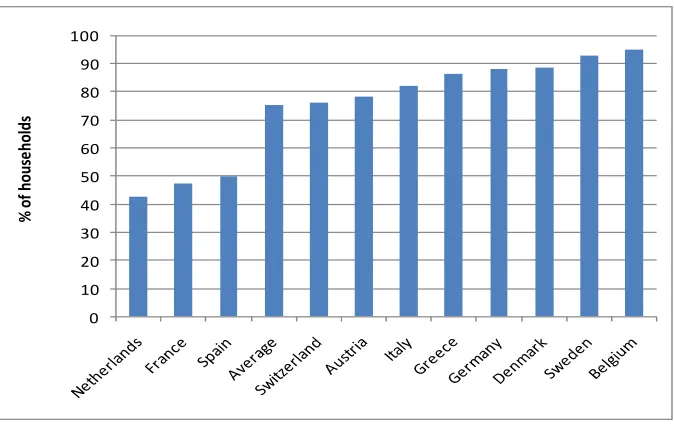
As shown in figure 9, in most European countries studied, more than 70 per cent of
households with at least one member aged 50 + incurred OOP expenditure for health care.
Exceptions are Spain (49.7 per cent), France (47.5 percent) and the Netherlands (42.5 percent), where less than half of the older population did not incur any OOP expenditure for health care.
9 , - 2 3 ""
6
; A " & )* +
&! . 1 & &" 7 : = 1 ?
! = #! ! " ! !
OOP expenditure for health care ranges from 1 per cent to 5 per cent of households’ gross income; this amounts to about 2 per cent in Austria, Denmark, France, Germany, Netherlands and Sweden, while it exceeds 4 per cent in Belgium, Greece and Italy. On average, OOP expenditure takes up 2.5 per cent of the income of the elderly (figure 10). Prescribed drugs and outpatient care are most relevant and account for 46 per cent and 44 per cent of household income on average, respectively.
5
For a further description of the survey and methodologies see SHARE Release Guide 2.5.0, Waves 1 & 2 by 24 May 2011, available at http://www.share-project.org/. For further information on the sampling and weights, see Klevmarken, Swensson and Hesselius, 2005.
0 10 20 30 40 50 60 70 80 90 100
%
o
f
h
o
u
se
h
o
ld
; < "" 4 % ! 4
% 6
; A " & )* ) 4*
&! . 1 & &" 7 : . 1 ! = 3 #!
&! 9 & ! = 3 #!
1 3 B ! & = 1 ? ! =
When combining the data on frequency and severity of OOP we find in countries such as Belgium, Italy and Greece a high prevalence of households with OOP expenditures (more than 80 per cent), which experience a deduction of their income by 4 per cent and more.
3.2.2. Long-term care-related out-of-pocket payments
In European countries, OOP expenditures for LTC show substantially different patterns from those for health care, regarding both the frequency and severity of expenditure.
• Frequency of OOP
As compared to the relatively homogeneous share of households concerned by OOP for health care, OOP for LTC among elderly households show large variations across countries – ranging from 11.6 per cent in Belgium to 1.6 per cent in Italy (figure 11). These variations reflect both different characteristics of the LTC scheme designs as well as various preferences and utilization of informal and family care: This is most likely the case in Italy and Spain, where the role of informal (family) care is still predominant. Moreover, underreporting may be the key to interpreting particularly low levels of payments, in cases where foreign-born nurses are contracted illegally. This practice is widespread throughout Europe, and occurs particularly frequently in Southern European countries.
0 1 2 3 4 5 6
O
O
P
a
s
a
sh
ar
e
o
f
h
o
u
se
h
o
ld
i
n
co
m
e
, ! "" (&# 6
; A " & )* ) 4*
&! . 1 & &" 7 : = 1 ?
! =
• Severity of OOP
The impact of OOP for LTC on households’ income is more severe than that for OOP on health care. Levels of expenditure are particularly high, ranging from between 10 to 20 per cent of households’ income in the Nordic countries – but also in Greece, Italy and Spain. On average, across the countries observed, households spend 9.6 per cent of their income on OOP expenditure for LTC, while this only accounts for 2.5 per cent for health care (figure 12).
; "" (&# 4 ! %
6
; A " & )* ) 4*
&! . 1 & &" 7 : 1 ! = 3 #! +,
&! 9 & ! = 3 #! +, 1 3
B ! & = 1 ? ! =
0 2 4 6 8 10 12
%
o
f h
ou
se
ho
ld
s
0 5 10 15 20 25 30
Switzerl … Germany
France Netherla…
Austria Belgium Sweden Denmark Greece Italy Spain
3.2.3. Excessive out-of-pocket payments for health and LTC
OOP expenditures for health and LTC can even exceed 100 per cent of household
income. 6 This is due either to a household’s very low income or extremely high OOP
expenditures. These payments, which are the result of serious gaps in financial protection, concern on average around 1 per cent of elderly households paying OOP for health care and 0.5 percent paying for LTC (figure 13).
Households paying more than 100 per cent of their income on health care are unevenly distributed across Europe. While in Austria, Greece and Italy more than 1 per cent of the households with at least one member aged over 50 years are concerned with this problem, the level does not exceed 0.5 per cent of total households in the rest of Europe.
Except for the Netherlands, more households are burdened by excessive health care expenditure than by LTC expenditure. OOP expenditures on LTC impact on less than 0.3 per cent of households in many European countries (Belgium, Denmark, France, Germany, Netherlands, Sweden and Switzerland), whereas they exceed 1 per cent in households in Italy and Greece, corresponding to about 220,000 households for health care and 170,000 households for LTC in Italy, and 50,000 for health care and 29,000 for LTC in Greece.
Despite the relatively low number, these cases constitute a severe threat for those concerned and raise concerns regarding human rights for health and social security and the principle of equity.
0 , !
"" (&# ! !
; A " /;@ ) 4*
&! . 1 & &" 7 : &!
9 & ! = 3 #! +, ;= 1 ? !
= / #! ! " ! !
6
Note: income does not include private transfers from the family and any consideration on wealth or saving. This sub-sample will not be included in the following analysis; averages may therefore be underestimated.
0 0.5 1 1.5 2 2.5
%
o
f h
ou
se
ho
ld
s
4.
Who are the most vulnerable among the elderly?
In the following section we aim to characterize the group of elderly concerned by OOP expenditures. Key characteristics that demonstrate vulnerability include:
• household income;
• age;
• gender.
4.1. Incidence and extent of out-of-pocket payments by income group
The role of household income in financing health and LTC across Europe depends on the scope of the health benefit package, as well as the level of financial protection. Household income and assets play a major role if the benefit package does not cover relevant health care or low quality care, as private direct payments are required to access adequate care.
4.1.1. Health care
How many poor households are obliged to made out-of-pocket payments to access health care? As shown in figure 14, in most countries under review rich households – as defined by income quintile – are more likely to experience OOP expenditure for health care than poor households. This result is in line with findings that confirm a strong correlation between growing income and health expenditure levels due to various factors including education and information.
However, in all countries observed, the elderly poor spend a higher share of their income on OOP for health care compared to the richest group (figure 15). Whereas the richest among the elderly population pay less than 1 per cent of their household income, poor households are burdened by OOP expenditure for health care that ranges between 11.3 per cent of income in Greece and 2.3 per cent in Sweden.
6 , "" !
: 6
; A " & )* ) 4*
&! . 1 & &" 7 : = 1 ?
! =
2 ! ""
! : 4 ! 2 - %
6
; A " /;@ ) 4*
&! . 1 & &" 7 : . 1 ! = 3 #!
, &! 9 & ! = 3 #!
0.00 2.00 4.00 6.00 8.00 10.00 12.00
1st 5th 1st 5th 1st 5th 1st 5th 1st 5th 1st 5th 1st 5th 1st 5th 1st 5th 1st 5th
Austria Belgium France Germany Greece Italy Netherlands Spain Sweden Switzerland
O O P e x p e n d it u re a s % o f h o u se h o ld in co m e
outpatient inpatient prescibed medicines
0 10 20 30 40 50 60 70 80 90 100
7 7 7 7 7 7 7 7 7 7 7
; ( & & % & . - . ! 1 1 9
4.1.2. Long-term care
In contrast to OOP for health care, in most countries, a greater number of poor elderly households incur OOP expenditure for LTC than rich households (figure 16) In addition, wide differences between poor and rich are registered in countries such as Belgium, Netherlands and Sweden, where around 20 per cent of the poor households are concerned as compared to (less than) 5 per cent of the rich households.
$ , ! "" (&# !
: 6
; A " & )* ) 4*
&! . 1 & &" 7 : = 1 ?
! =
Furthermore, the severity of the impact of OOP expenditure for LTC on households’ income is much higher for the poor than for the rich. Levels above 10 per cent of the poor household income are registered in Greece (12.6 per cent), Italy (10.6 per cent), Netherlands (10.9 per cent), Spain (12 per cent), Sweden (11.2 per cent) and partly France (9.9 per cent), whereas the levels of expenditure for the richer group range between 0.2 per cent in France to 3.4 per cent in Sweden (figure 17).
0 5 10 15 20 25
7 7 7 7 7 7 7 7 7 7
; ( & & . - . ! 1 1 9
%
o
f
h
o
u
se
h
o
ld
8 ! "" (&# !
: 4 ! 2 - %
6
; A " & )* ) 4*
&! . 1 & &" 7 : 1 ! = 3 #! +, ,
&! 9 & ! = 3 #! +, 1 3
B ! & ;= 1 ? ! =
4.2. Incidence and extent of out-of-pocket payments with increasing age
An age-related analysis of incidence and OOP seems to be crucial when assessing the vulnerability of the elderly given:
• the increasing need for health and LTC care among the oldest cohorts (Lafortune,
2007); and
• the decline of disposable income with age (OECD, 2011), which contributes towards
sharpening the impact of OOP expenditures and increasing the risk of impoverishment as people get older.
When evaluating OOP expenditure as a share of income by age, a measure of both expenditure and income at individual level is needed. In order to obtain comparable data on OOP expenditure across countries, we propose a measure that is relative to income – as in the previous analysis. We assume resource pooling at household level and account for
household size by creating household per capita income. 7 The prevalence of OOP in
different population cohorts and the severity of such direct payments for those incurring the expenditures will be analysed both for health and LTC expenditure.
7
We divide household total gross income by the number of members in the household. 0.00 2.00 4.00 6.00 8.00 10.00 12.00
1st 5th 1st 5th 1st 5th 1st 5th 1st 5th 1st 5th 1st 5th 1st 5th 1st 5th 1st 5th
Austria Belgium France Germany Greece Italy Netherlands Spain Sweden Switzerland
4.2.1. Health care
Within all countries observed the share of households experiencing OOP expenditure for health care stays at similar levels and does not to change significantly with age (figure 18) – with the exception of Spain. In Spain, the likelihood of experiencing OOP expenditures for health care decreases beyond age 64 significantly. This might be due to specific regulations exempting pensioners from OOP, for instance medicines (SSA/ISSA, 2010).
, ! "" !
6
; A " & )* ) 4*
= 1 ? ! = =
The amount spent by elderly households on direct health care increases with age in most European countries (figure 19). The share of OOP spent by the elderly is highest for those aged 80+ and reaches peaks of up to about 7 per cent of household income in countries such as Belgium and Greece where – as shown in figure 18 – more than 90 per cent of all elderly households experiencing OOP are concerned.
6 4 7 2 $ 0
=
;
9 . 1 "" 4 %
! 6
; A " & )* ) 4*
&! . 1 ! = 3 , &!
9 & ! = 3 #! 1 3 B ! & ;=
1 ? ! = =
4.2.2. Long-term care
Completely different features arise in the case of LTC and a clear trend is common across all considered countries: the number of individuals experiencing any OOP expenditure increases substantially with age. In fact, the oldest cohort (individuals over 80 years of age) incurs OOP payments for LTC that are up to seven times higher than those of individuals aged between 65 and 79 years. These results are strictly connected to the utilization levels of LTC, which increase dramatically for individuals aged over 80 years (figure 20).
The highest shares of individuals aged over 80 years are registered in Belgium (36 per cent), Netherlands (32.4 per cent) and Sweden (31.7 per cent). Conversely, the lowest shares are observed in Italy (3.4 per cent), Switzerland (6.1 per cent) and Spain (8.3 per cent).
6 4 7 2 $
"
"
=
;
, 1 2 3 "" (&# ! 6
; A " /;@ ) 4*
= 1 ? ! = =
As expected, in most countries observed, the severity of OOP expenditure is most pronounced for the elderly aged 80+ and reaches more than 20 per cent of per capita household income in Spain. The highest expenditures for the younger cohort aged 65-79 years, of around 10 per cent and more, are observed in Austria, Greece and Spain. The group of elderly aged 50-64 years account for the least significant severity of OOP, with less than 5 per cent (figure 21).
. 1 "" (&# !
6
; A " /;@ ) 4*
&! . 1 ! = 3 +, , &! 9
& ! = 3 #! 1 3 B ! & ;= 1
? ! = =
7 7 7 6 67 4
=
(&#
7 ?24 27? 0 $ :
7 7
""
=
(&#
4.3. Incidence and extent of out-of-pocket payments on long-term care
among elderly women
Gender, particularly in relation to marital status, is an important characteristic when it comes to the severity of OOP expenditures and potential impoverishment. This is due to the fact that:
• more women than men are living to a higher age, in accordance with life expectancy
statistics;
• many elderly women receive a low income or are even at risk of poverty;
• in addition, informal care delivered by family members, particularly by the spouse, is
crucial in many countries and contributes to reducing formal LTC services. However, such support is not available to single elderly women and thus might result in OOP expenditures (EC, 2009).
Generally, women are more likely to incur OOP for LTC than men: in all considered countries the percentage of women facing OOP expenditures for LTC is higher than that of men (figure 22).
, 1 2 3 1 "" (&# !
6
; A " & )* ) 4*
= 1 ? ! = =
Moreover, in many countries, women are faced with OOP expenditure taking up a higher percentage of their income (up to 10 per cent) than men; this is particularly the case in France, Greece, Italy and the Netherlands (figure 23).
0 2 4 6 8 10 12 14
%
o
f
p
o
p
u
la
ti
o
n
0 . 1 "" (&# ! 6
; A " & )* ) 4*
&! . 1 ! = 3 +, , &! 9
& ! = 3 #! 1 3 B ! & ;= 1
? ! = =
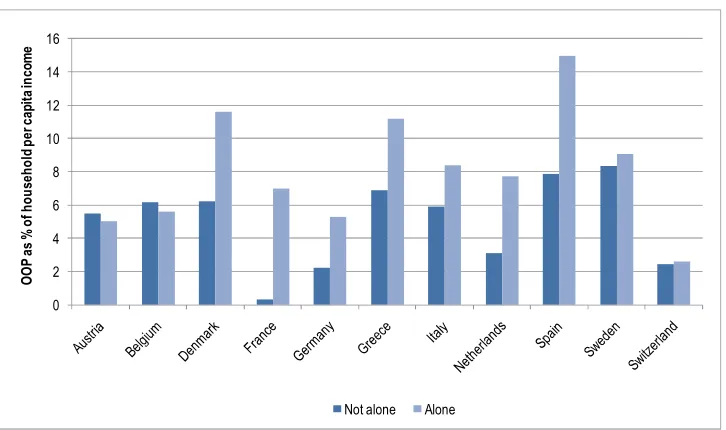
Frequently, elderly women living alone are more likely to incur OOP expenditures on LTC than single men and the rest of the elderly population (figure 24). This is particularly significant in countries such as France, the Netherlands and Switzerland, where the number of women with OOP in LTC is more than twice as high as the number of men with related OOP or the rest of the population living in households with more than one person.
6 , 1 2 3 "" (&#
6
; A " & )* ) 4*
= 1 ? ! = =
4 2 $ 4
"
"
=
& &
0 2 4 6 8 10 12 14 16 18 20
%
o
f
p
o
p
u
la
ti
o
n
Generally, the percentage of elderly persons living alone and experiencing OOP expenditure for LTC is higher than the percentage of those living in households with OOP composed of more than one person. In fact, it can be five times higher, as in Denmark (figure 25).
2 , 2 3 - "" (&# 1 1
6
; A " /;@ ) 4*
= 1 ? ! = =
Moreover, people living alone use a higher percentage of their income to finance LTC-related OOP expenditure. This occurs in most countries observed – e.g. Denmark, France, Germany, Italy, Netherlands, Spain and Sweden – and confirms the need to provide support for individuals living alone (figure 26).
$ . 1 "" (&# !
4 1 1 % 6
; A " & )* ) 4*
&! . 1 ! = 3 +, , &! 9
& ! = 3 #! 1 3 B ! & ;= 1
? ! = =
A statistical overview on key factors on OOP for LCT in selected countries is presented in table A5.
4 2 $ 4 2
=
;
4 2 $ 4 2
"
"
=
5.
Assessment of the findings and policy implications
Based on the above findings, the impact – particularly the financial consequences of both health and LTC expenditure on the elderly population in selected European countries – can be broadly characterized as follows.
•
Social protection coverage in health and LTC and related financing
While population coverage for health care is nearly universal in European countries and there is significant funding in terms of GDP, coverage for LTC is scattered and public LTC expenditure accounts for a small share of funds available for health care. Despite its regressive nature, OOP constitutes a financing mechanism in all countries in addition to tax – and contribution-based funding.
The scope of benefits for LTC shows stark variations across countries and is frequently designed to include gaps as compared to needs. Furthermore, access to services is hampered by deficits in the workforce; this requires seeking informal care that usually involves private expenditure.
•
Severity of financial impacts on the elderly
Most of the European households of elderly people incur OOP payments for health care that range between 1 and 5 per cent of the household’s income; between 0.5 and 1 per cent of elderly households are paying more than 100 per cent of their income for OOP on health care.
Relatively lower shares of the elderly incur OOP payments for LTC – on average about 5 per cent; however the impact on the household’s budget is higher than the impact of OOP on health care and reaches levels of up to 25 per cent of the household’s income; in all countries observed we find elderly households that have to pay more than 100 per cent of income on LTC, peaking at 1.3 per cent of elderly households in Italy.
Generally, women are more likely to incur OOP expenditures in LTC than men and they frequently pay a higher share of their income for LTC than men. Single women aged 50 + are more likely to incur OOP expenditure for LTC than single men and the rest of the population
•
Equity in financing by income, gender and age
The elderly with the highest income incur OOP for health care more frequently than elderly poor people; however, with this being up to 11.3 percent of their income, it constitutes a higher share of poor households’ income than that of the elderly rich.
More poor households are concerned by OOP for LTC than rich households. This results from both the design of respective social protection systems and the fact that, on average, more poor people suffer from ADL limitations and hence need more LTC. As is the case for health care, the impact of related OOP on income is significantly higher for the poor than the rich, requiring up to about 12 per cent of their income.
The elderly living alone are more likely to incur OOP payments for LTC than other groups and spend higher shares of their income on OOP than others.
When assessing these results it is important to keep in mind the key factors that influence the extent to which OOP expenditures on health and LTC are incurred. These include:
- country-specific values and culture;
- gaps in benefit packages, ineffective eligibility criteria and assessment procedures for
LTC;
- deficits in financial protection; and
- forced private payments due to the absence of a formal workforce.
Against this background, evidence-based conclusions for policy-makers are suggested in the following section. We focus on key policy interventions that relate to challenges in coverage and financial protection, availability of services and equity in access to health and LTC benefits.
5.1. Closing gaps in coverage and financial protection
• Gaps in population coverage – particularly for LTC – should be closed and financial protection increased by developing inclusive legislation, extending the scope of benefits and minimizing OOP to avoid impoverishment.
The main causes of the observed high levels of OOP in health and LTC relate to both gaps in legislation (population coverage) and limitations of benefit packages (including financial protection). However, social health protection is a human right and considered as a tool to reduce poverty and inequality. Thus, countries are advised to:
- strive for universal coverage and increase coverage of the elderly through inclusive
legislation;
- extend the scope of benefits for health and LTC with a view to adequacy; and
- increase financial protection for the elderly by minimizing OOP.
In all schemes and systems, an attempt should be make to provide at least essential benefits for the elderly to ensure them access to affordable services and financial protection.
As far as LTC benefits are concerned, it is suggested that they be adjusted and include the provision of benefits covering the observed preference for services at home rather than institutional care. This requires acknowledging the role of family carers in social protection schemes as well as providing benefits covering such support. In addition, eligibility criteria for benefits should be set with a view to providing those who are the most concerned with access to the benefits they need. Furthermore, benefits should be reviewed regularly and monitored to secure adequacy.
5.2. Addressing deficits in the availability of services
• More public resources and an increasing number of skilled workers should be made available to provide health care and LTC services for the ageing population.
Informal care frequently fills the gap where levels of formal LTC utilization are low (Germany, Greece, Italy, Switzerland), whereas it is less widespread where formal LTC utilization is high (Denmark, France, Netherlands). Thus, sufficient funds should be made available to ensure the availability of quality services where needed.
As demonstrated above, countries allocating higher levels of public resources to LTC show higher utilization rates and average out-of-pocket payments, while the risk of catastrophic expenditure for LTC is concentrated in countries with mid to low utilization rates and lower public expenditure on LTC. This bears witness to the fact that higher public expenditure allocated to LTC has the potential to decrease the share of the population incurring catastrophic OOP expenditures.
Against this background, additional funds for health and LTC for the elderly should be generated. When increasing public expenditure, account should be taken of the share of elderly in the total population and the prevalence of disability within that population – considering that related expenditure increases with age and that the increment is higher in older age groups. Possible financing mechanisms to be applied include both taxes and payroll taxes. Out-of-pocket payments are not recommended as a financing mechanism given the regressive impact on income and the potentially impoverishing effects.
Fiscal space could also be developed at system level, e.g. through efficiency gains in organizing and administering related social protection systems. It might be particularly useful to develop synergies through better matching interfaces between health and LTC services.
In all countries observed, the availability of health and LTC services for the elderly is significantly hampered by the absence of skilled personnel. Indeed, shortages are noted in both the skilled health and LTC workforce. Unfortunately, the latter seems to be often overlooked by governments, exacerbating the burden of LTC upon the elderly and their families. Guaranteeing effective access to services for the elderly requires ensuring that sufficient health and LTC workers are available. Thus, governments should ensure that decent working conditions, including adequate wages, be created.
5.3. Achieving equitable access for the most vulnerable
• Equitable access to health and LTC services requires – besides the absence of legal, financial and other barriers that exclude the most vulnerable from utilizing these services – well functioning broader social protection programmes creating a supportive environment.
Some social, economic and demographic factors – such as low income, age, gender and living alone – increase the likelihood of incurring catastrophic levels of OOP expenditure and can therefore be considered as root causes of vulnerability. Against this background, specific approaches addressing these root causes should be developed in order to achieve equitable access for the most vulnerable members of the population.
related issues, governments are advised to identify and close gaps in coverage and develop effective policies targeting the most vulnerable. They might include:
- specific subsidies providing for coverage of the most vulnerable;
- tailored benefit packages for those most in need; and
- abolishment of co-payments and user fees, setting ceilings to limit the burden of OOP
payments and exemptions for those most in need.
In addition to developing an adequate design of health and LTC schemes, steps should be taken to create an enabling environment supporting equitable access to needed services. This would imply building national social protection floors that are based on providing income support to the elderly, at least to a nationally defined minimum level, and protecting them from the financial consequences of accessing health and LTC services. It is suggested building related social protection systems with a view to achieving equitable access based on the following key principles:
- universality of social protection coverage based on financial solidarity;
- entitlements to adequate benefits prescribed by law; and
- coordination and coherence of existing social protection schemes that should be built
6.
Summary and conclusions
Receiving health and long-term care when in need and adequate social health protection from related financial impacts are considered fundamental human rights, which are highlighted in the Social Security (Minimum Standards) Convention, 1952 (No 102). The elderly are particularly at risk, as they are prone to ill health and disability conditions that necessitate health care and LTC. However, social protection systems in the countries observed do not provide adequate protection for the elderly:
- Out-of-pocket payments for health care concern on average about 70 per cent of the
elderly population; about 5 per cent have to face OOP expenditures as a consequence of LTC.
- Economic consequences of such expenditures on households may be severe and
constitute a threat to their financial sustainability and bring about impoverishment.
- The impact of related private expenditure for LTC is higher for the poor than for the
rich, and some social groups – such as women and individuals living alone – are at a higher risk of OOP.
- The availability of services constitutes an important problem in most countries given
the lack of skilled workers providing services to the elderly.
Given demographic developments, the problems observed are likely to increase in the future. In order to meet the current and future needs of the elderly, and particularly vulnerable groups among them, population coverage should be universal and more effective; efficient social health protection systems are also desirable.
This requires, in particular, that more resources should be made available for the elderly, especially to further develop LTC schemes with a view to:
o increasing the scope of benefits;
o ensuring the affordability, availability and delivery of services; and
o improving the quality of services in order to respond more adequately to needs.
Furthermore, measures should be envisaged to facilitate the delivery of informal car by covering family carers in social protection systems and providing compensation, e.g. cash benefits and allowances. In addition, the widespread shortage of the health and LTC workforce needs to be addressed by creating decent working conditions.
Appendix
* *1 - 996 ! >
; A " -* &.).
-2 0 2 4 6 8
EU 27 Belgium Bulgaria Czech Republic Denmark Germany Estonia Ireland Greece Spain France Italy Cyprus Latvia Lithuania Luxembourg Hungary Malta Netherlands Austria Poland Portugal Romania Slovenia Slovakia Finland Sweden United Kingdom Iceland Liechtenstein Norway Switzerland Andorra
* 8 > $ )!
& ! *
; A " 0 !
*0 (&# > 2 " #
; A " ! 4 " C ! D 7 ! !
" - " &! " . ! = . " =
0 2 4 6 8 10 12 E U 2 7 B e lg iu m B u lg a ri a C ze ch R e p u b li c D e n m a rk S p a in F ra n ce It a ly C y p ru s La tv ia Li th u a n ia Lu xe m b o u rg H u n g a ry M a lt a N e th e rl a n d s P o la n d P o rt u g a l R o m a n ia S lo v a k ia F in la n d S w e d e n U K N o rw a y 2007 2060 + 80%
+ 25% + 29%
*6 + 1 $23 3 - * (
$23 3 1 ! 6
; A " /;@ ) 4*
= 1 ? ! = =
& * *1 - 1 2 3
6
* = = 1
; 27 44 6 7
& . 27 47 6 0 77
1 27 4 42 $7 6 0
26 0 42 6
! 27 47 6 64 $
- . 27 2 44 $6 6
27 44 $$ 6 $
& % 24 42 2 4 $
24 $ 42 6$ 2
1 9 24 $ 47 $
( & 27 47 4$ 6 20
; A " & )* ) +*
5 75 5 75 5 75 6 5 675 4 5 475
=
& * , 1 2 3 - * ( 1 1
2 3 5 (&# ! :
6
; :
0 6 2
; " $ $$ 2 $7 7 4 74
+, 7 7 2 66 6 7 7 0 7
& . " 4 0 6 2 $2 7 $
+, $ 4 0 6 $$ 4
1 " 40 2 $ 2 7 7
+, $ 4 4 72 76 67
" 74 02 2 6 2 27 7 27
+, 7 $ 2 4 4 0 2 2 $
! " 4 2 24 6 $ 44 6
+, 2 6 0 4 $4 6 $2
- . " 6 6 7 60 2 22 2 4
+, $2 7 70 4 $ 7 74 7 7
" $ 2 2 $4 6 $ 0
+, 6 0 7$ $ 6 4 4
& % " 7 $ 7 4 06 4 27
+, 7 2 2 4 0 $2
( & " $ 0 2 0 2
+, 7 2 0 60 0 77 4 0 6
; A " & )* + ,
+, " & - " &! . ! & . / &
! ! ! ! ! & ! & % ;=
& *0 , 1 "" !
: 6
# !
; :
0 6 2
; / 24 6 $ 6 0 6 $7 $ $
+, 4 4 6 2 2 6
& . / $4 0 0 6 0 $7 0 $ 4
+, 7 0 6 7 7 6
1 / 0 4 06 0 04 7 06 2 0
+, 6 6 7
/ 6 4 4 0 47 44 2 4$ 6
+, 2 4 6 6
! / 6 $ 4 6 7 2 70 $ 22 4
+, 6 4 4 4 6 4
- . / 0 $ 6 $ $ 7 $7 $
+, 4 7 7 4
/ 4 4 2 47 $ 7 2 2 2
+, 7 $ 0
& % / $6 6 $$ $0 0 0 $ $0
+, 6 7 6 7
/ $4 7 $$ 2 $$ 4 $7 4 $7 0
+, 6 6 6 0 6 6 6 4
1 9 / 4 $ 2$ $
+, 6 $ 6 6 4 4
( & / 07 6 07 02 06 7 06 $
+, 2 2 2 0 2 $ 2 0
& *6 ; "" !
: 6
# ! ;
; :
0 6 2
;
! " & 6 4 0 7 42
! 6 6
! $ $ 6
+, 4 $0 4 7 $ 24 7 07
( &
! " & 4 $0 $ $ 4 $
! 4 2 2 66
! 7 7 2 74 0
+, $ 6 2 6 4 $ 7 0
! " & $$ 7 4 4
! 26 0 4
! 22 $ 2 74 6$
+, 0 $0 4 4 6 4 2
& .
! " & 4 6 7 0 4
! 6$ $ 2 4
! 6 42 2 6 2
+, 7 $ 7 4 20 $2
! " & 7 6 6 7 47
! 2 7 $
! 7 2 7 47 2
+, 7$ 20 22 6 22
- .
! " & 4 2$ 72 4 0 44
! 6 6
! 6 27 20 6$ 0
+, 26 6 0 6 $ 7 0
! " & $7 2 6 7
! 6 2
! 04 46 2 44
+, $2 7 20 4 4 6
!
! " & 7 76 07 7 2
! 7 6 6 7
! 26 6 6 $ 74
+, 00 7 22 4 6
1
! " & 6 27 44 7 4
! $ 4
! 0$ 4 $
+, 7 4 00 6 $$ 6 7$ 6 46
1 9
! " & 0 06 47 6 $
! 7 22 66 76
! 24 66 $0 24 0
+, 4 7 6 4 22 0 62
; A & )* + ,
&! 9 & ! = 3 #!
E S S P a p e r N 3 1 .d o c 4 1
& *2 , 1 1 - "" (&# 2 3 6
* / ? ! . ! + , ,- ,- 5
!
3 ! 1 &
& ; + )5* 0 7 6 $ 0 $ 7 0 2
3 " #! +,
5 3 C 6 7 4 0 4 6 4 7 6 7 $
@ 5
3 ! +, = 7 6 4 0 2 0 6 2 4 0 4 6
8 9 +,
) 5 7 : ! ! * $ 4 $ $
8 9 & +,
) 5 7 : ! ! * 4 7 4 2 7 6 0 0 6 2 7 2 2
- & E . +, 9 > ! ! ! +, > ! ! ! +, > ! ! ! +, > ! ! ! +, > ! ! ! +, ; > ! ! ! +, > ! ! ! +, > ! ! ! +, > ! ! ! +, ; "" &" = 3
1 +, 40 4 7 6 $ 4 B 6 2 66 4 B
= . ! .& )5
& * 2 0 0 7 4 6 7$ $ 62 7 0 7 2
# = 3 )B 5
& * )5* 0$ $ 6 4 7 62 2
- & E . ! = 3 #!
3 3 & 3 & 3 &
3 3 3
& 3 & 3 & 3 & 3 &
- 3 !
& = 7 0 4 ; 47 2 $4 70 7 7$ 4 2$ $ 6 7 7$
+ = = ?
3 #! 77 $4 7 2 6 4 $ 0$ 6 7$ $ 7 6 $ $2
' & = & 3 #!6 42 2 7 $4 0 7 2 $ 0 6
; A " & )* ) 4* C ) * / ! 1 F 3 = 3 . + ?, & ; G = "
' " 1 3 #! ) ! ! & * +, & E & ! ! ) * & E '
" 1 3 #! ? 3 #! 6' " 1 1 & 3 #! +, &
Bibliography
Barr, N. 2010. ‘Long-term care: A suitable case for social insurance’, in Social Policy &
Administration, 44(4) (Wiley-Blackwell), pp.359-374.
Chaloff, J. 2008. Mismatches in the formal sector, expansions of the informal sector:
Immigration of health professionals to Italy (OECD Health Working Paper No. 34 (OECD, Paris).
Comas-Herrera, A.; Wittenberg, R. 2010. “Expected lifetime costs of social care for people
aged 65 and over in England”, in L. Curtis (ed.): Unit costs of health and social
care 2010 (Canterbury, PSSRU).
European Commission (EC). 2009. 2009 Ageing Report: Economic and budgetary
projections for the EU-27 Member States (2008-2060) (Luxembourg).
Fujisawa, R.; Colombo, F. 2009. The long-term care workforce: Overview and strategies
to adapt supply to a growing demand, OECD Health Working Paper, No. 44 (Paris, OECD Publishing).
Gleckman, H. 2010. Long-term care financing reform: Lessons from the U.S. and abroad
(New York, the Commonwealth Fund).
Huber, M.; Rodrigues, R.; Hoffmann, F.; Gasior, K.; Marin, B. 2009. Facts and figures on
long-term care – Europe and North America (Vienna, European Centre for Social Welfare Policy and Research).
ILO. 2010. World Social Security Report 2010 (Geneva).
Kanellopoulos, C. N.; Gregou, M. 20