142
The Impact of Variety Seeking, Social Status, Quality and Advertisement
Towards Brand Switching in Smartphone Product (A Case Study of BlackBerry
User Thas Has Ever Changed Into Another Smartphone Product in Surabaya)
Megan Faustine
International Business Management Program, Petra Christian University Jl. Siwalankerto 121-131, Surabaya
E-mail: [email protected]
ABSTRACT
When people starts to regard a smartphone as their daily need, BlackBerry, who had ever become a king in Indonesia’s smartphone industry, suddenly was beaten up. The user starts to change their BlackBerry into another smartphone product. The surprising phenomenon encourages all smartphone industries to have a better performance.
This research is conducted to know the impact of variety seeking, social status, quality and advertisement towards brand switching that has been done by BlackBerry user in Surabaya. A total of 103 respondents filled the questionnaires by simple random sampling method. The data was analyzed using Multiple Linear Regression Analysis. The result shows that variety seeking, social status, quality and advertisement simultaneously impact Brand Switching. When analyzed individually, only variety seeking that has a significant impact towards brand switching decision.
Keywords: Brand Switching, BlackBerry, Variety Seeking, Consumer Behavior.
ABSTRAK
Saat masyarakat telah menganggap smartphone sebagai kebutuhan hidup, BlackBerry, smartphone yang pernah menjadi raja di Indonesia, terkalahkan oleh produk smartphone lainnya. Para pengguna mulai mengganti BlackBerry mereka ke smartphone lain. Kejadian ini tentu menampar seluruh pemilik industri smartphone untuk memberikan yang lebih baik lagi.
Penelitian ini dilaksanakan untuk mengetahui pengaruh dari kebutuhan variasi, status sosial, kualitas, dan iklan terhadap keputusan perpindahan merek yang telah dilakukan oleh pengguna BlackBerry di Surabaya. Terdapat total 103 narasumber yang telah mengisi kuesioner dengan metode simple random sampling. Data tersebut dianalisa menggunakan Analisis Linear Berganda. Hasil dari analisa tersebut mengungkapkan bahwa kebutuhan variasi, status sosial, kualitas, dan iklan berpengaruh secara bersamaan terhadap keputusan perpindahan merek. Ketika di analisa terpisah, hanya kebutuhan variasi saja yang memiliki pengaruh individu terhadap keputusan perpindahan merek.
Kata Kunci: Perpindahan Merek, BlackBerry, Kebutuhan Variasi, Perilaku Konsumen.
INTRODUCTION
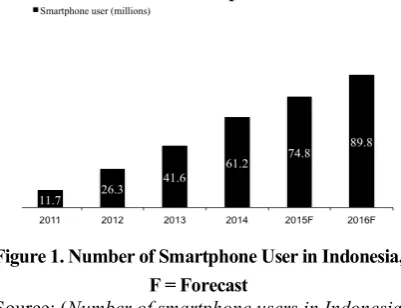
“Smartphone and social media expand our universe. We can connect with others or collect information easier and faster than ever” (Goleman, 2011).I The number of smartphone user in the world, including in Indonesia, keep increasing year by year. Referring to Figure 1.1, Indonesia’s smartphone user in 2011 is up to 11.7 millions, and in 2014 it’s reaching 61.2 millions (Number of smartphone users in Indonesia 2011-2017, 2014).
143
Figure 1. Number of Smartphone User in Indonesia, F = Forecast
Source: (Number of smartphone users in Indonesia 2011-2017, 2014), (e-Marketer, 2013)
However, unfortunately, Indonesian smartphone users do brand switching from BlackBerry to another smartphone brand in the recent time. People start leaving Blackberry smartphone behind, which means that Indonesia is not a BlackBerry Country anymore. Referring to Figure 1.3, the market share of BlackBerry in Indonesia fell dramatically from 43% in 2011 to only 4% in 2014. Even BlackBerry lost to Indonesia’s local smartphone like Advan, Evercross, and Smartfren (Sadewo, 2014).
This is a very surprising phenomenon that happens in Indonesia’s smartphone industry. Even though BlackBerry still is a smartphone that has wide range of applications like other smartphone has, people start to neglect it and change into another brand. In Q4 2014, the top 3 smartphone brands that lead the Indonesian market are Samsung (26.4%), Smartfren (15.4%), and Evercross (13.4%) (Khairuddin, 2015). Sadly, even though BlackBerry ever became the king and throw out a blast performance for several years, right now is nowhere to be found and slowly disappeared from the market.
Looking that Indonesian consumer could easily do brand switching, meaning leaving BlackBerry behind and change into another smartphone after all the BlackBerry fever that happened throughout the years, the author become really curious what are the real factors affecting it.
From the four previous researchers, the author choose four factors that might be affecting the Brand Switching decision in BlackBerry, which are variety seeking, social status, quality and advertisement from Naibaho (2009), Lam, et al (2010), Gunawan (2013) and Suharseno, Hidayat & Dewi (2013). All these four factors are derived from the four previous researchers that have ever done a research about brand switching decision. This will be discussed further in Literature Review.
The author realized that the time would not be enough to do this research throughout Indonesia. Hence, the author chooses Surabaya citizen, who ever
earned and used a BlackBerry, but then do the act of brand switching to another smartphone product as the population.
Surabaya is the second biggest city in Indonesia. Big city means a lot of BlackBerry users, as almost all the phone stores sell BlackBerry because of the high demand when it was really famous (Sadewo, 2013). In addition, big city always follow – up the latest technology product and it is distributed really fast in the big city. Underlying that reason, it will be more relevant to distribute the questionnaires among Surabaya people.
LITERATURE REVIEW
Smartphone
According to Pitt, et al (2011) smartphone is not only can receive phone calls and text messages, but it also able to send and receive e-mails, provide Internet access, and often has other capabilities such as a camera and a large extensible data storage capacity. Moreover, smartphone is also programmable and have the similar processor and capability as laptop or desktop computer.
Consumer Behavior
If only firms can understand the purchasing habits of potential customers, or a slight hint of the customer behavior, then they can try to lure them inducements to switch product.(Fudenberg & Tirole , 1999).
Sheth (1991) explain that there are five values of consumer behavior:
The first one is Functional value. Consumer decisions to buy or use a product or service are based on the attributes of the consumable item and how well they fulfill the consumers’ utilitarian needs.
The second one is Social value. Social value involves highly visible products or services or objects to be shared with others (such as gifts). It may be chosen more for the perceived social image it conveys than for functional performance.
The third one is Emotional value. This value influences decisions because of a product’s potential to arouse emotions that are believed to accompany the use of a product. Aesthetics, such as beauty and artistry, can add emotional value to a product.
The fourth one is Epistemic value. It applies when consuming or experiencing new products or services, such as buying a new computer or mobile phone. Epistemic value factors in decisions when a person is bored with a current product, curious about something different, or just wants to experiment with something new.
144
Variety Seeking
Mowen and Minor (1998) said that variety seeking is the act of customers to purchase a new product even though they are satisfied with the old one. When the customers feel bored or even dissatisfied with the product they are using now, in this case smartphone, then they will try to seek for other varieties (Sulistyaningrum, 2012). Another thing that can derive variety seeking is the desire that comes from the customer inner-self for the unfamiliar and their hunger for information (McAlister & Pessemier, 1982).
Social Status
Kotler (2008) implies that community could affect consumer choices on buying products. In addition, community could change the consumer mind and their decision in doing Brand Switching.
Furthermore, Kotler and Armstrong (2001) stated that there are three social factors that involved in consumer decision:
The first one is Reference group. This group has direct and indirect influences towards the consumer decision in buying a product.
The second one is Family.Family could give a big impact towards the decision, because it has a very close relationship with the customer.
The third one is Status in the society.Consumer chooses a product that represents their status in the society. They hope that the society will regard them as a high or upper social class even though in the reality they are not.
Lam, et al (2010) added that the nature of the people is to seek for their identity. People try to go into a certain community and they are willing to adapt to get accepted. One of the adaption processes might be started from switching brands or products like the community they wish to join. In such ways, the community could distinguish themselves from the others.
Quality
Quality is the overall measurement of product or service performance. This measurement will be more valid if it is measured based on the customer point of view (Kotler, 1997).
Irawan (2008) identified 7 dimension of quality that customers usually noticed about:
The first one is Performance. Performance is related to the main function of a product. A good product is the one, which can function or perform well as it is supposed to be.
The second one is Reliability. The product can function really well in a certain period of time with certain conditions. The lower the probability to broke, it means the more reliable the product.
The third one is Features.The product has other functions that are useful for the customers.
The fourth one is Durability.Durability is a lifetime of a product. The longer the lifetime, the more durable it is.
The fifth one is Aesthetics. The product should be attractive enough in terms of the overall design and look.
The sixth one is Service. If something happens to the product and need to be repaired, it must be repaired fast, accurate, and the place of service must be easy to be found by the customers.
The seventh one is Conformance. It is a measurement whether the product specifications stated meets the consumer needs or wants.
Advertisement
Advertising can be used as a “frame” to many firms. Here, a frame means companies use the best features or advantages in their product in the advertisement. Hence, the consumer could get an insight how satisfied they would be if they bought the product (Deighton, 1984).
To give a deeper understanding, Kotler (2008) defined advertisement as a non-personal presentation and promotion of goods or services that a company paid for. There are also three types of advertisement, according to Kotler (2008):
The first one is Informative. New products mainly use this type of advertisement. They could introduce the product so the customers notice that they are new in the market.
The second one is Seductive. This is very important for industries with high competitors. The advertisement needs to be very competitive and truly emphasize on the most significant advantage of the product.
The third one is Reminder. For those in the mature stage, advertisement is a reminder to assure the customer that they already made the right choice. The company put advertisements in public places to know that they’re always exist and still great in the market.
Brand Switching
Brand switching is the process in which consumer switches from the usage of one product to another product, but of same category. (Kumar & Chaarlas, 2011).
Schiffman, Hansen and Kanuk (2008) said that there are three types of brand switching, which are:
The first one is Exploratory Purchase Behavior. In the first type, there are two reasons why consumers do brand switching. First, is to gain new experiences. Second, is maybe they can get a better alternative.
The second one is Vicarious Exploration. Consumers do brand switching because they get new information and different experiences about the choices that they have.
145
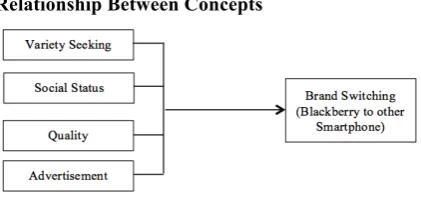
usually fit with technology products, where some models may offer more attractive features than others.Relationship Between Concepts
The author got the four independent variables from four previous researchers. The first independent variable, Variety Seeking is get from Naibaho (2009) research framework. Social Status and Advertisement as two of the independent variables are get from the further research suggestions in the Lam, et al (2010) research report. It is stated that they only make the research in one variable of market disruptions, which is new product. The other two variables, Social Status and Advertisement, should be studied further. Hence, the author uses Social Status and Advertisement as two of the Independent Variables in this research. For Quality, the author uses the further research recommendations from Naibaho (2009) and Gunawan (2013). These two researches did not use Quality as one of the independent variable, but they use it as one of the indicators for consumer dissatisfaction in Naibaho (2009) and consumer trust in Gunawan (2013). It is stated that Quality should be researched further.
Therefore, the author would like to research it further about the four independent variables, which are Variety Seeking, Social Status, Quality and Advertisement to get the result, whether those factors might be affecting brand switching from BlackBerry to other smartphone.
To conduct this research, the author will use these hypotheses below:
H1: The variables (Variety Seeking, Social Status, Quality and Advertisement) simultaneously have a positive impact towards Brand Switching H2: Variety Seeking has a positive impact towards
Brand Switching
H3: Social Status has a positive impact towards Brand Switching
H4: Quality has a positive impact towards Brand Switching
H5: Advertisement has a positive impact towards Brand Switching
RESEARCH METHOD
The author wil use Explanatory Study from Cooper & Schindler (2011) because it is useful to explain the reasons or factors affecting a phenomenon.
In the description of the variables, there will be minimum 3 indicators in explaining each of the variables. Starting from the independent variables, Variety Seeking will be using Mowen and Minor (1998) theory as the indicators: Boredom “Does the customer feel bored with their BlackBerry?”, Curiosity “Does the customer just want to try anoter smartphone product?”, Disappointed: Does the customer feel disappointed with their BlackBerry?”.
Social Status will be using Kotler & Armstrong (2001) theory, and the indicators are as follows: Follow “Does the customer change their BlackBerry to other smartphone because their idol or other famous have changed their BlackBerry to other smartphone?”, Adapt “Does the customer change their BlackBerry because their families, friends, or groups have changed their BlackBerry?”, Social Mobility “Does the customer change their BlackBerry so they will be regarded as the “high” class?”.
Quality will be using Irawan (2008) theory, and the indicators are: Perfromance “Does BlackBerry often hang?”, Durability “Does the battery last longer?”, Service “How long does BlackBerry need to be repaired?”, Feature “Does the feature complete like any other smartphone?”.
Advertisement will be using Kotler (2008) theory and the indicators are: Appeal “Does another smartphone product advertisement more appealing rather than BlackBerry?”, Informative: “Does another smartphone product give clearer and more complete information rather than BlackBerry?”, Familiarity: “Does another smartphone product’s advertisement is easier to be found rather than BlackBerry?”.
For the dependent variable, which is Brand Switching, it’s adapted from Schiffman, Hansen & Kanuk (2008) theory, and the indicators are : Exploratory Purchase Behavior “I have done brand switching from BlackBerry to another smartphone to get better alternatives.”, Vicarious Exploration “I have done brand switching from BlackBerry to another smartphone to get new experiences.”, Use Innovativeness “I have done brand switching from BlackBerry to another smartphone because other smartphone product is more attractive and innovative.
The author will collect information directly from the customers or objects of research through questionnaires. Hence, based on Cooper & Schindler (2011) theory, the author can say that this research is using primary source. In addition, the author also use secondary source such as books and journals as the underlying theories, to represent the whole concept used in the research.
For the description of data, the author will be using Cooper & Schindler (2011), which are nominal data for screening questions like gender and occupation, ordinal data for questions like age, monthly spending, blackberry usage, and brand switching Experience. Not to forget, interval data for the scaling method, where the author use Likert Scale, founded by Rensis Likert (1932) with 5 level of agreements, that consists of : Strongly Disagree, Disagree, Neutral, Agree, Strongly Agree.
146
The author uses the simple random sampling method from Cooper & Schindler (2011) in the research. The author spread the questionnaires through social media communities and friends by asking random respondents one by one before giving the questionnaire, whether they have done brand switching from BlackBerry to another smartphone or not. To determine the sample size, the author use Pallant (2011) formula that sample size must be larger than 50 + ( 8 x number of independent variables) and the result is more than 82 samples.RESULTS AND DISCUSSION
The author will be using SPSS or Statistical Product and service Solution ver. 21 for Machintos to analyze the data. In the research, the author use Multiple Linear Regression to explain the relation between the independent variables and the dependent variable.
However, first, based on Ghozali (2011) theory the author will justify the data using Reliability and Validity Test. After that, four classic assumption test which are Normality Test, Multicollinearity Test, Heteroscedasticity Test, and Autocorrelation Test will be conducted. If the data also got pass through it, then the Hypotheses Testing will be conducted, consists of F-test, t-test, and the last one is the Adjusted R2.
There are a total of five variables, consist of four independent variables and one dependent variable. These variables will be justified by using Reliability Test & Validity Test from Ghozali (2011) theory.
Table 1. Result of Reliability Test Variable Cronbach’s
Alpha
N. of Items
Variety Seeking .760 3
Social Status .704 3
Quality .715 4
Advertisement .864 3
Brand Switching .757 3
The entire Cronbach’s Alpha for the variables are above the minimum requirement from Ghozali (2011) theory, which is all the Cronbach’s Alpha for the variables must be above 0.70.
Table 2. Result of Validity Test
Variables Indicators Sig. (2-tailed)
Variety Seeking
Boredom .000
Curiosity .000
Disappointed .000 Social Status
Idol .000
Families&Friends .000 “High Class” .000
Quality
Performance .000 Durability .000
Service .000
Feature .000
Advertisement
Appealing .000
Informative .000 Easy to be found .000
Brand Switching
Better alternatives .000 New Experiences .000 Attractive & Innovative
.000
Refer to the Table 2, all the correlations inside the indicators are significant, with the result below 0.05. It is match with the requirement from Ghozali (2011) theory, hence the data are reliable and valid to be used in the further analysis.
After that, the data should be tested using the four classic assumption test.
Table 3. One Sample Kolmogorov – Smirnov Test
Unstandardized Residual
N 103
Asymp. Sig. (2-tailed) .200
It is shown from the statistic test, that the residual data is normally distributed because the significance level is higher than 0.05. Hence, this data passed the normality test, according to Ghozali (2011) theory.
Table 4. Multicollinearity Test Result
Model Collinearity Statistics Tolerance VIF
Variety Seeking
.764 1.308
Social Status .945 1.059
Quality .976 1.024
Advertisement .764 1.308
From table 4, the author and the readers can focus on the tolerance and Variance Inflation Factor (VIF) value. The coefficients show that there are no independent variables with tolerance value below 0.10. Tolerance value more than 0.10 means there is no correlation within the independent variables. The VIF score for each independent variable are far below 10. Based on Ghozali (2011) theory, it is assume that there is no multicollinearity within the independent variables in the regression model.
Table 5. Homoscedasticity Test Result
Model Sig.
Variety Seeking .145
Social Status .097
Quality .283
Advertisement .403
147
regression model is homoscedastic.Therefore, the author could say that the model is homoscedastic and pass the heteroscedasticity test.Table 6. Autocorrelation Test Result Model Adjusted
R Square
Std. Error of the Estimate
Durbin – Watson
1 .176 1.50791 1.846
This research has a total sample of 103 respondents and use 5% of significance level with 4 independent variables. From the Durbin Watson table, the author could get the value for Durbin Watson upper bound (Du) for 1.7603 and the lower bound (Dl) for 1.5993.
From table 6, the author and the readers could see that the Durbin Watson value is 1.846. This value, 1.846 is above the upper bound (Du) 1.7603 and below 4 – 1.7603 (4 – Du). Hence, based on the Ghozali theory of autocorrelation test, there is no positive or negative autocorrelation, which means no autocorrelation.
Table 7. Multiple Linear Regression Model
Model
Unstandardized
Coefficients Sig. B Std.Error
Variety Seeking .306 .094 .001 Social Status -.020 .090 .822
Quality .062 .072 .392
Advertisement .128 .072 .081 From the data gathered through questionnaires, the author could create a regression model by looking at the result. The author will use the unstandardized coefficients from table 7 since standardized coefficient is only used when the independent variables have different measurement (i.e: kilograms, liter, and money) (Ghozali, 2011). The regression model is as follows:
Y = 6.844 + 0.306 X1 – 0.20 X2 + 0.062 X3 + 0.128 X4
(4.1) Where
Y = Brand Switching X1 = Variety Seeking X2 = Social Status X3 = Quality X4 = Advertisement
The data has passed the reliability and validity test for the justification of data and four classic assumption tests. The multiple linear regression formula also has come out, then the next one the author will conduct the hypotheses testing.
Table 8. ANOVA Test ( F - Test)
Model F Sig.
Regression 6.435 .000b
From the table 8, the significance is below 0.5. Based on Ghozali (2011) theory, the regression model can be use to predict brand switching or the Variety Seeking, Social Status, Quality, and Performance is simultaneously affecting Brand Switching. Therefore, Variety Seeking, Social Status, Quality, and Advertisement simultaneously impact the Brand Switching of BlackBerry to another smartphone in Surabaya (At least one β is not equal to zero).
T – test is use to test each impact of independent variables towards the dependent variables.
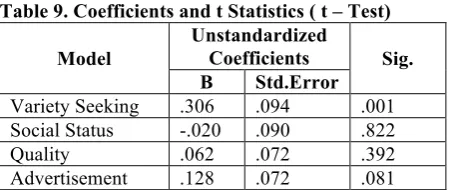
Table 9. Coefficients and t Statistics ( t – Test)
Model
Unstandardized
Coefficients Sig. B Std.Error
Variety Seeking .306 .094 .001 Social Status -.020 .090 .822
Quality .062 .072 .392
Advertisement .128 .072 .081 The first independent variable is Variety Seeking (X1). Referring to table 9, the significance value of this variable is 0.001. Since it is less than 0.05, it means Variety Seeking individually impact Brand Switching from BlackBerry to another smartphone in Surabaya. Referring to table 9 again, the coefficient is 0.306. Since it is a positive value, the relationship between the Variety Seeking and the Brand Switching is a positive relationship.
The second independent variable is Social Status (X2). Referring to table 9, the significance value of this variable is 0.822. Since it is higher than 0.05, it means that Social Status do not individually impact Brand Switching.
The third independent variable is Quality (X3). Table 9 shows the significance value of this variable is 0.392. Since it is higher than 0.05, it means that Quality do not individually impact Brand Switching.
The fourth independent variable is Advertisement (X4). Referring to table 9, the significance value of this variable is 0.081. Again, it means that Advertisement do not individually impact Brand Switching.
148
Table 10. Adjusted R2 Summary Model Adjusted R variables (Variety Seeking, Social Status, Quality, and Advertisement) can explain the variances in Brand Switching of BlackBerry user that changed their BlackBerry to another smartphone product in Surabaya. It also means that there are 82.4% of other variables outside the regression model that have influence towards Brand Switching of BlackBerry user that changed their BlackBerry to another smartphone product in Surabaya.
This research is trying to analyze factors affecting brand switching, taken a case study of BlackBerry user that ever changed their BlackBerry to another smartphone product in Surabaya. After going through reliability & validity test, four classic assumption tests, multiple linear regression, and through the hypotheses testing, the author is going to discuss further about each of the hypotheses result.
The t – Test shows that the significance level of Variety Seeking is less than 0.05, which means Variety Seeking significantly impact Brand Switching. Naibaho (2009) in her research also use Variety Seeking as one of the independent variable to predict Brand Switching. From the research, Variety Seeking also significantly impact Brand Switching. Suharseno, et al (2013) in the research use Variety Seeking as the mediator between customer dissatisfaction towards Brand Switching, and product category towards Brand Switching. The result is also the same, that Variety Seeking gives impact as the mediator between both factors. In addition, Lam, et al (2010) in the previous research suggests that Variety Seeking should be added to predict the Brand Switching behavior.
From the previous research and the t – Test result, the author could say that the result is inline with two previous studies. Customer could purchase a new product with a different brand even though they already satisfied with the previous one (Mowen & Minor, 1998). Hence, it is proven that Variety Seeking impact Brand Switching decision. The consumers’ nature is to seek for a variety.
The t – Test shows that the significance level of Social Status is 0.822 and it is far above 0.05, which means Social Status does not significantly impact Brand Switching.
Based on the further research suggestion from Lam, et al (2010), it is stated that social status as one of the elements in market disruptions should be researched further. On the study, Lam, et al (2010) only studies one thing from market disruptions, which is new product. Another thing that could cause market
disruptions is social status. People value membership and wants to be accepted in certain groups. The brand switching decision could be done because the consumer wants to join a certain group in the society.
In addition, Suharseno, et al (2013) in the study explained that consumer could lure other people to buy or not buy the product if the consumer feels unsatisfied and if they just wanted to do it. Kotler (2008) added that community could affect the way consumer buy product, even community could affect consumer to do brand switching from one product to reasons that might explain why Social Status does not impact as the theory and previous study suggest.
First, it could be that Social Status alone is not enough to predict the Brand Switching behavior. Social Status might need to be combined with other market disruptions elements, which are new product, social status, and also advertising to get clearer result.
Second, Surabaya consumer might not regard social status by what kind of smartphone people are using. Social status might be something more luxurious, more valuable, and more exclusive rather than just a smartphone. In example are limited edition jewelries and branded apparels that not everyone could afford and had it as their collections. Lam, et al (2010) stressed that social status can distinguish consumer from those who did not share such affiliations, forming the in-group and the out-group.
As a matter of fact, more than 60 millions people throughout Indonesia own a smartphone in the year 2014, and this number is still increasing day by day (e-Marketer, 2013). Smartphone could be regarded as everyone needs, and nothing special if people has a smartphone.
Therefore, Social Status might not be one of the concerns in the Brand Switching decision on smartphone. Besides, Rich (2014) implies that consumer usually think more of what kind of specifications they need, how about the shape of the smartphone, is the smartphone fit in their pockets and the applications. The consumer might not think about their social status in purchasing smartphone. Based on these facts, it is reasonable why Social Status does not impact brand switching from BlackBerry to another smartphone in Surabaya.
The t – Test shows that the significance level of Quality is 0.392 and it is far above 0.05, which means Quality does not significantly impact Brand Switching.
149
One of the indicators in customer trust is quality, and this indicator has not been research further, and the researcher suggests to do further research on it.In Naibaho (2009) study, quality is used as one of the indicators of customer dissatisfaction and it is not being researched specifically. Furthermore, Suharseno, et al (2013) conducts a research about customer dissatisfaction towards brand switching, and one of the indicators is quality. The researcher also suggests to research it further and to get more specific.
Based on three previous studies suggestions, the author wanted to know whether quality alone could impact brand switching decisions in a smartphone product, taken BlackBerry user in Surabaya as the case study. Quality could be seen through performance, durability, service and feature as Irawan (2008) suggests. However, the outcome result is not as predicted and does not support the suggestions of the three previous researchers. It is shown that quality does not significantly impact brand switching of BlackBerry user that has changed into another smartphone product in Surabaya.
Quality might not be able to stand alone as one of the variable to predict Brand Switching as the previous researchers suggested. Quality might need to be combined with the other customer dissatisfaction’s indicators, which are expectations, values, needs and additional features. Else, quality could be combined together with customer trust’s indicators which are consumer knowledge, guarantee, consumer believes and consumer involvement as the previous researches has studied.
The t – Test show that the significance level of Social Status is 0.081 and it is slightly above 0.05. However, no matter how small the difference is, as long as the significance level is above 0.05, it means that Advertisement does not significantly impact Brand Switching.
On the study, Lam, et al (2010) only studies one thing from market disruptions, which is new product. Another thing that could cause market disruptions is advertisement. Disruptions can be externally caused by conditions beyond the firm’s controls, such as competitors’ comparative advertising, heavy promotional campaigns and product tampering. Hence, Lam, et al (2010) suggest to study this further.
In addition, Deighton (1984) mentions brand switching effects can result from advertising building brand awareness or altering beliefs about brands. If the efforts are successful, the consumer should be more likely to purchase the brand, meaning either switching the brand, or remain to the same brand as before.
However, in this research the author found out that advertising does not give a significant impact towards brand switching, and it is not supporting the previous researcher suggestion and the theory. The
author believes that there is a reason why this result could occur.
Advertising might give impact towards brand switching, but it depends on where the research is conducted. Different country might have different consumer characteristics. In this research, Surabaya consumer might be care more about sales and promotions rather than the advertising. Nielsen, a global market research company, stated that 61% of Indonesian always looking for discount and promotion (OrangIndonesiaSukaPromosiDiskon , 2012). That is why, even though advertising bombards the consumer, but there are no such words as discount, sales, and promotion, it might not give any impact towards the brand switching decision.
The Adjusted R2 is 0.176 or 17.6%, which means that there are 82.4% of other variables outside the regression model that have influence towards Brand Switching of BlackBerry user that changed their BlackBerry to another smartphone product in Surabaya. As the author has explained throughout the session, there are a lot of other factors might influence brand switching decision. The independent variable social status might not give impact because people do not regard smartphone as a special product. The independent variable quality might need to be changed into an indicator and combined with expectations, values, needs, additional features, consumer knowledge, guarantee, consumer believes and consumer involvement to construct an independent variable such as customer dissatisfaction or customer trust. The independent variable advertising might not give impact because Indonesian customer might concerns more to sales, discounts, and promotions rather than advertisement (OrangIndonesiaSukaPromosiDiskon , 2012).
CONCLUSION
This research is trying to understand whether variety seeking, social status, quality and advertisement are having impact towards brand switching in smartphone product, using a case study of BlackBerry user that change into another smartphone product in Surabaya.
The author has performed several tests to ensure that the data is valid and reliable. Through reliability and validity test in the previous chapter, section 4.1.2.1 and 4.1.2.2 the data is statistically reliable because the cronbach alpha is all above 0.70 and valid because the significance value is all below 0.05. Based on the validity and reliability result, the author then construct the multiple linear regression model based on the coefficients results. Furthermore, to ensure that the model is statistically proven as a good multiple linear regression model, the model need to pass four classic assumptions of linear regression.
150
author has performed normality test, heteroscedasticity test, autocorrelation test, and multicollinearity test. From these four tests, the models are qualified enough to be used.The next thing that the author should do is performing the Hypotheses test. The main purpose is to answer the research objectives that the author has made in chapter 1, section 1.2.
First, the author wants to know whether the hypotheses are simultaneously and individually affect the dependent variables. Hence, the author conducts the F – test. From the F – test, the significance value is 0.000, which is below 0.05. Therefore, the author could say that Variety Seeking, Social Status, Quality and Advertisement as the independent variables are simultaneously affecting Brand Switching as the dependent variable.
Second and third, the author wants to know whether each of the independent variables (variety seeking, social status, quality and advertisement) are affecting brand switching, and which one of them are having the strongest impact towards it. Hence, the author conducts t – test.
From the t – test, the author could know whether the independent variables individually affecting Brand Switching or not. Through table 4.22, the only significance with lower value than 0.05 is Variety Seeking, with 0.306 coefficients or a positive relationship. It means every time Variety Seeking increase 10%, it means there will be an increase in the Brand Switching of 0.306 times 10%.
The other significance value of Social Status, Quality and Advertisement are above 0.05, which means that the factors do not have individual impact towards Brand Switching. The author could conclude that the only independent variables that having the most significant and the strongest impact towards Brand Switching is variety seeking.
Last but not least, the author looks at the Adjusted R2. The value of the adjusted R2 is 0.176% or 17.6%, which means that there are 82.4% of other factors and variables outside the regression model that can impact the Brand Switching decision of BlackBerry user that changed their BlackBerry to another smartphone product. Based on Raju (1984), factors such as brand awareness, monetary deal and product class could impact brand switching. In addition, in Kahn & Louie (1990) journal, it is suggested that price sales, promotion through certain bonus and coupons, post promotions and brand choices also might influence Brand Switching. These factors that have not been research further by the author could also impact brand switching behavior.
Even though the author has successfully conduct the overall research, the author realized that this research is far from perfect. Therefore, the author could list the limitations of this research as follows:
The first one is Limited area coverage. This research is conducted in Surabaya area and only
research about BlackBerry phenomenon. The condition within each city in Indonesia, or even in another country could be different and might not be explainable based on the factors or independent variables used in this research. In addition, factors impacting the brand switching decision towards BlackBerry and the other smartphone products could be different. In example, social status, advertising and quality that do not have individual and significant impact towards brand switching in BlackBerry smartphone might have significant impact individually in brand switching decision towards XYZ smartphone.
The second one is Limited number of independent variables or indicators. The low value of adjusted R2 could exist because of the limited number of independent variables that were used by the author. The author should add more independent variables or even group it as the indicators in the independent variables. For example quality could be combined with expectations, values, needs and additional features and become the indicators of customer dissatisfactions based on the previous researches, Gunawan (2013) and Suharseno, et al (2013) study.
Looking from the list of the limitations of this research, the author would like to give some suggestions for further research:
The first one is to Increase the area coverage. If other researcher, academicians or even smartphone industries would like to know the overall Indonesia consumer behavior, it would be better to conduct the research not just in Surabaya, but the other cities as well. The researcher could gain more insight and knowledge not only from Surabaya consumer behavior, but the overall Indonesia consumer behavior through the research in some cities at a time.
The second one is to Increase the number of independent variables or indicators. This research has a total of 4 numbers of independent variables that are being analyzed, which are variety seeking, social status, quality and advertisement. However, as the author and the readers could know that only variety seeking is having an individual impact towards Brand Switching. Moreover, the value of the adjusted R2 is only 0.176% or 17.6%, which means that there are 82.4% of other outside variables that impacts the brand switching decision towards BlackBerry in Surabaya.
151
REFERENCES
Allen, S., Graupera, V., & Lundrigan, L. (2010). Pro Smartphone Cross - Platform Development : iPhone, BlackBerry, Windows Mobile and Android Development and Distribution. New York: Apress.
Cooper, D. R., & Schindler, P. S. (2011). Business Research Method. New York: McGraw-Hill. Pallant, J. (2011). SPSS Survival Manual. Berkshire: McGraw-Hill.
Deighton, J. (1984). The Interaction of Advertising and Evidence. Journal of Consumer
Research, 11, 763.
e-Marketer. (2013, August 2). Retrieved February 15, 2015, from Smartphone Penetration Doubles
in Indonesia - eMarketer:
http://www.emarketer.com/Article/Smartpho ne-Penetration-Doubles- Indonesia/1010102 Einhorn, B. (2012, December 6). Bloomberg.
(Bloomberg) Retrieved February 24, 2015, from Indonesians Still Love Their University and Institut d’Economie
Industrielle.
Ghozali, I. (2011). Aplikasi Analisis Multivariate dengan Program SPSS 21 (Vol. 7). Semarang, Jawa Tengah, Indonesia: Universitas Diponegoro.
MEREK DAN KEPERCAYAAN
KONSUMEN ATAS PRODUK
TERHADAP BRAND SWITCHING ATAS PRODUK SMARTPHONE (BlackBerry) PADA MAHASISWA UNP.
Irawan, H. (2008). 10 Prinsip Kepuasan Pelanggan. Jakarta, West Java, Indonesia: Elex Media Komputindo.
Khairuddin, I. (2015, February 6). Ini Dia Peringkat Penguasa Pasar Smartphone di Indonesia. Retrieved February 16, 2015, from Selular Last-Purchase-Loyal Consumer. Journal of Marketing Research, 27 (3).
Kotler, P. (1997). Marketing Management: Analysis, Planning, Implementation and Control (Vol. 7th Edition). New Jersey: Prentice Hall Int. Kotler, P., & Armstrong, G. (2001). Prinsip-prinsip
Pemasaran. Jakarta: Erlangga.
Kotler, P. (2008). Manajemen Pemasaran. Jakarta: Indeks.
Kumar, R., & Chaarlas, D. (2011). Brand switching in cellular phone service industry because of bill-related issues faced by clients . International Journal of Event Management Research, 1 (5).
Lam, S. K., Ahearne, M., Hu, Y., & Schillewaert, N. (2010). Resistance to Brand Switching When a Radically New Brand Is Introduced: A Social Identity Theory Perspective . Journal of Marketing, 74.
Mann, P. S. (2007). Introductory Statistics. John Wiley & Sons.
McAlister, L., & Pessemier, E. (1982). Variety Seeking Behavior: An Interdisciplinary Review. The Marketing Center (1287-82), 8. Mobile Millennials: Over 85% of Generation Y Owns
Smartphones. (2014, May 9). (Nielsen)
Naibaho, H. V. (2009). Pengaruh Ketidakpuasan Konsumen Dan Kebutuhan Mencari Variasi Terhadap Keputusan Perpindahan Merek Handphone Gsm Dari Nokia Ke Sony Ericsson (Studi Kasus Mahasiswa Fakultas Ekonomi S-1 Reguler USU) .
Number of smartphone users in Indonesia 2011-2017. (2014). Retrieved February 15, 2015, from www.statista.com:
http://www.statista.com/statistics/266729/sm artphone-users-in-indonesia/
OrangIndonesiaSukaPromosiDiskon . (2012, September 27). Retrieved May 10, 2015, smartphone into a sound environmental information systems strategy: Principles, practices and a research agenda . Journal of Strategic Information System, 20, 28. Pratomo, H. B. (2012, October 6). Sampai kapan
152
http://www.merdeka.com/peristiwa/sampai-kapan-blackberry-perkasa-di-indonesia.html Raju, P. (1984). Exploratory brand switching: Anempirical examination of its determinants . Journal of Economic Psychology, 5 (3), 201-221.
Rich, B. (2014, February 20). Six things to consider before buying your first/next smartphone. (Icon Credit Union) Retrieved May 10, 2015, from LinkedIn: before buying your first/next smartphone. (Icon Credit Union) Retrieved May 10, 2015,
from LinkedIn:
https://www.linkedin.com/pulse/2014022000 1947-21730653-six-things-to-consider-before-buying-your-first-next-smartphone Sadewo, B. (2013, July 23). Telset News. Retrieved
February 15, 2015, from Indonesia 'Negeri BlackBerry' dengan Populasi 15 Juta Pengguna:
http://telsetnews.com/69210/indonesia-negeri-blackberry-dengan- populasi-15-juta-pengguna/
Sadewo, B. (2014, November 8). Indonesia Bukan Lagi 'Negeri BlackBerry' . Retrieved
February 15, 2015, from telsetnews.com: http://telsetnews.com/88666/indonesia-bukan-lagi-negeri-blackberry/
Sadewo, B. (2013, July 23). Telset News. Retrieved February 15, 2015, from Indonesia 'Negeri BlackBerry' dengan Populasi 15 Juta Pengguna: Consumer Behavior. Pearson
Education.
Sheth, J. (1991). Why We Buy What We Buy: A Theory of Consumption Values. Journal of Business Research, 22, 159-170.
Siswi SMA Ini Rela Jual Keperawanan Demi Punya
SPSS Inc. (2010). Introduction to Statistical Analysis with PASW Statistics. Chicago: SPSS Inc.
Suharseno, T., Hidayat, R., & Dewi, D. A. (2013). Pengaruh Ketidakpuasan Konsumen dan Karakteristik Kategori Produk Terhadap Keputusan Perpindahan Merek dengan Kebutuhan Mencari Variasi Sebagai Variabel Moderasi. Jurnal Buletin Studi Ekonomi, 18 (2).
Suharseno, T., Hidayat, R., & Dewi, D. A. (2013). Pengaruh Ketidakpuasan Konsumen Dan Karakteristik Kategori Produk Terhadap Keputusan Perpindahan Merek Dengan Kebutuhan Mencari Variasi Sebagai Variabel Moderasi. Jurnal Buletin Studi Ekonomi , 18 (2).
Sulistyaningrum, D. (2012). Pengaruh Brand Loyalty Terhadap Variety Seeking . Journal of Social and Industrial Psychology , 1, 42.
Schiffman, L. G., Hansen, H., & Kanuk, L. L. (2008). Consumer Behavior. Pearson Education. Sheth, J. (1991). Why We Buy What We Buy: A
Theory of Consumption Values. Journal of Business Research, 22, 159-170.
Siswi SMA Ini Rela Jual Keperawanan Demi Punya
Sulistyaningrum, D. (2012). PENGARUH BRAND
LOYALTY TERHADAP VARIETY
SEEKING . Journal of Social and Industrial Psychology , 1, 42.
Wijaya, K. K. (2015, January 8). nilah 14 smartphone baru yang tampil pada ajang CES 2015. smartphone yang telah dan akan mendirikan pabrik di Indonesia. Retrieved February 24, Retrieved February 15, 2015, from Indonesia
Real Time :
http://blogs.wsj.com/indonesiarealtime/2014/ 12/01/xiaomis-cheap-smartphones-make-a-splash-in-indonesia/
153
http://id.techinasia.com/daftar-pabrik-merek-smartphone-di- indonesia/Wijaya, K. K. (2015, January 8). Inilah 14 smartphone baru yang tampil pada ajang CES 2015. Retrieved February 24, 2015,
from Tech in Asia:
http://id.techinasia.com/inilah-14- smartphone-baru-yang-tampil-pada-ajang-ces-2015/