FARM SCALE NIT ROGEN BALANCES FOR T ERRACED PADDY FIELD SYST EMS
Neraca Hara Nitrogen Skala Usaha Tani pada Sistim Sawah Berteras
Sukrist iyonubowo1 dan Gij s Du Liang2
1 Bal ai Penel i t i an Tanah, Jl . Ir . H. Juanda 98, Bogor 16123
2 Labor at or ium of Anal yt i cal Chemi st r y and Appl i ed Ecochemist r y,
Facul t y of Bio Sci ences Engi neer i ng, Ghent Uni ver si t y, Coupur e Links 653 Ghent -9000, Bel gium
ABSTRACT
Nitrogen balance at farm scale is not only important to refine the site specific nitrogen fertiliser application rate, but also to estimate how much nitrogen fertiliser should be provided every planting season at district level. The nitrogen fertiliser stock for the district can be calculated by multiplying the total planting areas with nitrogen fertiliser rate per hectare. The aims were to evaluate the nitrogen balance of terraced paddy field systems under conventional farmer practices and improved technologies during the wet season 2003-04 and dry season 2004 and to predict how much nitrogen fertiliser should be provided in every planting season for wetland cultivation in the Semarang district. The nitrogen input-output assessments were carried out in terraced paddy fields for the conventional farmer practices (CFP), conventional farmer practices + rice straw (CFP + RS), improved technology (IT), and improved technology + rice straw (IT + RS) treatments. Balances were computed based on the differences between input and output. Nitrogen originating from fertiliser (IN-1), recycled rice straw (IN-2), irrigation (IN-3), and precipitation (IN-4) were grouped as input. Nitrogen removal by rice grains (OUT-1) and rice straw (OUT-2) was considered as output. The input-output analyses showed negative nitrogen balances for all the treatments, both in the wet season 2003-04 and the dry season 2004. The more nitrogen deficit was observed when the nitrogen volatilisation was considered. The nutrient inputs, particularly coming from inorganic fertilisers, were not sufficient to replace the nitrogen removed by rice grains and straw. The application of only 50 kg of urea/ha/season with and without returning rice straw was not enough to reach the optimal yield and should be left out. To balance the nitrogen deficit and to improve cultural practices in wetland rice farming especially terraced paddy field system, about 200 -250 kg urea/ha/season is recommended when the ammonia volatilisation is not considered, where as when the ammonia volatilisation is taken into account about 250-300 kg urea/ha should be added. When the rice yield of 5.73 t/ha is targeted as reached in the IT+RS treatment even higher and the planting areas in the Semarang district is about 24.833 ha for the wet season, the amount of urea should be provided will be about 4.97-6.21 million tons/season/district, meanwhile for the dry season when about 18,440 ha wetland rice is expected to be cultivated is about 4.61 to 5.53 million tons urea/season/district should be available.
Keyword : Nitrogen, input, output, balance, terraced paddy field
ABSTRAK
kg/ha/musim perlu diterapkan, apabila hilangnya nitrogen karena penguapan tidak dimasukkan dalam perhitungan neraca hara. Namun demikian, apabila hilang nitrogen kerena penguapan dimasukkan dalam perhitungan neraca hara, maka rekomendasi pemupukan urea menjadi sebanyak 250-300 kg/ha/musim. Apabila hasil gabah yang ditargetkan sebesar 5,73 t/ha/musim seperti yang didapatkan pada cara IP + RS dan luas tanam pada kabupaten Semarang yaitu 24.833 ha pada musim hujan, maka jumlah urea yang harus disediakan sebanyak 4,97-6,21 juta ton/musim/kabupaten, selanjutnya untuk musim kemarau apabila 18.440 ha sawah diharapkan dapat ditanami, maka sebanyak 4,61-5,53 juta ton urea/musim/kabupaten harus disediakan.
Kata kunci : Nitrogen, input, output, neraca hara, sistim sawah berteras
o meet rice growing demand and improve farmers’ income in Indonesia, rice farming in terraced paddy field systems should be intensified and managed more efficiently. At this time, the production in terraced paddy field systems is confronted with less input and traditionalism managements. Imbalanced nutrient inputs and decreasing soil organic matter contents are commonly identified. There is a need, therefore, to refine nitrogen fertiliser application rate, besides to estimate the nitrogen fertiliser supply at district level to properly manage rice farming especially in terrace paddy field systems.
Recently, the need to protect environ-mental quality is becoming a major concern in agricultural activities, besides improvement of crop production and farmers' income. The use of agro-chemicals has been recognised as an important non-point source of surface and subsurface water contamination (Lal et al.,
1998; Sutriadi. 2009). Nutrients carried away by eroded sediments and water run-off do not only reduce fertility of soil, but also degrade surface water qualities (Duque et al., 2003; Phomassack et al., 2003; Sukristiyonubowo et al., 2003; Toan et al., 2003). Therefore, quantification of nutrient inputs and outputs is urgently needed for agronomical, economical and environmental analyses.
Crop residue is a fundamental natural resource for conserving and sustaining soil productivity. It supplies essential plant nutrients, improves physical and biological conditions of the soil, and prevents soil degradation (Aulakh
et al., 2001; Jastrow et al., 1998; Puget and Drinkwater, 2001; Sukristiyonubowo et al.,
2011b; Sukristiyonubowo and Tuherkih, 2009; Tisdale and Oades, 1979; Walter et al., 1992). However, the nutrients present in roots often
have been ignored in assessment of cropping systems. Most attention was paid to cover crops since they are considered to be a potential source of nitrogen for the following crops (Harris and Hesterman, 1990; Kumar and Goh, 2000; Thomsen, 1993). Currently, it has been observed that the contribution of plant nutrients from roots is important, ranging between 13 and 40% of total plant N (Chaves et al., 2004; Kumar and Goh, 2000). This is also found to be the case for rice residues (Sukristiyonubowo et al., 2011b; 2004; 2003).
T
The objectives were (1) to evaluate nitrogen balances of rice farming at terraced paddy field system under conventional farmer practices and improved technologies and (2) to estimate how much nitrogen fertilisers should be provided at the Semarang district every planting season.
NUTRIENT BALANCE
According to Bationo et al. (1998) Hashim
et al. (1998), Lefroy and Konboon (1999),
Smaling et al. (1993), Stoorvogel et al. (1993), Syers (1996), and Van den Bosch et al. (1998a; 1998b) , nutrient balances can be developed at different scales and for different purposes, including (1) plot, (2) field, farm or catchment, (3) district, province, and (4) country scale. According to Karoline et al., (2007) and Wortmann and Kaizzi, (1998) nutrient balance at farm scale can be used to improve nutrient management by re-examining the routine agriculture practices.
fertilisers, returned crop residues, irrigation, rainfall, and biological nitrogen fixation (Lefroy and Konboon, 1999; Miller and Smith, 1976; Sukristiyonubowo et al., 2011; Wijnhoud et al.,
2003). Furthermore, according to Sukristiyonubowo et al. (2011a) and Uexkull (1989), the outputs include removal through harvested biomass (all nutrients), erosion (all nutrients), leaching (mainly nitrate, potassium, calcium and magnesium), fixation (mainly phosphate), and volatilisation (mainly nitrogen and sulphur). Furthermore, nutrient removed from cultivated land usually exceeds the natural rate of nutrient input. Hence, when the removals are not replaced by application of fertilisers or returning of biomass, soil mining takes place and finally crop production reduces.
Practically, a complete study of nutrient balances is very complicated. In a first approach, nutrient loss is mainly calculated based on removal by harvested products and unreturned crop residues, while the main inputs are organic and mineral fertilisers. So far, it is reported that most assessment is partial analysis of these in- and output data (Drechsel et al., 2001; Lefroy and Konboon, 1998; Wijnhoud et al., 2003).
Many studies indicate that at plot, farm, district, province, and national levels, agricultural production is characterised by a negative nutrient balance. A long-term nitrogen experiment at plot scale in the sloping area of Kuamang Kuning (Jambi Province, Indonesia) provided confirmation that the balance in the plots without input was -4 kg N/ha/yr. However, this is not happen in the plots treated with a combination of high fertiliser application rates
and Flemingia congesta leaves planted in a
hedge row system (Santoso et al., 1995). The similar finding is observed in the newly opened wetland rice. When the nitrogen recommended rate is applied namely 250 kg urea/ha/season combined with 2,000 kg compost made of straw/ha, the N balance is + 44 to 88 kg N/ha/ season (Sukristiyonubowo et al., 2011a).
Studies at the farm level in the semi arid South Mali showed that nutrient balances for a
cotton-based agro ecosystem are -25 kg N/ha/ yr, 0 kg P/ha/yr, and -20 kg K/ha/yr (Van der Pol, 1992). Meanwhile, Van den Bosch et al.
(1998b) found that the average balance for all farms in three different districts in Kenya were -71 kg N/ha/yr, +3 kg P/ha/yr, and -9 kg K/ha / yr. Similar results are observed in northern Nigeria and in Uganda (Harris, 1998; Nkonya et al., 2005; Wortmann and Kaizzi, 1998).
At the district level, negative balances were also observed for major agricultural systems in the Kissi District of Kenya and amounted up to 112 N, 3 P, and 70 K kg/ha/yr (Smaling et al., 1993). Meanwhile, the nutrient balance of rice farming in the Ubon Ratchathani Province (Thailand) was + 6.5 kg N/ha, + 5.2 kg P/ha,and -6.4 kg K/ha based on average yields and recommended fertiliser rates (Lefroy and Konboon, 1999).
At the national level, Jager et al. (1998) and Van den Bosch et al. (1998b) reported that agricultural production in Kenya is characterised by negative nutrient balances and a downward trend in food production. Similarly, Stoorvogel et al. (1993) observed negative N, P, and K balances in the arable land of some Sub Saharan African Countries. Studies in China using data from 1961 to 1997 confirmed that the N, P, and K balance were negative, both at national and provincial levels (Sheldrick et al., 2003).
FARM SCALE NITROGEN BALANCE AT TERRACED PADDY FIELD
The ammonia volatilisation is considered as one of the important losses, affecting N-use efficiency in rice and the overall results and in Indonesia the data are officially not yet published and available. Consequently, the nitrogen input-output analysis is calculated based on with and without taken in to account the ammonia (NH3) volatilisation to avoid
underestimate of the results. Many studies reported that NH3 volatilisation is influenced by
pH, CEC, NH4+ concentration, pounding depth,
when and how fertiliser is applied (Cho et al., 2000; Chowdary et al., 2006; Fan et al., 2006; Ghost and Bhat, 1998; Hayashi et al., 2006; Manolov et al., 2003; Xing and Zhu, 2000). In general, the loss ranges from 20.5 to 33.5% of the amount of N applied, equivalent to 13 to 44.6 kg N/ha, and it is considered a significant loss (Cho et al., 2000; Chowdary et al., 2006; Fan et al., 2006). However, other studies in China and Japan reported smaller losses, about 11% and 1.4 ± 0.8%, respectively (Hayashi et al., 2006; Xing and Zhu, 2000). Ghost and Bhat (1998) reported the range of NH3 losses to be
about 2-30%. As it was not feasible to measure N volatilisation during the field experiments, quantification of NH3 losses was determined
20% of nitrogen fertiliser applied.
The erosion in the terraced paddy field system mainly occurs during harrowing both in the WS 2003-04 and the DS 2004. Moreover, total soil amounts displaced during the harrowing are low; both in the wet and dry season (Sukristiyonubowo, 2008). Therefore, OUT-3 is neglected.
The nitrogen inputs are the sum of nitrogen coming from fertiliser (IN-1), recycled rice straw (IN-2), irrigation (IN-3), and precipitation (IN-4). Outputs are sum of nutrients removed by rice grains (OUT-1) and rice straw (OUT-2). As all rice grains are consumed, OUT-1 was estimated based on rice grain yield multiplied with nutrient concentration in the grains. OUT-2 is calculated according to the total rice straw produced multiplied with nutrient concentration in the straw. Therefore, N balance is constructed according to the formula:
N Inputs (IN) = IN-1 + IN-2 + IN-3 + IN ... (1) N Outputs (OUT) = OUT-1 + OUT-2 ... (2) N Balance = IN – OUT ... (3)
Nitrogen input =arameters
Mineral fertiliser rate (IN-1) and recycled rice straw (IN-2)
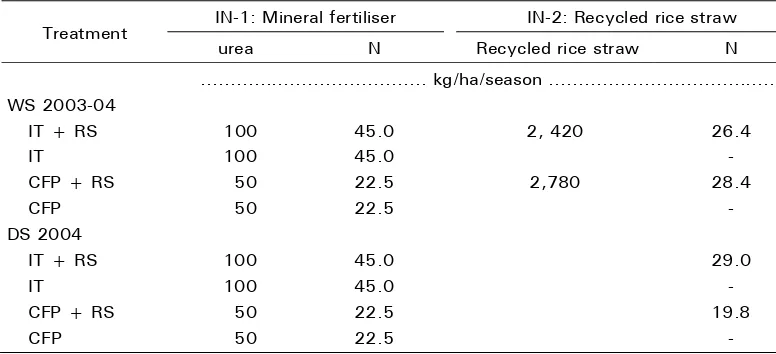
The contributions of inorganic fertilisers to inputs are given in Table 1. For the CFP and CFP + RS treatments, only 50 kg of urea/ha/season is regarded, while for the IT and IT + RS treatments 100 kg of urea/ha/season are taken into account. The IN-1 is 45 kg N for the improved technologies in ha/season, whereas it is only 22.5 kg N for the conventional farmer practices.
The contributions of recycled rice straw are also presented in Table 1. Interestingly, the IN-2 for the CFP + RS treatment in the WS 2003-04 was higher than for the IT + RS treatment. This is due to higher rice straw production in the CFP + RS treatment compared to the IT + RS treatment in the DS 2003, although the concentrations of N is lower. However, the IN-2 for the IT + RS treatment is greater than for the CFP + RS treatment in the DS 2004, as in the WS 2003-04, the production and nitrogen content in rice straw for the IT + RS treatment are significantly superior over other treatments.
It is also interesting to note that the average of IN-2 for the IT + RS and CFP + RS treatments is higher than IN-1 for the CFP treatment. This means that the contribution of 33% rice straw recycling to the nutrient supply is greater than the contribution of the appli-cation of 50 kg urea/ha/season.
Irrigation (IN-3)
Table 1. The contribution of mineral fertilisers and recycled rice straw to input in the WS 2003-04 and the DS 2004
Treatment IN-1: Mineral fertiliser IN-2: Recycled rice straw
urea N Recycled rice straw N
... kg/ha/season ... WS 2003-04
IT + RS 100 45.0 2, 420 26.4
IT 100 45.0 -
CFP + RS 50 22.5 2,780 28.4
CFP 50 22.5 -
DS 2004
IT + RS 100 45.0 29.0
IT 100 45.0 -
CFP + RS 50 22.5 19.8
CFP 50 22.5 -
Source : Sukristiyonubowo et al. (2010); Sukristiyonubowo (2007)
Table 2. Contribution of irrigation water to the nutrient input during rice growth in the WS 2003-04 and DS 2004
Stage Incoming nitrogen Outgoing nitrogen Net input
WS 2003-04 DS 2004 WS 2003-04 DS 2004 WS 2003-04 DS 2004
... kg/ha/season ... CFP
Puddling 0.58 0.29 0.36 0.14 0.22 0.15
Puddling to planting 4.20 3.48 3.06 2.16 1.20 1.32
Vegetative 22.50 3.99 12.96 2.52 9.90 1.47
Generative 9.50 6.96 7.20 3.84 2.30 3.12
Total 36.78 14.72 23.58 8.66 13.62 6.06
CFP + RS
Puddling 1.20 0.41 0.86 0.18 0.33 0.23
Puddling to planting 6.48 5.40 5.64 3.66 0.90 1.74
Vegetative 29.52 6.30 19.98 5.04 9.54 1.26
Generative 12.50 10.44 10.20 6.48 2.30 3.96
Total 49.70 22.55 36.68 15.36 13.07 7.19
IT
Puddling 0.52 0.38 0.34 0.30 0.18 0.08
Puddling to planting 3.24 2.52 2.16 1.26 1.08 1.26
Vegetative 12.60 2.52 8.46 2.10 4.14 0.42
Generative 6.60 5.04 4.80 3.00 1.80 2.04
Total 22.96 10.46 15.76 6.66 7.20 3.80
IT + RS
Puddling 0.68 1.12 0.56 0.93 0.12 0.19
Puddling to planting 6.36 5.10 4.48 3.54 1.50 1.56
Vegetative 25.56 5.67 15.66 4.62 9.90 1.05
Generative 12.30 10.08 10.30 8.40 2.00 1.68
Total 44.90 21.97 31.32 17.49 13.52 4.48
From the field monitoring and information given by the farmers, the total period of water inlet in the WS 2003-04 was found to be about 35 days and in the DS 2004 about 40 days. The difference was mainly due to the lower discharge and other external factors affecting water use in the DS 2004. During the wet season, opening inlet and outlet was aimed to control water level, to avoid dike damages and landslides, while to irrigate rice fields was most important during the dry season. Depending on the treatment, the contribution to N input (IN-3) vary between 7.20 and 13.62 kg N in the WS 2003-04 and 3.80-7.19 kg N/ha/season in the DS 2004. So far, it can be said that N and K input from irrigation water is equivalent to 16-30 kg of urea/ha/season in the WS 2003-04 and about 8-16 kg of urea/ha/season in the DS 2004 (Sukristiyonubowo, 2007).
Furthermore, the IN-3 in the WS 2003-04 is greater than in the DS 2004. This may be explained by: (1) the amounts of incoming dissolved nutrient is greater in the WS 2003-04 than in the DS 2004 (2) there is nutrients contribution coming from rain waters, which is
high, especially in nitrogen and (3) the decom-position product of organic matter and nitrates may be washed away from upstream locations during rain events. In addition, urea applied by farmers upstream and urea used in private plantations (rambutan, clove, tea, and coffee) may be washed away during rain events and may increase nutrients, in this case N in the irrigation water (Sukristiyonubowo, 2007).
Rainfall (IN-4)
The monthly rainfall and its contributions to nitrogen input during the wet season 2003-04 are given in Figure 1. The annual precipita-tion is 3 395 mm, with the highest monthly rainfall in January 2004 being 856 mm.
The total nitrogen gains from the rainfall (IN-4) are about 20.6 kg N/ha. This means the rainfall water supply relatively high N amounts, almost equivalent to 45 kg of urea. In Belgium, N-input from rainfall is about 25 kg N/ha and in South Korea, N input from rainfall is 39.5 kg N/ ha (Sukristiyonubowo, 2007).
Nutrients gain (k
g/ha/
m
ont
h)
Rainfall (
m
m)
Source : Sukristiyonubowo (2007)
Nitrogen output parameters
Crop removal : rice grains (OUT-1) and rice straw (OUT-2)
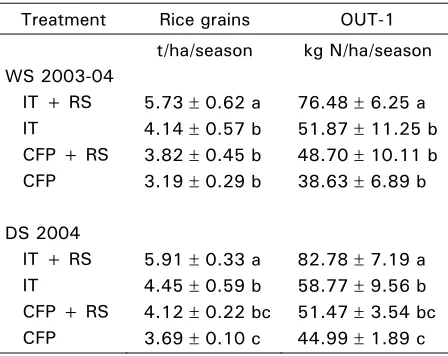
The nitrogen removed through rice grains (OUT-1) in the WS 2003-04 and the DS 2004 are presented in Table 3. Statistically, the data indicated that the variations of grain yields within treatment are small; meaning that soil properties variability within the farmers is small. Since rice grain yields and nutrient contents of the rice grains for the IT + RS treatments are significantly higher than for other treatments, the OUT-1 values also are significantly higher, both in the wet and dry season. Depending on the treatment and season, the OUT-1 range from 38.6 to 76.5 kg N/ha/season in the WS 2003-04 and from 45 to 82.85 kg N/ha/season in the DS 2004. These losses are equivalent to 75-180 kg of urea (45% N). It is also noted that the nitrogen losses are higher than the nitrogen applied as urea in all treatments.
Table 3. Nitrogen output through rice grains in the WS 2003-04 and in the DS 2004
Treatment Rice grains OUT-1
t/ha/season kg N/ha/season
WS 2003-04
IT + RS 5.73 ± 0.62 a 76.48 ± 6.25 a
IT 4.14 ± 0.57 b 51.87 ± 11.25 b
CFP + RS 3.82 ± 0.45 b 48.70 ± 10.11 b
CFP 3.19 ± 0.29 b 38.63 ± 6.89 b
DS 2004
IT + RS 5.91 ± 0.33 a 82.78 ± 7.19 a
IT 4.45 ± 0.59 b 58.77 ± 9.56 b
CFP + RS 4.12 ± 0.22 bc 51.47 ± 3.54 bc
CFP 3.69 ± 0.10 c 44.99 ± 1.89 c
Sources : Sukristiyonubowo (2007)
The nitrogen removed by rice straw (OUT-2) in the WS 2003-04 and the DS 2004 are given in Table 4. The highest OUT-2 is observed for the IT+ RS treatments both in the wet and dry season. Depending on the treatment and season, the OUT-2 range from 49.2 to 87.8 kg N/ha/season in the WS 2003-04 and from 48.6
to 81.7 kg N/ha/season in the DS 2004. These outputs are equivalent to 110-185 kg of urea and higher than mineral fertiliser application rate. Therefore, rice straw should be properly managed to reduce N loss from rice fields.
From the results both in the WS 2003-04 and the DS 2004, we may learn that rice straw on the one hand may be an important nitrogen source for improving soil fertility when it is managed properly. On the other hand, it shows the greatest nutrient loss, when it is removed from the field for animal feeding or burning.
Table 4. Nitrogen output through rice straw in the WS 2003-04 and in the DS 2004
Treatment Rice straw OUT-2
t/ha/season kg N/ha/season
WS 2003-04
IT + RS 7.50 ± 0.91 a 87.77 ± 12.17 a
IT 6.25 ± 0.38 ab 54.43 ± 8.50 b
CFP + RS 6.16 ± 0.77 ab 60.08 ± 6.25 b
CFP 5.25 ± 0.63 b 49.17 ± 17.80 b
DS 2004
IT + RS 6.37 ± 0.30 a 81.72 ± 6.44 a
IT 5.52 ±+ 0.79 b 59.22 ± 11.36 b
CFP + RS 5.33 ± 1.05 b 55.29 ± 12.98 b
CFP 5.10 ± 0.48 b 48.62 ± 7.00 b
Source : Sukristiyonubowo (2007)
Nitrogen balance when ammonia (NH3)
volatilisation is not taken into account
Table 5. The N balance at terraced paddy fields under traditional irrigation systems, in the WS 2003-04 and the DS 2004 when ammonia volatilisation is not considered
Parameter
IN-1: Fertiliser 45.0
(43%) IN-2: Recycled straw 26.4
(25%)
IN-3: Irrigation 13.5
(13%)
Removal by harvest
OUT-1: Rice grains 76.5
Source : Sukristiyonubowo (2007)
highly rice yield. It is also interesting to note that the ratio of contribution of mineral fertiliser (IN-1) to the total amount of inputs was greater in the dry season than in the wet season. This means that the needs for mineral fertilisers may be greater in the dry season than in the wet season, as less nitrogen sources were found in the dry season.
Recycled straw (IN-2) is also an important nutrient source, covering from 25 to 40% of total N inputs, depending on the treatment and season. The IN-2 inputs are getting more important, when no or less inorganic fertilisers are applied like in the CFP + RS treatments. The N inputs are equivalent to 45 to 65 kg of urea.
Although the amounts of nitrogen coming from irrigation water (IN-3) are smaller than the amounts of nutrients originating from inorganic fertilisers (IN-1) and returning rice straw (IN-2),
the contributions of IN-3 are still important especially for the dry season, covering between 6 and 24% of the total N input.
The nitrogen coming from rainfall water (IN-4) is also an important nitrogen source, especially during the wet season, covering from 19 to 36% of the total of N input. With respect to the output, depending on the treatment and season, around 44-50% of total N is taken up by rice grains and the rest by rice straw. This means that N is equally removed by rice straw and rice grains
Table 6. Rice residue production and their contributions to the nutrient pool in the soil in the WS 2003-04 and in the DS 2004
Treatment Rice residue Contribution to the nutrient pool in the soil
N P K
t/ha/season ... kg/ha/season ... WS 2003-04
I T + R S 6.93 ± 1.17 a 43.13 ± 7.29 a 5.21 ± 0.94 a 152.81 ± 59.10 a
I T 4.67 ± 0.97 b 23.35 ± 6.46 b 3.27 ± 0.67 b 88.00 ± 21.90 b
CFP + R S 4.58 ± 1.39 b 22.90 ± 7.28 b 2.29 ± 0.60 b 72.05 ± 32.99 b
CFP 4.57 ± 0.60 b 21.02 ± 1.58 b 2.74 ± 0.78 b 81.84 ± 16.47 b
DS 2004
I T + R S 6.55 ± 0.21 a 42.60 ± 3.98 a 5.23 ± 0.55 a 143.05 ± 6.40 a
I T 5.69 ± 0.68 b 32.46 ± 6.60 ab 3.99 ± 0.48 b 111.94 ± 13.10 b
CFP + R S 5.31 ± 0.88 b 27.23 ± 5.09 b 3.72 ± 0.61 b 91.32 ± 16.71 b
CFP 5.16 ± 0.71 b 24.34 ± 7.12 b 3.61 ± 0.49 b 87.66 ± 12.11 b
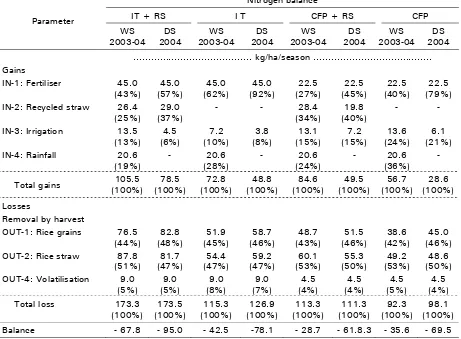
04. This may be explained by increased rice grain and straw productions and no additional input from precipitation, having an input of 20.6 kg/ha. It should also be noted that the N output will even be higher, when NH3 volatilisation is
taken into account and rice residues would be removed from the rice field. The data show that rice residue productions both in the WS 2003-04 and DS 202003-04 are high, ranging from 4.57 to 6.93 t/ha/season, and especially rich in N and K, thus being important nutrient sources. Depending upon the treatment and season, the contribution to the nutrient pool in the soil range from 21.0 to 43.1 kg N/ha/season in the WS 2003-04 and from 24.3 to 42.6 kg N/ha/season in the DS 2004, respectively (Table 6). It is also interesting to note that the N input by rice residue is higher than that the N amount in 50 kg of urea, as applied in the CFP. Therefore, it can be said that the presence of rice residues in terraced paddy field systems may be considered as an important natural nutrient investment. However, as practically the residues always remain in the field, they may be regarded as an organic pool in the soils and they are not regarded as an input or an output. The overall balances would be lower, if the rice residues would be removed from the rice field. In that case, the rice residues should be regarded as an output.
The negative N balances in all treatments also demonstrate that the application rates of nitrogen and organic fertilisers are not sufficient to balance N removed by rice grains and straw. Therefore, to avoid nutrient mining and to sustain a high rice yield, nitrogen fertiliser application rate must be between 200 to 250 kg of urea/ha/season, which implies an increase of about 100-150 kg of urea compared to the current application rate of improved technology (IT+RS and IT) treatments.
Nitrogen balance when ammonia volatilisation is considered
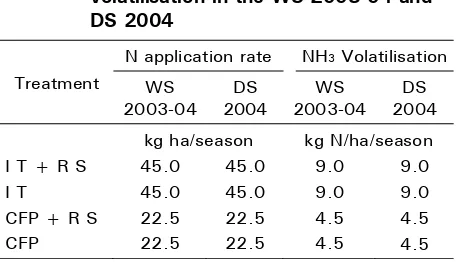
As we adopted that the 20% of N applied is loss through NH3 volatilisation, the nitrogen
deficit is expected to be higher than that input output analysis in which ammonia volatilisation is not considered as output. This input output analysis is important to avoid underestimate of the results, to closely relate to the total nitrogen losses and to simply calculate how much nitrogen fertiliser should be provided for the Semarang district for every planting season. The amount of nitrogen losses through ammonia volatilisation is presented in Table 7.
Table 7. Nitrogen losses through ammonia volatilisation in the WS 2003-04 and DS 2004
Treatment
N application rate NH3 Volatilisation
WS 2003-04
DS 2004
WS 2003-04
DS 2004
kg ha/season kg N/ha/season
I T + R S 45.0 45.0 9.0 9.0
I T 45.0 45.0 9.0 9.0
CFP + R S 22.5 22.5 4.5 4.5
CFP 22.5 22.5 4.5 4.5
The deficits vary between 29 and 95 kg N/ha/season. These values also approved that the application rates of inorganic fertiliser are not enough to replace the nitrogen removed by rice grains and straw. Depending on the treatment and season, the amount of removed nitrogen through rice grains and rice straw range from 93 to 96% of the total nitrogen loss and they are about 94-160 kg N/ha/season. Therefore, to avoid nutrient depletion and to sustain a high rice yield, nitrogen fertiliser application rate must be between 250 to 300 kg of urea/ha/season, which implies an increase of about 150-200 kg of urea compared to the current application rate of improved technology (IT+RS and IT) treatments. Hence, it is strongly recommended that to properly manage terraced paddy fields and to achieve the high rice grain yield (at least about 5.73 t/ha as reached at the IT+RS treatment) about 250 to 350 kg urea/ha/ season should be applied.
How much urea should be provided at planting in the Semarang District?
The Semarang district, where the field experiment was located, is one of the rice producing areas in the Central Java Province. According to Anonymous (2008) approximately 24,823 ha of the lands are granted to wetland rice and around 15,764 ha can be planted two times a year. Regarding the irrigation net work system constructed in the field, the paddy field can be grouped into wetland rice with fully regulated irrigation system (5,525 ha), wetland
rice with half regulated technical irrigation system (4,004 ha), wetland rice with simple irrigation system including the traditional irrigation (8,911 ha), and wetland rice with rain-fed irrigation system (6,017 ha).
Furthermore, it can be estimated that during the wet season about 24 833 ha of the wetland are cultivated for rice, while in the dry season at least about 18.440 ha wetland. When at least 5.73 t/ha rice yield as achieved in the IT + RS treatment even higher is targeted, therefore, the urea should be provided for the Semarang district in the wet season will be 4.97 to 6.21 million tons/district/season, while in the dry season will be 4.61 to 5.53 million tons urea/district/season should be supplied when about 18.4400 ha wetland rice is expected to be planted.
CONCLUSIONS
1. The negative N balances in all treatments, both in the wet and dry season, demonstrate that the rates of mineral fertiliser (100 kg of urea/ha/season) applications is not enough to meet N removals by rice grains and straw. Towards sustainable and profitable rice farming, more nitrogen fertilisers have to be applied. About 200-250 kg of urea/ha/season is recommended when the ammonia volatilisation is not considered, but when the ammonia volatilisation about 20% of nitrogen applied is taken in to account about 250-300 kg urea/ha/season should be applied.
Table 8. The N balance at terraced paddy fields under traditional irrigation systems, in the WS 2003-04 and the DS 202003-04 when ammonia volatilisation is considered
Parameter
REFERENCES
Anonymous. 2008. Semarang dalam angka 2008. Biro Pusat Statistik Kabupaten Semarang.
Aulakh, M.S., T.S. Khera, J.W. Doran, and K.F. Bronson. 2001. Managing crop residue with green, urea, and tillage in a rice-wheat rotation. Soil Science Society of America Journal 65:820-827.
Bationo, A., F. Lompo, and S. Koala. 1998. Research on nutrient flows and balances in West Africa: State-of-the-art. Agricul-tural Water Management 71:19-35. Chaves, B., S. De Neve, G. Hofman, P. Boeckx,
and O.V. Clemput. 2004. Nitrogen mineralisation of vegetables roots residues and green manures as related to
their (bio) chemical composition. Euro-pean Journal of Agronomy 21:161-170. Cho, J.Y., K.W. Han, and J.K. Choi. 2000.
Balance of nitrogen and phosphorus in a paddy field of central Korea. Soil Science and Plant Nutrition 46:343-354.
Chowdary, V.M., N.H. Rao, and P.B.S. Sarma. 2004. A coupled soil water and nitrogen balance model for flooded rice fields in India. Agriculture Ecosystems and Environment103:425-441.
Clark, M.S., W.R. Horwath, C. Shennan, and K.M. Scow. 1998. Changes in soil chemical properties resulting from organic and low-input farming practices. Agronomy Journal 90:662-671.
Drechsel, Pay, D. Kunze, and F.P. de Vries. 2001. Soil nutrient depletion and
Nitrogen balance
IN-1: Fertiliser 45.0
(43%)
IN-2: Recycled straw 26.4
(25%)
IN-3: Irrigation 13.5
(13%)
Removal by harvest
OUT-1: Rice grains 76.5
OUT-4: Volatilisation 9.0
(5%)
population growth in Sub-Saharan Africa: A Malthusian Nexus? Population and Environment: A Journal of Interdisciplinary Studies 22(4):411-423. Duque Sr, C.M., R.O. Ilao, L.E. Tiongco, R.S.
Quita, N.V. Carpina, B. Santos, and T. de Guzman. 2003. Management of soil erosion consortium : an innovative approach to sustainable land management in the Philippines. MSEC-Philippines Annual Report. In S.P. Wani, A.R. Maglinoa, A. Ramakrisna, and T.J. Rego (Eds.). Integrated Catchment Management for Land and Water Con-servation and Sustainable Agricultural Production in Asia. CD-Rom (one CD). Fan, X.H., Y.S. Song, D.X. Lin, L.Z. Yang, and
J.F. Lou. 2006. Ammonia volatilisation losses and N-15 balance from urea applied to rice on a paddy soil. Journal of Environmental Science China 18(2): 299-303.
Ghosh, B.C. and R. Bhat. 1998. Environmental hazards of nitrogen loading in wetland rice fields. Environmental pollution 102: 123-126.
Harris, F.M.A. 1998. Farm-level assessment of the nutrient balance in northern Nigeria. Agriculture, Ecosystems and Environ-ment 71:201-214.
Harris, G.H. and O.B. Hesterman. 1990. Quantifying the nitrogen contribution from alfalfa to soil and two succeeding crops using nitrogen-15. Agronomy Journal 82:129-134.
Hashim, G.M., K.J. Caughlan, and J.K. Syers. 1998. On-site nutrient depletion : an effect and a cause of soil erosion. Pp 207-222. In F.W.T. Penning de Vries, F. Agus, and J. Kerr (Eds.). Soil Erosion at Multiple Scale. Principles and Methods for Assessing Causes and Impacts. CABI Publishing in Association with IBSRAM. Hayashi, K., S. Nishimura, and K. Yagi. 2006.
Ammonia volatilisation from the surface of a Japanese paddy field during rice cultivation. Soil Science and Plant Nutrition 52:545-555.
Jastrow, J.D., R.M. Miller, and J. Lussenhop. 1998. Contributions of interacting biological mechanisms to soil aggregate stabilisation in restored prairie. Soil Biology Biochemistry 30:905-916.
Kumar, K. and K.M. Goh. 2000. Biological nitrogen fixation, accumulation of soil nitrogen, and nitrogen balance for white clover (Trifolium repens L.) and field pea (Pisum sativum L.) grown for seed. Field Crop Research 68:49-59.
Lal, R., F.P. Miller, and T.J. Logan. 1998. Are intensive agricultural practices environ-mentally and ethically sound? Journal of Agriculture Ethics 1:193-210.
Lefroy, R.D.B. and J. Konboon. 1999. Studying nutrient flows to assess sustainability and identify areas of nutrient depletion and imbalance: an example for rainfed rice systems in Northeast Thailand. Pp. 77-93. In Ladha (Ed.). Rainfed Lowland Rice: Advances in Nutrient Management Research. IRRI.
Manolov, I.G., M. Ikeda, and T. Yamakawa. 2003. Effect of methods of nitrogen application on nitrogen recovery from N-15-labeled urea applied to paddy rice (Oryza sativa L.). Journal of the Faculty of Agriculture Kyushu University 48:1-11.
Miller, R.J., and R.B. Smith. 1976. Nitrogen balance in the Southern San Joaquin Valley. Journal of Environmental Quality. 5(3):274-278.
Nkonya, E., C. Kaizzi, and J. Pender. 2005. Determinants of nutrient balances in a maize farming system in eastern Uganda. Agricultural System 85:155-182.
Phommassack, T., A. Chanthavongsa, C. Siha-vong, C. Thonglatsamy, C. Valentine, A. de Rouw, P. Marchand, and V. Chaplot. 2003. An innovative approach to sustainable land management in Lao PDR. MSEC-Lao PDR Annual Report. In
ment Management for Land and Water Conservation and Sustainable Agricultural Production in Asia. CD-Rom (one CD).
Puget, P. and L.E. Drinkwater. 2001. Short-term dynamics of root- and shoot- derived carbon from a leguminous green manure. Soil Science Society of America Journal 65:771-779.
Santoso, D., I G.P. Wigena, Z. Eusof, and X.H. Chen. 1995. The ASIALAND management of sloping lands network: Nutrient balance study on sloping lands.
In International Workshop on Conserva-tion Farming for Sloping Uplands in Southeast Asia: Challenges, Opportuni-ties, and Prospects. IBSRAM-Thailand Proceedings 14:93-108.
Sheldrick, W.F., J.K. Syers, and J. Lingard. 2003. Soil nutrient audits for China to estimate nutrient balance and output/ input relationships. Agriculture, Ecosys-tems and Environment 94:341-354. Smaaling, E.M.A., J.J. Stoorvogel, and P.N.
Wiindmeijer. 1993. Calculating soil nutrient balances in Africa at different scales II. District scale. Fertiliser Research 35(3):237-250.
Stoorvogel, J.J., E.M.A. Smaaling, and B.H. Janssen. 1993. Calculating soil nutrient balances in Africa at different scales. I. Supra-national scale. Fertiliser Research 35(3):227-236.
Sukristiyonubowo and E. Tuherkih. 2009. Rice production in terraced paddy field systems. Jurnal Penelitian Pertanian Tanaman Pangan 28(3):139-147.
Sukristiyonubowo, F. Agus, D. Gabriels, and M. Verloo. 2004. Sediment and nutrient balances under traditional irrigation at terraced paddy field systems. Paper presented at the second International Symposium on Land Use Change and Soil and Water processes in Tropical Mountain Environments held in Luang Prabang, Lao PDR on 14-17 December 2004. Organised by Ministry of Agriculture and Forestry, Lao PDR and sponsored by National Agriculture and Forestry Research Institute (NAFRI),
International Water Management Institute (IWMI) and Institut de Recherche pour le Développement (IRD). Sukristiyonubowo, Y. Fadhli, and S. Agus.
2011a. Plot scale nitrogen balance of newly opened wetland rice at Bulungan district. Journal of Crop science and Soil Science 1(7):234-241.
Sukristiyonubowo, R.L. Watung, T. Vadari, and F. Agus. 2003. Nutrient loss and the on-site cost of soil erosion under different land use systems. Pp 151-164. In A.R. Maglinao, C. Valentin, and F.W.T. Penning de Vries (Eds.). From Soil Re-search to Land and Water Management : Harmonising People and Nature. Proceedings of the IWMI-ADB Project Annual Meeting and 7th MSEC Assembly.
Sukristiyonubowo. 2007. Nutrient Balances in Terraced Paddy Fields under Traditional Irrigation in Indonesia. PhD thesis. Faculty of Bioscience Engineering, Ghent University, Ghent, Belgium. P 184.
Sukristiyonubowo. 2008. Sedimen dan unsur hara yang saat pengolahan tanah pada sawah berteras. Hlm 225-246. Dalam
Prosiding Seminar Nasional Sumberdaya Lahan dan Lingkungan Pertanian. Buku II.
Sukristiyoubowo, A.S. Ibrahim, T. Vadari, and S. Agus. 2011b. Management of inherent soil fertility of newly opened wetland rice at Bulungan district. Journal of Plant Breeding and Crop Science 3 (8):146-153.
Sutriadi, M.T. 2009. Dampak Pemupukan Nitrogen pada Budidaya Tanaman Semusim di Daerah Pertanian Dataran Tinggi (Studi pada Sub DAS Klakah DAS Serayu Kabupaten Wonosobo). Thesis S2 Universitas Indonesia. Hlm 100. Thomsen, I.K. 1993. Nitrogen uptake in barley
after spring incorporation of 15N labelled Italian ryegrass into sandy soils. Plant Soil 150:193-201.
Toan, T.D., T. Phien, D.D. Phai, and L. Nguyen. 2003. Managing soil erosion for sustainable agriculture in Dong Cao Catchment. MSEC-Vietnam Annual Report. In S.P. Wani, A.R. Maglinoa, A. Ramakrisna, and T.J. Rego (Eds.). Integrated Catchment Management for Land and Water Conservation and Sustainable Agricultural Production in Asia. CD-Rom (one CD).
Uexkull, H.R. von. 1989. Nutrient cycling. In
Soil Management and Smallholder Development in the Pacific Islands. IBSRAM-Thailand Proceedings 8:121-132.
Van den Bosch, H., J.N. Gitari, V.N. Ogoro, V.N., S. Maobe, and J. Vlaming. 1998b. Monitoring nutrient flows and economic performance in African farming systems (NUTMON) III. Monitoring nutrient flows and balances in three districts in Kenya. Agriculture, Ecosystems and Environ-ment 71:63-80.
Van den Bosch, H., A. de Joger, and J. Vlaming. 1998a. Monitoring nutrient flows and economic performance in African farming systems (NUTMON) II. Tool Development. Agriculture, Ecosys-tems and Environment 71:49-62.
Walters, D.T., M.S. Aulkh, and J.W. Doran. 1992. Effect of soil aeration, legume residue and soil texture on transforma-tions of macro and micronutrients in soils. Soil Science 153:100-107.
Wijnhoud, J.D., Y. Konboon, and R.D.B. Lefroy. 2003. Nutrient budgets: Sustainability assessment of rainfed lowland rice-based systems in northeast Thailand. Agriculture, Ecosystems and Environ-ment 100:119-127.
Wortmann, C.S. and C.K. Kaizzi. 1998. Nutrient balances and expected effects of alternative practices in farming systems of Uganda. Agriculture, Ecosystems and Environment 71:115-129.
Xing, G.X. and Z.L. Zhu. 2000. An assessment of N loss from agricultural fields to the environment in China. Nutrient Cycling in Agroecosystems 57:67-73.