Development of Micro, Small and Medium Enterprises
and Their Constraints:
A Story from Indonesia
Tulus T. H. Tambunan
Center for Industry, SME and Business Competition Studies, University of Trisakti, Jakarta, Indonesia
Abstract: The main aim of this paper is to discuss recent development of micro, small and medium enterprises (MSMEs) and their current problems in Indonesia, based on analysis of secondary data on their performance focusing on their contribution to gross domestic product (GDP) and productivity, and their constraints. It shows that their GDP share is larger than that of large enterprises (LEs). But it is mainly because their number is huge, while their productivity is low. Their main constraints are mainly high cost of raw materials, marketing difficulties, and lack of capital.
Abstrak: Tujuan utama tulisan ini adalah untuk membahas perkembangan terakhir dari usaha mikro, kecil dan menengah (UMKM) di Indonesia dan masalah-masalah saat ini yang dialami oleh kelompok usaha tersebut. Pembahasannya didasarkan pada analisis data sekunder mengenai kinerjanya dengan memfokuskan pada kontribusinya terhadap produk domestik bruto (PDB) dan produktivitas serta kendala-kendalanya. Tulisan ini menunjukkan bahwa pangsa PDB dari UMKM lebih besar dbandingkan dari usaha besar (UB), tetapi hal itu lebih disebabkan oleh jumlah UMKM yang sangat banyak, sedangkan produktivitasnya rendah. Kendala-kendala utamanya adalah mahalnya bahan baku, kesulitan pemasaran, dan keterbatasan modal .
Gadjah Mada International Journal of Business Vol. 13, No. 1 (January - April 2011): 21 - 43
Corresponding author. E-mail: [email protected]
Introduction
In Asian developing countries, micro, small and medium enterprises (MSMEs) have made significant contributions over the years measured in terms of their shares especially in: (a) number of enterprises; (b) employment generation; (c) production and value added; (d) aggregate output or gross domestic prod-uct (GDP); (e) number of enterprises set up by women entrepreneurs; and (f) regional dis-persal of industry. According to Narain (2003), the contributions of these enterprises are vital as they: (a) make up between 80 and 90 per cent of all enterprises; (b) provide over 60 per cent of the private sector jobs; (c) gen-erate between 50 and 80 per cent of total employment; (d) contribute about 50 per cent of sales or value added; (e) share about 30 per cent of direct total exports. In large coun-tries like India, China and Indonesia, the growth of MSMEs is also considered very important due to their potential contributions to employment creation, improvement of in-come distribution, poverty reduction, export growth of manufactures, and development of manufacturing industry, rural economy, and entrepreneurship, especially among young educated individuals and women.
In Indonesia, the importance of these enterprises is especially because of their
char-acteristics, which include the followings. First,
their number is huge, and especially micro enterprises (MIEs) and small enterprises (SEs) are scattered widely throughout rural areas and therefore they may have a special ‘local’ significance for the rural economy; while medium enterprises (MEs) are concentrated
in urban areas. Second, as being populated
largely by firms that have considerable po-tential for employment growth, the
develop-ate employment and to generdevelop-ate income and
so to reduce poverty. Third, MSMEs use
tech-nologies that are in a general sense more ‘appropriate’ as compared to modern tech-nologies used by large enterprises (LEs) to factor proportions and local conditions in Indonesia; that is, many raw materials are lo-cally available but capital, including human capital is very limited, especially in rural
ar-eas. Fourth, not only that the majority of
MSMEs in Indonesia are located in rural ar-eas, they are also mainly agriculturaly based and oriented activities. Therefore the Indo-nesian government efforts to support these enterprises are also an indirect way to sup-port development in agriculture in the
coun-try. Fifth, they finance their operations
over-whelmingly by personal savings of the own-ers, supplemented by gifts or loans from rela-tives or from local informal moneylenders, traders, input suppliers, and payments in ad-vance from consumers. Based on this fact, there is another important role that to enter-prises can play, namely, as a means to allo-cate rural savings that otherwise would be
used for unproductive purposes. Sixth,
al-though in general people in rural areas are poor or from the low-income group, many poor villagers are able to save and invest a small amount of capital either from their sala-ries as local civil servants or teachers or from their revenues as farmers; and they are will-ing to take risks in dowill-ing so. In this respect, MSMEs provide a good starting point for the mobilization of both villagers’ talents as en-trepreneurs and their capital; while, at the same time, rural MSMEs can function as an important sector providing an avenue for test-ing and developtest-ing rural entrepreneurial abil-ity.
lems in Indonesia. Methodologically, as a de-scriptive analysis, this study is based on sec-ondary data analysis and a review of key lit-erature.
Characteristics of MSMEs
In Indonesia, MSMEs are not a homog-enous group, but different among subcatego-ries. MEs and MIEs can be distinguished ob-viously from MEs by reference to their
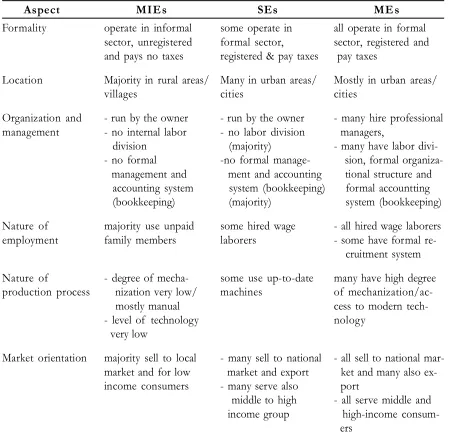
dif-ferent characteristics in many aspects, such as formality or ways in doing business, mar-ket orientation, social-economic profiles of the owners/producers, nature of workers employed, adopted organization and manage-ment system, degree of mechanization (na-ture of production process), sources of main raw materials and capital, location, external relationships, and degree of women’s involve-ment as entrepreneurs (Table 1).
Table 1. Main Characteristics of MIEs, SEs, and MEs in Indonesia.
Aspect MIEs SEs MEs
Formality operate in informal some operate in all operate in formal
sector, unregistered formal sector, sector, registered and
and pays no taxes registered & pay taxes pay taxes
Location Majority in rural areas/ Many in urban areas/ Mostly in urban areas/
villages cities cities
Organization and - run by the owner - run by the owner - many hire professional
management - no internal labor - no labor division managers,
division (majority) - many have labor
divi-- no formal -no formal manage- sion, formal
management and ment and accounting tional structure and
accounting system system (bookkeeping) formal accountting
(bookkeeping) (majority) system (bookkeeping)
Nature of majority use unpaid some hired wage - all hired wage laborers
employment family members laborers - some have formal
cruitment system
Nature of - degree of mecha- some use up-to-date many have high degree
production process nization very low/ machines of
mostly manual cess to modern
tech-- level of technology nology
very low
Market orientation majority sell to local - many sell to national - all sell to national
mar-market and for low market and export ket and many also
ex-income consumers - many serve also port
middle to high - all serve middle and
income group high-income
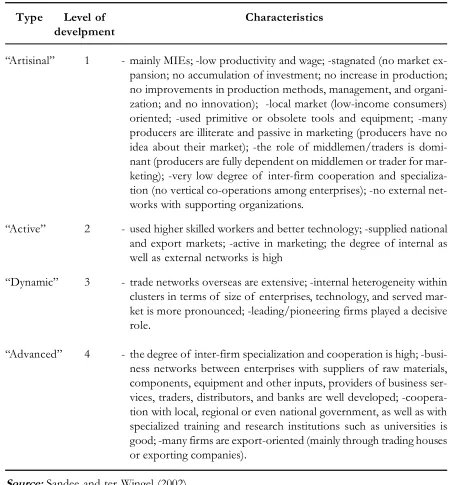
Sandee and ter Wingel (2002) examined the level of development of MSME in Indo-nesia, by focusing on MSME clusters in the manufacturing industry. From their observa-tions, they classified manufacturing MSMEs clusters in Indonesia into four types accord-ing to their level of development (includaccord-ing level of entrepreneurship), each with its own
characteristics (Table 2). The first type is called
“artisinal”. If the level of cluster develop-ment can be measured by the following scale: one (the lowest), two, three and four (the highest), then the level of cluster
develop-Altenburg and Mayer-Stamer (1999) also re-fer to such clusters as “survival” clusters of MIEs, as this type of cluster displays many characteristics of MIEs with level of produc-tivity and wages being much lower than that of SEs and MEs. In these clusters the degree of inter-firm cooperation and specialization is very low, reflecting the lack of specialists in the local labor force as well as a fragile social fabric.
The second type is called “active” clusters, which are developed rapidly in terms of skill improvement, technological upgrading and
Continued from Table 1
Aspect MIEs SEs MEs
Social and - low or uneducated - some have good edu- - majority have good
economic profiles - from poor house- cation, and from education
of owners holds non-poor households - many are from wealthy
- main motivation: - many have business/ families
survival profit motivation - main motivation: profit
Sources of inputs majority use local - some import raw - many use imported raw
raw materials and materials materials
use own money -some have access to - majority have access
bank and other formal to formal credit
credit institutions sources
External networks majority have no many have good - majority have good
ac-access to government relations with govern- cess to government
programs and no ment and have programs
business linkages business linkages - many have business
with LEs (such as subcontract- linkages with LEs
ing) with LEs (including MNCs/FDI)
(including MNCs/FDI)
Women ratio of female to male ratio of female to male ratio of female to male
entrepreneurs as entrepreneurs is high as entrepreneurs is high as entrepreneurs is low
ity-related problems and their markets are mainly local or domestic. Typical examples of these clusters are such as roof tiles ters, metal-casting clusters, shuttle-cock ters, shoe clusters and brass-handicraft
clus-ters. In these clusters, some enterprises start to influence the development trajectory of the clusters, and some enterprises produce for export through middlemen or traders or trad-ing houses from outside the clusters.
Table 2. Different Types of MSME Clusters in Indonesia
Type Level of Characteristics
develpment
“Artisinal” 1 - mainly MIEs; -low productivity and wage; -stagnated (no market
ex-pansion; no accumulation of investment; no increase in production; no improvements in production methods, management, and organi-zation; and no innovation); -local market (low-income consumers) oriented; -used primitive or obsolete tools and equipment; -many producers are illiterate and passive in marketing (producers have no idea about their market); -the role of middlemen/traders is domi-nant (producers are fully dependent on middlemen or trader for mar-keting); -very low degree of inter-firm cooperation and specializa-tion (no vertical co-operaspecializa-tions among enterprises); -no external net-works with supporting organizations.
“Active” 2 - used higher skilled workers and better technology; -supplied national
and export markets; -active in marketing; the degree of internal as well as external networks is high
“Dynamic” 3 - trade networks overseas are extensive; -internal heterogeneity within
clusters in terms of size of enterprises, technology, and served mar-ket is more pronounced; -leading/pioneering firms played a decisive role.
“Advanced” 4 - the degree of inter-firm specialization and cooperation is high;
-busi-ness networks between enterprises with suppliers of raw materials, components, equipment and other inputs, providers of business ser-vices, traders, distributors, and banks are well developed; -coopera-tion with local, regional or even na-coopera-tional government, as well as with specialized training and research institutions such as universities is good; -many firms are export-oriented (mainly through trading houses or exporting companies).
The third type is called “dynamic” clus-ters as they are characetrized by, among oth-ers, expanding exports. Examples of the third type are textile weaving clusters in Majalaya and Pekalongan, furniture cluster in Jepara, wig and hair accessories cluster in Purbalingga, and handicraft cluster in Kasongan. Many producers in these clusters have developed extensive trade networks not only domestic, but also overseas. Internal heterogeneity within clusters in terms of size, technology, and served market is more pro-nounced. Inter-firm specialization and coop-eration among firms inside clusters are well developed. One of the most striking features of this type (and also to a certain extent in the “active” clusters) may be the decisive role of leading/pioneering firms, usually larger and faster growing firms, to manage a large and differentiated set of relationships with firms and institutions within and outside clus-ters. Some leading firms have utilized cutting-edge technologies in production (Supratikno, 2002a,b).
The fourth type is called the ‘advanced’ clusters, and in this type of clusters all enter-prises are mostly MEs. The key characteris-tics of these clusters are that many of the enterprises are export-oriented and they have strong inter-firm specialization (see further Table 2).
Performance of MSMEs
Number of Enterprises and Total Employment
Historically, Indonesian MSMEs have always been the main players in domestic economic activities, accounting for more than
Table 3.Total Enterprises by Size Category in All Sectors in Indonesia (in thousand units)
Size 2000 2001 2003 2004 2005
Category
MIEs & SEs 39,705 39,883.1 43,372.9 44,684.4 47,006.9
MEs 78.8 80.97 87.4 93.04 95.9
LEs 5.7 5.9 6.5 6.7 6.8
Total 39,789.7 39,969.9 43,466.8 44,784.1 47,109.6
Size 2006 2007 2008 2009
Category
MIEs & SEs 48,822.9 47,720.3 52,327.9 52,723.5
MEs 106.7 120.3 39.7 41.1
LEs 7.2 4.5 4.4 4.7
Total 48,936.8 49,845.0 52,262.0 52,769.3
Source: State Ministry for Cooperative and SMEs (www.depkop.go.id) and Indonesian Central Bureau of Statistics (BPS) (www.bps.go.id)
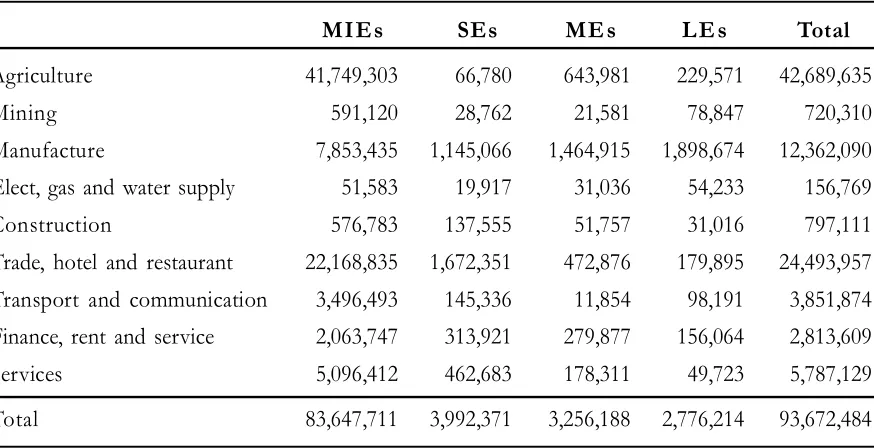
Table 4. Total Employment by Size Category and Sector in Indonesia, 2008 (Workers)*
MIEs SEs MEs LEs Total
Agriculture 41,749,303 66,780 643,981 229,571 42,689,635
Mining 591,120 28,762 21,581 78,847 720,310
Manufacture 7,853,435 1,145,066 1,464,915 1,898,674 12,362,090
Elect, gas and water supply 51,583 19,917 31,036 54,233 156,769
Construction 576,783 137,555 51,757 31,016 797,111
Trade, hotel and restaurant 22,168,835 1,672,351 472,876 179,895 24,493,957
Transport and communication 3,496,493 145,336 11,854 98,191 3,851,874
Finance, rent and service 2,063,747 313,921 279,877 156,064 2,813,609
Services 5,096,412 462,683 178,311 49,723 5,787,129
Total 83,647,711 3,992,371 3,256,188 2,776,214 93,672,484
Note: * data at sectoral level are not yet available for 2009.
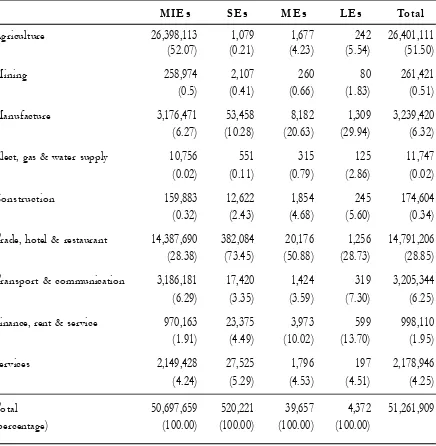
Table 5. Structure of Enterprises by Size and Sector in Indonesia, 2008 (units)*
MIEs SEs MEs LEs Total
Agriculture 26,398,113 1,079 1,677 242 26,401,111
(52.07) (0.21) (4.23) (5.54) (51.50)
Mining 258,974 2,107 260 80 261,421
(0.5) (0.41) (0.66) (1.83) (0.51)
Manufacture 3,176,471 53,458 8,182 1,309 3,239,420
(6.27) (10.28) (20.63) (29.94) (6.32)
Elect, gas & water supply 10,756 551 315 125 11,747
(0.02) (0.11) (0.79) (2.86) (0.02)
Construction 159,883 12,622 1,854 245 174,604
(0.32) (2.43) (4.68) (5.60) (0.34)
Trade, hotel & restaurant 14,387,690 382,084 20,176 1,256 14,791,206
(28.38) (73.45) (50.88) (28.73) (28.85)
Transport & communication 3,186,181 17,420 1,424 319 3,205,344
(6.29) (3.35) (3.59) (7.30) (6.25)
Finance, rent & service 970,163 23,375 3,973 599 998,110
(1.91) (4.49) (10.02) (13.70) (1.95)
Services 2,149,428 27,525 1,796 197 2,178,946
(4.24) (5.29) (4.53) (4.51) (4.25)
Total 50,697,659 520,221 39,657 4,372 51,261,909
(percentage) (100.00) (100.00) (100.00) (100.00)
Note: * data at sectoral level are not yet available for 2009.
GDP Contribution
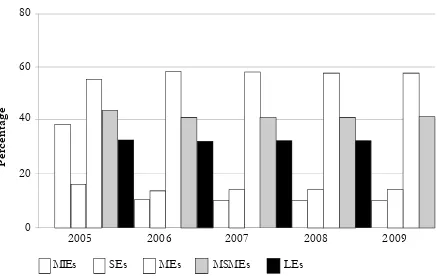
With respect to their contributions to the formation of gross domestic product (GDP), as shown in Figure 1, the GDP share of MSMEs as a group has always been higher that that of LEs at around 58 percent (at constant prices) since 2006. However, it var-ies by sub-category: MIEs have always higher GDP share than those of SEs and MEs. How-ever, it is not because the first sub-category of enterprises has higher productivity. It is mainly because the number of units of this sub-category is much larger than that of SEs and MEs.
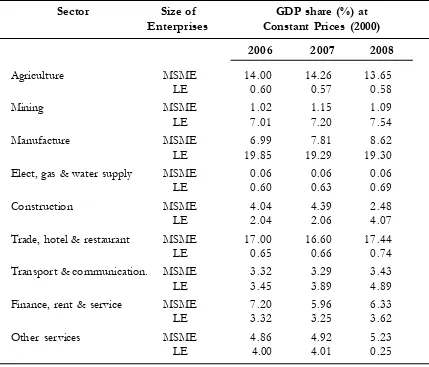
Next, Table 6 presents data on GDP contributions of MSMEs and, as a compari-son, LEs by sector. As can be seen, there are
two interesting facts from this table. First, the
GDP share of MSMEs varies by sector. Only in their key sectors, i.e. agriculture and trade
their GDP shares are relatively high. Second,
in sectors where huge capital, advanced tech-nologies and high skilled workers are crucial such as mining, manufacturing, construction, and electricity, gas and clean water supply, the GDP shares of MSMEs are always much lower than that of LEs.
Source: State Ministry for Cooperative and SMEs (www.depkop.go.id) and BPS (www.bps.go.id)
Figure 1. GDP Shares of MSMEs and LEs in Indonesia (%)
Pe
rc
en
ta
ge
0 20 40 60 80
2005 2006 2007 2008 2009
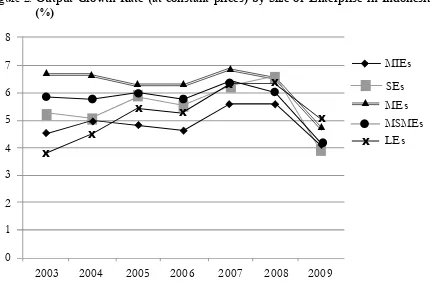
Although in different sectors or subsectors the MSMEs may have different growth rates of output, in total, their annual growth rates of output are always higher than that of LEs. Within the enterprises, however, the output growth rate of SEs and MIEs to-gether is always lower than that of MEs, al-though the gap tends to become smaller by year during the period reviewed (Figure 2). Among many other possible explanations, the
more modern and well organized units of pro-duction. They also use advanced technolo-gies and employ high skilled workers. Whereas, MIEs and SEs are generally unor-ganized economic activities and they use mostly unappropriate technologies, adopt promitive ways of doing production/busi-nesses, and employ unskilled workers, includ-ing unpaid family members (especially in MIEs). So, within the MSMEs, MEs have
Table 6: National GDP by Size of Enterprise and Sector in Indonesia (Rp trillion)*
Sector Size of GDP share (%) at
Enterprises Constant Prices (2000)
2006 2007 2008
Agriculture MSME 14.00 14.26 13.65
LE 0.60 0.57 0.58
Mining MSME 1.02 1.15 1.09
LE 7.01 7.20 7.54
Manufacture MSME 6.99 7.81 8.62
LE 19.85 19.29 19.30
Elect, gas & water supply MSME 0.06 0.06 0.06
LE 0.60 0.63 0.69
Construction MSME 4.04 4.39 2.48
LE 2.04 2.06 4.07
Trade, hotel & restaurant MSME 17.00 16.60 17.44
LE 0.65 0.66 0.74
Transport & communication. MSME 3.32 3.29 3.43
LE 3.45 3.89 4.89
Finance, rent & service MSME 7.20 5.96 6.33
LE 3.32 3.25 3.62
Other services MSME 4.86 4.92 5.23
LE 4.00 4.01 0.25
Note: * data at sectoral level are not yet available.
SEs MIEs
MEs
MSMEs LEs
X
0 1 2 3 4 5 6 7 8
2003 2004 2005 2006 2007 2008 2009
X
X
X X
X X
X
Figure 2. Output Growth Rate (at constant prices) by Size of Enterprise in Indonesia
(%)
Source: State Ministry for Cooperative and SMEs (www.depkop.go.id) and BPS (www.bps.go.id)
0 0.5 1 1.5 2 2.5 3
2005 2006 2007 2008 2009
SE & ME ME LE
Figure 3. GDP Growth Contributions by Size of Enterprisem in Indonesia (%)
MSMEs’ contribution to the annual GDP growth is also higher than that of LEs (Figure 3). In 2005, the national GDP growth rate was 5.69 per cent, with 3.33 per cent originated from MSMEs, compared to 2.36 per cent from LEs. In 2007, the MSMEs’ share in the GDP growth was 3.57 per cent, and slighly declined to 3.54 percent in 2008. Within the MSMEs, the total contributions of MIEs and SEs to the GDP growth were higher than that of MEs. In 2007, from the GDP growth rate at 6.32 per cent, the total contribution from MIEs and SEs was about 2.42 per cent, compared to 1.15 per cent from MEs. In 2008 the shares were 2.58 per cent and 0.96 per cent, respectively. Whereas, in 2009, the value of GDP growth was 90,354.3 billions rupiah, of which almost 39 per cent originated from MIEs and SEs, 15,4 percent from MEs and about 46 percent contributed by LEs. In percentage, the GDP growth was 4.52 percent and the contributions of MIEs and SEs as a group, MEs and LEs were, re-spectively, 1.76 percent, 0,69 percent, and 2,07 percent. The difference is mainly due to
the fact that the total units of MIEs and SEs are very huge as compared to that of MEs which were only slighly more than 39 thou-sand units.
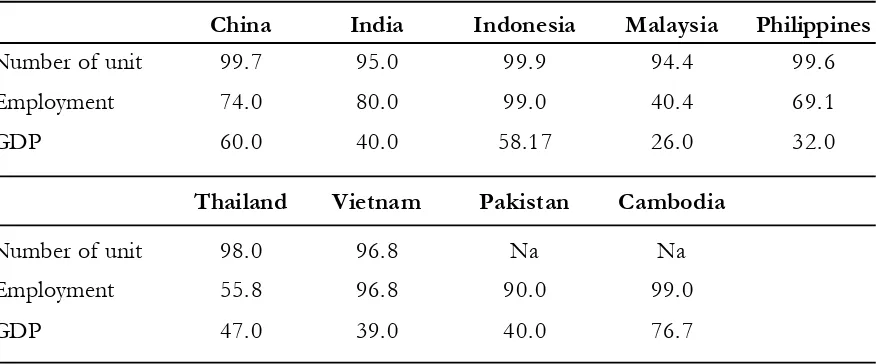
As a comparison, Table 7 provides data on MSMEs in some other Asian countries. Although official data on MSMEs in these countries are limited, some studies (e.g. Goh, 2007, ADB, 2009, Tambunan, 2009b, and UN-ESCAP, 2009), on which the table is based, managed to make estimates of actual contributions of the enterprises in the par-ticular countries’ economy. As can be seen, in all countries studied where estimates are available, MSMEs reveal as the majority in number of units, employment creation and value added generation. With respect to GDP contribution, MSMEs in Cambodia have the highest share, followed by those in China and Indonesia. In regard to employment creation, Cambodia and Indonesia are both in top po-sition as their MSMEs contribute almost 100 per cent of total employment creation.
Table 7.MSMEs’ Contributions to Total Enterprises, Employment and GDP in Selected
Asian Developing Countries, 2000-2008 (%)
China India Indonesia Malaysia Philippines
Number of unit 99.7 95.0 99.9 94.4 99.6
Employment 74.0 80.0 99.0 40.4 69.1
GDP 60.0 40.0 58.17 26.0 32.0
Thailand Vietnam Pakistan Cambodia
Number of unit 98.0 96.8 Na Na
Employment 55.8 96.8 90.0 99.0
Productivity
As already shown before, the GDP share of MSMEs or their contribution to the GDP growth is higher than that of LEs. How-ever, it does not means automtically that the level of productivity in MSMEs is higher than that in LEs. On the contrary, as one key char-acteristic of MSMEs in Indonesia, as in de-veloping countries in general, the level of productivity in these enterprises is generaly low. As the level of productivity goes along with the level of efficiency in using inputs or factors of production, low productivity means also high production costs and thus high price per unit of output, which means that the enterprises do not have price com-petitiveness in comparison with LEs. In fact that most products offered by MSMEs have lower prices than those produced by LEs and imports is mainly because their quality is in-ferior to that of LEs and imports.
As a simple approach, the ratio of total output value or total value added to total workers employed can be used to measure the labour productivity in MSMEs. Based on official data, as can be seen in Figure 4, the value added-labour ratio in these enterprises is much lower than that in their larger coun-terparts. Within the MSME group, the ratio varies, however, with lower in MIEs and SEs than in MEs.
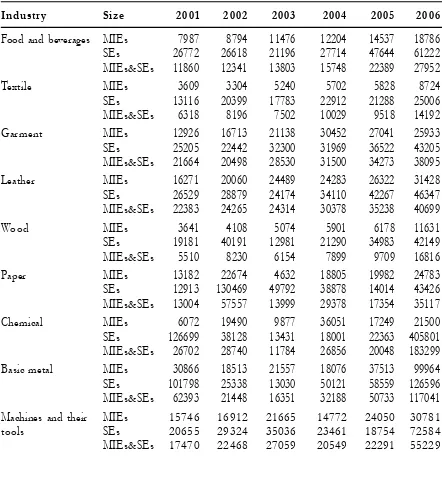
Next, Table 8 presents labor productiv-ity in MIEs and SEs in the manufacturing industry by selected important subsectors/ industries based on the ratio of total output value or value added to total workers. As can be seen, the level varies by subsector. The differences are influenced by a number of factors which can be grouped into two cat-egories, namely: demand-side factors: e.g. market size which determined by per capita real income and population, and competition
Figure 4. Labor Productivity of Enterprises by Size in Indonesia (Rp/Worker)
from LEs or imports, and supply-side factors, e.g. technology, skills, and other production resources. Different industries have differ-ences with those factors. For instance, food processing industries in Indonesia have the largest market size compared to, for instance,
assembling automotive industries. Thus, en-terprises in the first group of industry may face different challenges, opportunities as well as constraints than their counterparts in the second one, and this may influence their pro-ductivity.
Table 8. Labor Productivity in MIEs and SEs in the Manufacturing Industry by Selected
Industries in Indonesia (Rp 000)
Industry Size 2001 2002 2003 2004 2005 2006
Food and beverages MIEs 7987 8794 11476 12204 14537 18786
SEs 26772 26618 21196 27714 47644 61222
MIEs&SEs 11860 12341 13803 15748 22389 27952
Textile MIEs 3609 3304 5240 5702 5828 8724
SEs 13116 20399 17783 22912 21288 25006
MIEs&SEs 6318 8196 7502 10029 9518 14192
Garment MIEs 12926 16713 21138 30452 27041 25933
SEs 25205 22442 32300 31969 36522 43205
MIEs&SEs 21664 20498 28530 31500 34273 38095
Leather MIEs 16271 20060 24489 24283 26322 31428
SEs 26529 28879 24174 34110 42267 46347
MIEs&SEs 22383 24265 24314 30378 35238 40699
Wood MIEs 3641 4108 5074 5901 6178 11631
SEs 19181 40191 12981 21290 34983 42149
MIEs&SEs 5510 8230 6154 7899 9709 16816
Paper MIEs 13182 22674 4632 18805 19982 24783
SEs 12913 130469 49792 38878 14014 43426
MIEs&SEs 13004 57557 13999 29378 17354 35117
Chemical MIEs 6072 19490 9877 36051 17249 21500
SEs 126699 38128 13431 18001 22363 405801
MIEs&SEs 26702 28740 11784 26856 20048 183299
Basic metal MIEs 30866 18513 21557 18076 37513 99964
SEs 101798 25338 13030 50121 58559 126596
MIEs&SEs 62393 21448 16351 32188 50733 117041
Machines and their MIEs 15746 16912 21665 14772 24050 30781
tools SEs 20655 29324 35036 23461 18754 72584
Differences in productivity are not only evident between MSMEs and LEs, but also within the MSMEs themselves, the level of labour productivity in MIEs is lower than that in SEs, and that in the latter sub-category is generally also below that in MEs. This may suggest that there is a positive correlation between the level of productivity and the size of enterprises. It means that the larger the size is, the more complex is the production proces and organisation, the more skilled workers and better technologies are needed which generate higher productivity. Also, since MIEs are mainly in the informal sector and these most traditional enterprises have the lowest level of productivity within the MSMEs, it can be said that there is a correla-tion between the level of formality and the level of productivity.
Based on country data, a 2009 report from the Asian Development Bank (ADB, 2009) shows labour productivity across MIEs and SEs in selected Asian developing tries. As can be seen in Figure 5, in all coun-tries covered, MIEs have much lower labor productivity than that in SEs. There are two
interesting facts from this figure. First, the gap
in labour productivity between the two sub-categories of MSMEs varies by country, with
Thailand as largest one. Second, MIEs in
Thai-land has the highest labour productivity than those in Indonesia, the Philippines and In-dia. If the data used by this ADB report are telling the true, it can be concluded that MIEs in this country are more efficient and hence more competitive than their counter-parts in the other three countries.
Continued from Table 8
Industry Size 2001 2002 2003 2004 2005 2006
Electrical machines MIEs - - - 5216 6722 34196
and their tools SEs 213333 - - 23520 120615 84707
MIEs&SEs 213333 - - 21733 103839 72451
Radio, television, MIEs - - - 2033 - 78627
communication and SEs - - - 46080 18259 329963
their tools MIEs&SEs - - - 37236 18259 249545
Vehicles MIEs 22303 - 14533 28028 57626 57013
SEs 25035 - - 43940 53882 71899
MIEs&SEs 23898 - 14533 37491 54606 66517
Other MIEs 15079 27975 24329 24859 65384 58655
transportation SEs 37787 14985 8769 67134 108934 109451
means MIEs&SEs 24089 23752 19422 45799 81459 78455
Furniture and MIEs 16686 12075 12053 22795 28613 35331
other manufacturing SEs 18104 31596 33078 30641 37320 40843
MIEs&SEs 17087 17495 19323 26148 31790 37475
Current Constraint
Types of Constraints
MSMEs (especially MIEs and SEs) are often hampered by many, including institu-tional constraints to growth in size and to become viable/efficient larger enterprises. The constraints may differ from region to re-gion, between rural and urban areas, between sectors and subsectors, or between individual enterprises within the same sector or subsector or region. However, there is a num-ber of constraints common to all MSMEs, which include the lack of fund to finance their working and investment capitals, human re-source with high skills, advanced technolo-gies and up-date and comprehensive infor-mation; difficulties in procuring raw materi-als and other required inputs, marketing and distribution; high transportation costs; prob-lems caused by cumbersome and costly bu-reaucratic procedures, especially in getting the required licenses; and policies and regulations that generate market distortions. These are often said in the literature as external
con-straints to MSME growth. 1
Based on government data from a na-tional survey (BPS) on MIEs and SEs in the manufacturing industry, Table 9 highlights the main constraints faced by MIEs and SEs in the manufacturing industry in Indonesia.
Sur-prisingly, data in this table does not suggest that all surveyed producers consider the lack of capital as their most serious business con-straints. Those facing capital constraints are primarily MIEs that are located in the rural or backward areas where the access to bank credit or various existing government-spon-sored SME credit schemes such as the
well-known KUR (Kredit Usaha Rakyat) scheme is
either minimal or absent. Consequently, these MIEs depend fully on their savings, funding from other relatives and credit from informal lenders for financing their daily business op-erations. It can be seen in Table 10 which shows that the majority of the sampled pro-ducers use their own money to finance their businesses, with the share of 82.41 per cent and 68.85 per cent of the total sampled MIEs and SEs, respectively. Only very few produc-ers borrow money to finance their business, about approximately 2.9 per cent and almost 1.8 per cent of the total sampled MIEs and SEs, respectively. They borrow money not only from bank or other formal non-bank fi-nancial institutions, but also from informal sources. Many of them borrow money from various sources (Table 11). The reason for such diversification in sources of capital is mainly because formal credits they received are often not enough, so they also borrow
money from their relatives or friends. 2
1 See for instance, Tambunan (2009a,b) for a survey of literature on this particular issue.
Table 9. Number of SEs and MIEs in the Manufacturing Industry by Main Obstacles in Indonesia, 2005
SEs MIEs Total
Have no serious obstacles 46,485 627,650 674,135
Have serious obstacles: 192,097 1,862,468 2,054,565
-Lack or high prices of raw materials 20,362 400,915 421,277
-Marketing difficulties 77,175 552,231 629,406
-Lack of capital 71,001 643,628 714,629
-Transportation/distribution obstacles 5,027 49,918 54,945
-High price or short supply of energy 4,605 50,815 55,420
-High labor cost 2,335 14,315 16,650
-Other main constraints 11,592 150,646 162,238
Total 238,582 2,490,118 2,728,700
Source: Tambunan (2008).
Table 10. Sources of Capital of MIEs and SEs in the Manufacturing Industry in
In-donesia, 2005 (% of total sampled enterprises)
Source of Capital MIEs SEs
Own Money 82.41 68.85
Borrow 2.86 1.75
Own money and borrow 14.73 29.40
Total 100 100
Other main constraints stated in Table 9 include cumbersome and onerous business regulations and restrictions. Basically, these problems which hamper business activities in Indonesia reflect the poor governance in the country. One of the most egregious restric-tive regulations, which hampered bona fide business in Indonesia, including MSMEs, was the policy-generated barriers to domestic competition and trade. These policy-gener-ated barriers included the barriers to inter-regional and inter-island trade and prolifera-tion of several state and private monopolies which proliferated during the New Order era (1966-1998). The policy-generated barriers to domestic competition and trade included bar-riers to entry in certain economic activities, officially sanctioned cartels and monopolies, price controls, dominance of state-owned companies (SOCs) in certain sectors and pref-erential treatment for selected favored LEs.
tional Monetary Fund (IMF), Indonesia started its large economic reforms in almost all sectors and dealing with almost all aspects of daily business, including reducing the dominance of SOCs in the economy.
Another example of bad government regulations for MSMEs was the case of fur-niture producers in Central Java. In Cirebon, for instance, the export of wood and rattan furniture has been declined since 2005. One cause of that was the regulation issued in 2005 by the Ministry of Industry and the Ministry of Trade which allowed free export for unprocessed wood and rattan. This deci-sion did not only cause scarcity problem of unprocessed wood and rattan in local market for domestic furniture producers, but as such key raw materials were also exported to highly competitive countries in wood and rattan fur-niture like China and Vietnam, Indonesian furniture producers faced more difficulties in
Table 11. The Origin of Loans in Manufacturing MIEs and SEs in Indonesia, 2005
(% of total sampled enterprises)
Origin of Loan MIEs SEs
Formal Sources
Bank 54.54 15.62
Cooperative 5.57 3.83
Ventura capital 1.63 1.34
Non-bank institutions 4.75 3.06
Informal Sources
Family 12.61 11.21
Friends 23.64 44.35
Others 14.24 28.35
though rattan is only available in Indonesia. Only recently, after aware of that problem, the government has replaced the 2005 regu-lation with a new one which forbids exports of raw wood and rattan.
Although the BPS survey data shown in Table 9 seem to suggest that such enter-prises do not have problems with technology and skills. However, in reality, as one impor-tant characteristic of MIEs and SEs in Indo-nesia (as in many other developing countries), which makes them different from their coun-terparts in developed countries, they employ mostly low-skilled workers and use tradi-tional/old (many often own made/modified) technologies; although the degree of skills and technology used varies by sector or groups of industry, depending on basic skills or tech-nologies required. Even in the literature, it is often stated that lack of skills or technology
is among serious constraints facing MSMEs,
in developing countries. 3
With respect to skill, Table 12 presents the level of formal education of the own-ers/producers of MSMEs in the manufactur-ing industry. As can be seen, of the total sampled MSMEs in the sector, only about 2.20 per cent have university degree; although the rate varies between MIEs, SEs and MEs. This picture is in line with the fact that on average the education level of the working population in Indonesia is also low. Data from the National Labour Survey show that until now inspite of the annual increase in the pro-portion of population with university or higher education degree, the majority of working population in the country are still from those with primary up to secondary schools only.
Table 12. Level of Education of the Owners of/Entrepreneurs in MSMEs in the
Manu-facturing Industry in Indonesia, 2006 (%)
Scale
Level of Education MIE & SE ME MSME
Not completed primary education 12.20 7.97 16.09
Completed primary education 28.87 21.29 31.30
Completed first level secondary education 23.04 19.58 22.10
Completed second level secondary education 30.42 37.54 26.87
Completed Academic level education (D I/II/III) 1.96 3.53 1.44
University diploma 3.51 10.09 2.20
Total 100.00 100.00 100.00
Source: BPS (www.bps.go.id)
Regional Comparison
As a regional comparison, based on re-cent, though limited, information from e.g. government reports, national surveys and case studies, Tambunan (2008) managed to make a list of main constraints common to MSMEs in other Asian developing countries (with “ sign), although the degree of the importance of each of the constraints varies by country, depending on differences in many aspects such as the level of MSMEs development; the nature and the degree of economic de-velopment; public policies and facilities; and of course the nature and the intensity of gov-ernment interventions towards MSMEs. As presented in Table 13, the constraints include various problems in the procurement of raw materials and other required inputs such as price instability, unsustained supply (stocks are often not available), and inferior quality; difficulties in markting such as high costs of
41
Conclusion
This study shows two interesting facts about MSMEs in Indonesia. One is related to the performance of the enterprises, and the second one is about their current main constraints. With respect to the performance, MSMEs are of overwhelming importance in Indonesia, as they accounted for more than 90 percent of all existing firms, and they con-tinue to grow every year. This may be a posi-tive sign of ongoing entrepreneurship devel-opment in the country. However, MSMEs are dominated by MIEs, which are undertaken mainly by poor and less educated households or individuals as their primary income source. Thus the growth of especially MIEs in Indo-nesia is more likely a reflection of poverty distress, as poor people are “pushed” to un-dertake such activities, rather than an indi-cator of entrepreneurship development. It also shows that MSMEs have larger GDP contribution than that of LEs. However, this is not because MSMEs have higher produc-tivity than that of LEs. On the contrary, la-bor productivity in MSMEs is much lower as
compared to LEs. Thus, the larger GDP share of MSMEs in Indonesia is mainly because the number of these enterprises is very huge.
With respect to the second fact, the main constraints faced by most of the enter-prises are SEs, are financial limitation and marketing difficulties. Financial limitation, which due mainly to limited access to formal sources of credit, acts as their main constraint to improve their performance. This financial problem may also attribute to their market-ing difficulties as most SEs and MIEs do not have the resources to explore their own mar-kets. In addition, the study also shows that most owners of the enterprises have low for-mal education which may keep their technol-ogy or innovation ability low.
Lack of innovation capability caused by lack of education should be considered very serious (even more serious than other con-straints), that slowly but sure can wipe out Indonesian MSMEs from both domestic and export markets in the long-run with the in-creasing pressures of other competitors.
References
Altenburg, T., and J. Meyer-Stamer. 1999. How to promote clusters: Policy experiences from Latin America.
World Development 27 (9): 1693-713.
ADB. 2009. Key Indicators for Asia and the Pacific 2009. Manila: Asian Development Bank.
Goh, M. 2007. High-growth, Innovative Asian SMEs for International Trade and Competiitveness: Challenges and
Solutions for APO Member Countries. Tokyo: Asian Productivity Organization.
Narain, S. 2003. Institutional capacity-building for small and medium-sized enterprise promotion and development. In UN-ESCAP, Investment Promotion and Enterprise Development Bulletin for Asia and the
Pacific 2. New York: United Nations.
Supratikno, H. 2002a. The development of SME clusters in Indonesia. Paper presented at the ASEAN Roundtable on “Entrepreneurship and Small and Medium-Sized Enterprises (SMEs) in Southeast Asia’s
Eco-nomic Development” (November 7-8). Singapore: ISEAS.
Supratikno, H. 2002b. The strategies of cluster upgrading in Central Java. A Preliminary Report to Depperindag. Salatiga.
Tambunan, T. T. H. 2006. Development of Small and Medium Enterprises in Indonesia from the Asia-Pacific Perspec-tive. Jakarta: LPFE-Usakti.
Tambunan, T. T. H. 2008. Development of rural manufacturing SME clusters in a developing country: The Indonesian case. Journal of Rural Development 31 (2):123-46.
Tambunan, T. T. H. 2009a. SME in Asian Developing Countries. London: Palgrave Macmillan Publisher. Tambunan, T. T. H. 2009b. Development of SMEs in ASEAN Countries. New Delhi: Readworthy
Publica-tions, Ltd.
ABOUT THE AUTHORS
TAMBUNAN, Tulus is professor in the faculty of economics, Trisakti University. Currently he is also the director of the Center for Industry, SME and Business Competition Studies in the same university. Development of small and medium enterprises (SMEs) and its related issues, especially in developing countries, is among his areas
of specialization. He has written a number of books about SMEs, including Trade
Liberalization and SMEs in ASEAN (New York: Nova Science Publishers, Inc.,
2010) and SME in Asian Developing Countries (London: Palgrave Macmillan
Pub-lisher, 2009).