Summary Multiple TREGRO simulations were conducted with meteorological data files containing different growing season peak ozone (O3) episodes at O3 exposures of 1.0 and 2.0 × ambient O3 to assess the relationship between O3 re-sponse and the phenology of mature yellow poplar ( Lirioden-dron tulipifera L.) and loblolly pine (Pinus taeda L.) trees. Regardless of O3 exposure and peak O3 episode occurrence, a peak O3 episode in August caused the greatest reduction in carbon (C) gain in yellow poplar, whereas a peak O3 episode in July caused the greatest reduction in C gain of loblolly pine. In both species, timing of the greatest simulated O3 effect corresponded with the completion of the annual foliage pro-duction phenophase.
Simulated C gain of yellow poplar (total tree, coarse root, and total nonstructural carbohydrate) was reduced by O3 to a greater extent than the corresponding compartments in loblolly pine, but the opposite was true for fine roots. This differential sensitivity to O3 reflects the fact that both C assimilation and the O3 response of the species were parameterized according to observed field measurements of each species. The differen-tial sensitivity to O3 of these species may have long-term implications for species composition in southeastern USA forests.
Keywords: air pollutants, Liriodendron tulipifera, phenology, Pinus taeda, total nonstructural carbohydrates.
Introduction
Industrial activity resulting in the release of ozone (O3) precur-sors over the past century has increased the background O3 concentrations from 20--40 to 40--60 ppb, a trend that is expected to continue into the next millennium (National Acad-emy of Science 1992). Although O3 production is centered in industrial areas, prevailing wind can transport O3 to remote agricultural and forest ecosystems. Currently, O3 is estimated to cause in excess of 3 billion dollars per year in agricultural crop losses (Heck et al. 1991), but the long-term effects of O3
on forest species and ecosystems are less clear (Taylor et al. 1994).
Patterns of tropospheric O3 concentration typically display an annual cycle in which the lowest O3 concentrations occur during winter and the highest concentrations occur during summer. In the southeastern United States, summer climatic conditions of elevated temperatures, stagnant air masses, and high concentrations of NOx and volatile organic carbon com-pounds originating from natural and anthropogenic sources (Fehsenfeld et al. 1994) can elevate tropospheric O3 concentra-tions fourfold over those occurring during the winter. In addi-tion to environmental condiaddi-tions that favor the producaddi-tion of tropospheric O3, there are also intra- and inter-seasonal vari-ations caused by varivari-ations in the concentrvari-ations of O3 precur-sors and their proximity to the measuring station (Fehsenfeld et al. 1994). A consequence of the variability in O3 formation is the difficulty in examining the relationship between growing season O3 exposure (especially periods of peak O3 episodes) and its effect on growth of forest tree species.
Total pollutant exposure is frequently described as the prod-uct of pollutant concentration and duration of exposure. How-ever, because the primary avenue for O3 entry into the plant is through the stomata (Rubin et al. 1996), O3 injury is probably related to the product of stomatal conductance, leaf area, and O3 exposure concentration. Therefore, the phenology of leaf area, conductance, and O3 play a major role in determining injury. Experimental studies with Phaseolusvulgaris L. have shown that O3 exposure profiles containing peak events result in greater injury than exposures with uniform profiles (Mussel-man et al. 1983, 1994), indicating that experimental exposures lacking peak episodes may underestimate the effects of O3 on plant growth. Although the importance of peak events has been documented (Musselman et al. 1983, 1994), the interaction between peak events and phenology is unclear.
Two important forest tree species in the southeastern USA are yellow poplar (Liriodendron tulipifera L.) and loblolly pine (Pinus taeda L.). Both species are sensitive to O3 in experimental studies (Chappelka et al. 1985, Chappelka et al.
Simulating the response of mature yellow poplar and loblolly pine
trees to shifts in peak ozone periods during the growing season using
the TREGRO model
JOHN V. H. CONSTABLE
1,2and WILLIAM A. RETZLAFF
3,4 1Department of Environmental and Resource Science, University of Nevada, Fleischmann Agriculture, Room 128, Reno, NV 89557-0013, USA
2 Current address: Department of EPO Biology, University of Colorado, Boulder, CO 80309-0334, USA 3
Boyce Thompson Institute for Plant Research, Tower Road, Ithaca, NY 14853-1801, USA
4
Author to whom correspondence should be addressed
Received August 12, 1996
1988, Sasek et al. 1991, Tjoelker and Luxmoore 1992, Cannon et al. 1993, Dizengremel et al. 1994, McLaughlin et al. 1994, Taylor 1994). Yellow poplar is a broadly distributed hardwood species with indeterminate leaf growth, whereas loblolly pine is a widely planted coniferous species that exhibits determinate foliar growth and is found together with yellow poplar on moist well-drained sites (Baker and Langdon 1990). Both species grow rapidly, are found in early successional environ-ments, and may compete directly for available resources.
Because the interaction between tree phenology, growth habit, and episodic peak O3 events is unclear, we examined how yellow poplar and loblolly pine would respond to vari-ations in the occurrence of growing season peak O3 episodes. We hypothesized that the contrasting phenology and growth habits of these species differentially affects their sensitivity to variations in the timing of a peak O3 episode during the grow-ing season. Because studies of this nature on mature trees in the field are difficult and expensive to conduct, we used the simulation model TREGRO (Weinstein et al. 1991) to assess: (1) whether there is a critical exposure period during the growing season that will result in increased O3 response, and (2) what role phenology plays in the O3 response of these species.
Materials and methods
TREGRO description
TREGRO is a physiological simulation model of the carbon (C), water, and nutrient fluxes of an individual tree that was developed to analyze the responses of trees to multiple envi-ronmental stresses. In the model, the tree is divided into com-partments: a canopy of leaves grouped by age class, branches, stem, and coarse and fine roots in three soil horizons. In each compartment, the model keeps track of three C pools: structure (living, respiring tissue); wood (the non-respiring tissue); and total nonstructural carbohydrate (TNC). The model uses the Farquhar equations (Farquhar et al. 1980) to calculate C as-similation of the entire tree each hour as a function of ambient environmental conditions and the availability of light in the canopy, water, and nutrients. Carbon is redistributed daily within the plant for respiration, growth, storage, and replace-ment of senescent tissues. Priority for the C varies inversely with the distance between source and sink and varies directly with relative sink strength.
In TREGRO, the interaction between tree growth and the environment is achieved through the linkage of separate data files. The parameter file defines species-specific charac-teristics including (but not limited to): maximum photosyn-thetic rate, rates of maintenance and growth respiration, specifics of nutrient uptake kinetics, phenological patterns of growth, growth rates of individual tree compartments, photo-synthetic response to O3, initial patterns of C allocation among compartments, and C partitioning within compart-ments among living structure, dead wood, and C reserves (TNC). The meteorological file defines the site-specific hourly environmental conditions including air temperature (°C), rela-tive humidity (%), rainfall (mm), photosynthetic photon flux
density (µmol m−2 s−1), and O3 concentration (ppb). In the present study, all TREGRO simulations were 3 years in length and used a meteorological data file collected on-site at Oak Ridge, TN, in 1989; for each subsequent year of simulation, the 1989 conditions were repeated.
TREGRO parameterization
The biomass and C allocation of the initial yellow poplar and loblolly pine trees were set in the TREGRO model. The simu-lation target was to grow a yellow poplar tree and a loblolly pine tree with three annual biomass increments. For the yellow poplar target tree, we set the annual diameter at breast height (dbh) increment at 0.30 cm year−1 and the height increment at 23 cm year−1 (Beck 1990). For the loblolly pine target tree, we set the annual dbh increment at 0.61 cm year−1 (Clark 1992). Biomass gain of all other tree compartments was estimated from the stem biomass (yellow poplar) or dbh increment (lob-lolly pine) assuming that no change occurred in the allometric relationships during the simulation period (Tables 1 and 2) (Clark and Schroeder 1977, Van Lear et al. 1986, Vogt 1991).
Initial tree biomass
The initial yellow poplar tree was estimated to be approxi-mately 30 m tall, 41 cm in dbh, and 50 years old (Clark and Schroeder 1977, Beck 1990), with a mean crown radius of approximately 4.2 m (Trimble and Tryon 1966). Total tree biomass in midsummer was allocated at 1.91% foliage, 17.84% branch, 62.14% stem, 13.57% coarse root, and 4.53% fine root (Clark and Schroeder 1977, Vogt 1991). Leaf area was calculated from specific leaf area (Kolb and Steiner 1990) and foliar biomass. Tree biomass in each component was further partitioned into TNC, structure, and wood (in woody tissue). The proportion of wood in the initial tree’s stem, branches, and coarse (woody) roots (36.6%) was set to that reported for the stem by Panshin and de Zeeuw (1980). The remainder of the initial biomass was divided between TNC and structure. The TNC represented 30% of structure in the stem, branch, and coarse roots and 20% of structure in the foliage based on reported starch concentrations in roots (Jensen and Patton 1990) and TNC concentrations in foliage (Wullschleger et al. 1992) of yellow poplar trees.
parti-Table 1. Initial and final biomass and 3-year C gain values from literature allometric data and the resulting TREGRO model 3-year C gain and the percent estimate for a simulated 50--53-year-old yellow poplar tree.
Component Values from allometric equations (g C) Model % Estimate
C Gain (g C) Initial biomass Final biomass 3-Year C gain
Stem 395254 421759 26505 26911 1.5
Branch 113475 121084 7609 7637 0.4
Foliage 12149 12964 815 890 9.2
Root total 115128 122848 7720 7817 1.3
Coarse root total 86314 92102 5788 5873 1.5
Coarse root A 43157 46051 2894 2968 2.6
Coarse root B1 43157 46051 2894 2905 0.4
Fine root total 28814 30746 1932 1944 0.6
Fine root A 14407 15373 966 972 0.6
Fine root B1 14407 15373 966 972 0.6
Fine root B2 0 0 0 0 0
Total tree 636006 678655 42649 43255 1.4
Total aboveground 520878 555807 34929 35438 1.5
3-Year C gain = final biomass -- initial biomass.
% Estimate = ((model C gain -- 3-year allometric C gain)/3-year allometric C gain)100. Values represent g C (mass = 2 times g C).
Root total = coarse root total + fine root total. Coarse root total = coarse root A + coarse root B1. Fine root total = fine root A + fine root B1 + fine root B2. Total tree = stem + branch + foliage + root total. Total aboveground = stem + branch + foliage.
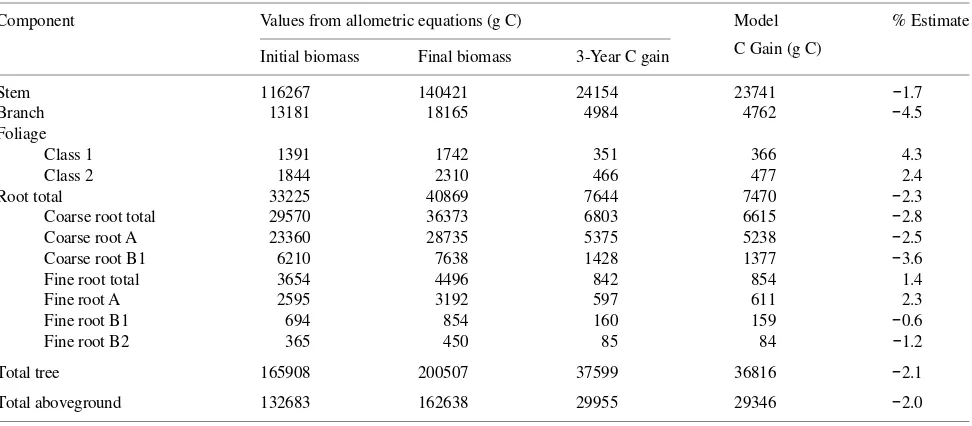
Table 2. Initial and final biomass and 3-year C gain values from literature allometric data and the resulting TREGRO model 3-year C gain and the percent estimate for a simulated 41--44-year-old loblolly pine tree.
Component Values from allometric equations (g C) Model % Estimate
C Gain (g C) Initial biomass Final biomass 3-Year C gain
Stem 116267 140421 24154 23741 −1.7
Branch 13181 18165 4984 4762 −4.5
Foliage
Class 1 1391 1742 351 366 4.3
Class 2 1844 2310 466 477 2.4
Root total 33225 40869 7644 7470 −2.3
Coarse root total 29570 36373 6803 6615 −2.8
Coarse root A 23360 28735 5375 5238 −2.5
Coarse root B1 6210 7638 1428 1377 −3.6
Fine root total 3654 4496 842 854 1.4
Fine root A 2595 3192 597 611 2.3
Fine root B1 694 854 160 159 −0.6
Fine root B2 365 450 85 84 −1.2
Total tree 165908 200507 37599 36816 −2.1
Total aboveground 132683 162638 29955 29346 −2.0
3-Year C gain = final biomass -- initial biomass.
% Estimate = ((model C Gain -- 3-year allometric C gain)/3-year allometric C gain)100. Values represent g C (mass = 2 times g C).
tioned into TNC, structure, and wood (in woody tissue). The proportion of wood in the initial tree’s stem, branches, and coarse (woody) roots (57%) was set to that reported for the stem by Blanche et al. (1985). The remainder of the initial biomass was divided between TNC and structure. The TNC represented 30% of structure in the stem, branch, and coarse roots and 20% of structure in the foliage based on reported TNC concentrations in coarse roots, stem, and foliage of lob-lolly pine trees (Friend et al. 1992).
Soil parameters
The soil rooting area of yellow poplar and loblolly pine (55.9 and 31.7 m2, respectively) was defined to be identical to the projected crown area, assuming a crown radius of 4.2 and 3.2 m (Trimble and Tryon 1966, Smith et al. 1992) and a uniform circular-shaped crown (cf. Retzlaff et al. 1996).
Depths of the A, B1, and B2 soil horizons were set to 0.2, 0.2, and 0.3 m, respectively, based on average measured soil depths in southeastern loblolly pine stands (Harris et al. 1977, Binkley et al. 1992, Richter et al. 1994) and a southeastern yellow poplar forest (Harris et al. 1977). Soil water and nutri-ent conditions were set to be nonlimiting in all of the simula-tions.
Seasonal phenology
Initial seasonal foliage growth of mature yellow poplar trees begins in mid-April and the majority (> 80%) of foliage is produced by mid-July (Lamb 1915, Kienholz 1941). The re-mainder (≈ 20%) of the foliage biomass is produced during the latter part of the growing season when conditions are favor-able. Height and radial growth begin in mid-May (Kienholz 1941, Morrow and McKee 1963, Mowbray and Oosting 1968) and continue until approximately mid-September (Morrow and McKee 1963, Lieth and Radford 1971). Root growth occurs from spring to fall when conditions are favorable (Har-ris et al. 1977). Foliage senescence occurs during the second week in October (Lamb 1915). Yellow poplar trees senesce all current foliage.
Mature loblolly pine trees produce two cohorts of foliage per year with bud break of the first flush of foliage occurring in early spring (Higginbotham 1974). The first flush ends in early May and the second foliage flush initiates in mid-May and continues until mid-June (Higginbotham 1974). Height and radial growth begin soon after bud break of the first flush of foliage and continue until late July (Miller et al. 1987). Root growth occurs from spring to fall when conditions are favor-able (Harris et al. 1977, Baker and Langdon 1990). Foliage senescence occurs late in the season with needle-cast occurring at the end of the growing season (approximately mid-Novem-ber--early December) (Higginbotham 1974). Loblolly pine trees senesce all 2-year-old foliage, retaining only current-year foliage over winter.
Carbon assimilation
Yellow poplar net C assimilation for a midsummer 11-day period at high irradiance (1000 µmol m−2 s−1; 25--30 °C) was set to be approximately 0.0192 g C g−1Cleaf h−1, based on
values recorded by Cannon et al. (1993), Chappelka et al. (1988), Gunderson et al. (1993), Neufeld et al. (1985), Norby and O’Neill (1991), Tjoelker and Luxmoore (1992), and Wull-schleger et al. (1992). Leaf respiration was set at 22% of net C assimilation (Wullschleger et al. 1992, Cannon et al. 1993).
Loblolly pine net C assimilation for a midsummer 11-day period at high irradiance (1000 µmol m−2 s−1; 25--30 °C) was set to be approximately 0.0035 g C g−1Cleaf h−1 (Cregg et al. 1993). Leaf respiration was set at 25% of net C assimilation (Samuelson et al. 1992).
The final TREGRO simulated trees were calibrated by ad-justing tissue growth rates and senescence rates in fine roots until two conditions were met: (1) when the simulated C gain of each of the tree components (foliage, branch, stem, and coarse and fine roots) and the total tree C gain was within 10% of the value for projected C gain from the literature-based allometric relationships (Tables 1 and 2), and (2) when the proportion of TNC and the ratio of structure to wood in each of the tree components at the end of a simulation matched that parameterized for the tree at the beginning of the simulation. Fine root senescence was set to approximate one complete root turnover per year for both species based on field measurements (Harris et al. 1977).
Ozone simulations
In TREGRO, effects of O3 are simulated through a cumulative effect of the pollutant on the maximum rate of photosynthesis, Vmax. The magnitude of the O3 effect is controlled by a thresh-old of cumulative O3 uptake, below which there is no effect on Vmax, and a linear decrease in Vmaxabove this threshold with increasing cumulative uptake of O3. Although O3 does not accumulate in the leaf tissue, the effect of cumulative O3 uptake is proportional to the sum of the hourly O3 concentra-tion times the foliar rate of O3 conductance, because the pri-mary avenue for O3 entry is through the stomata (Rubin et al. 1996).
To evaluate the effect of the maximum O3 response possible, we assumed that Vmax began decreasing as soon as any O3 uptake occurred in the leaves (i.e., the O3 threshold was zero). As the total amount of cumulative O3 uptake increased during the growing season, we assumed a proportional decrease in Vmax. The slope of the described response was set so that the reduction in photosynthesis observed at the end of the open-top chamber experiments matched the simulated reduction after a similar cumulative uptake of O3 had occurred.
The yellow poplar response to O3 was set in the parameter file according to the data of Cannon et al. (1993) (Figure 1), who measured a 10% reduction in net photosynthesis of seed-lings relative to charcoal-filtered air after a total cumulative O3 uptake of 0.0044 g g−1Cleaf. The loblolly pine response to O3 was set in the parameter file according to the data of Sasek et al. (1991) (Figure 1), who measured a 24% reduction in current leaf net photosynthesis relative to that of seedlings in charcoal-filtered air after a total cumulative O3 uptake of 0.0136 g g−1Cleaf.
decreased in a normal diurnal pattern (for Oak Ridge, TN, 1989), with maximum O3 concentrations of 125 ppb for be-tween 3 and 8 h per day (Figure 2). All meteorological data in the Oak Ridge meteorological file, including the O3 concentra-tions, were used to create the 8-day O3 peak episode profile. The peak O3 episode was placed in seven different (Oak Ridge, TN, 1989) meteorological files to produce peak O3 exposures centered on the first day of each month between April 1 and October 1. To insert the peak O3 episode, we simply substituted all the existing meteorological data during the insertion period with the peak meteorological data thereby avoiding the prob-lem of mismatching environmental and O3 data. However, because the overwritten areas at different times of the year do not contain identical recorded O3 concentrations, there is slight variation (up to 3.7%) in the sum00 (sum00 = cumulative sum of hourly O3 values during the growing season) O3 exposure among files between the highest (123402 ppb⋅h) and lowest (118975 ppb⋅h) sum exposure. During the 1989 growing sea-son, in the absence of our artificial O3 peak, there were no episodic periods of highly elevated O3 concentration (maxi-mum recorded hourly concentration 88 ppb O3); however, O3 concentrations (up to 132 ppb) were measured at Oak Ridge, TN, in 1988. Model simulations (3-year duration) were per-formed with each of these altered meteorological files using O3 concentrations of 0.0 (base case), 1.0, and 2.0 times the
meas-ured (1989) Oak Ridge, TN, ambient O3 concentrations (3 O3 concentrations × 7 meteorological files = 21 total simulations). Use of a 0.0 × O3 exposure, although unrealistic in a field study, permitted determination of the maximum O3 response possi-ble.
Results and discussion
Matching phenology to reported values
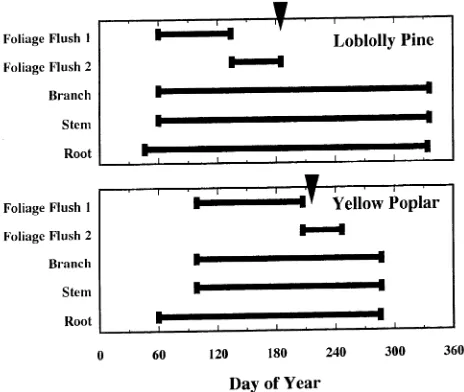
We matched phenology parameters in the base TREGRO trees with those reported in the literature for both tree species. For instance, mature loblolly pine trees produce two cohorts of foliage per year with bud break of the first flush of foliage occurring in the early spring (Day of Year (DOY) 60) and ending on approximately DOY 135 (Higginbotham 1974). The second foliage flush initiates on approximately DOY 135 and continues until DOY 184 (Higginbotham 1974). Further, in-itial seasonal foliage growth of mature yellow poplar trees begins on DOY 99 and the majority (> 80%) of the foliage is produced by DOY 206 (Lamb 1915, Kienholz 1941). The remainder (≈ 20%) of the foliage biomass is produced during an additional period (DOY 207 to 246) of shoot growth. By setting the initial base-tree parameters using this and other phenological information, we were able to reproduce these demographic patterns accurately with TREGRO (Figure 3).
Phenological development is a complex phenomenon gov-erned by a suite of environmental cues. TREGRO duplicates this process as controlled by the accumulation (from the start of simulation) of heat degree-days above 0 °C. Therefore, we were able to parameterize mature yellow poplar and loblolly pine trees in TREGRO, simulate growth for a period of 3 years, Figure 1. Assumed relationships between cumulative O3 uptake and
maximum C assimilation in yellow poplar and loblolly pine.
Figure 2. The 8-day peak ozone episode that was inserted at monthly intervals into the 1989 Oak Ridge,TN meterological data file.
and duplicate the dynamics of phenological processes that are currently reported in the literature for individual yellow poplar and loblolly pine trees. Accurate simulation of dynamic phe-nological processes with TREGRO permitted investigation of the interaction between phenophase and episodic environ-mental (O3) stress.
Ozone simulations
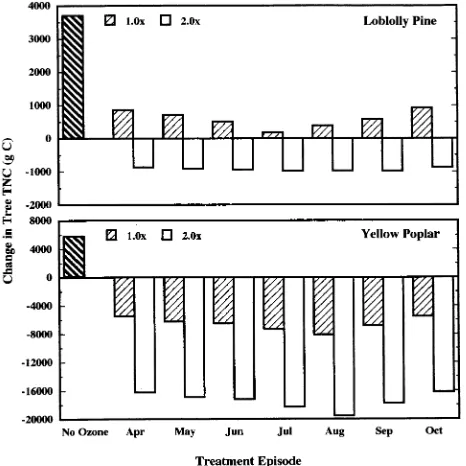
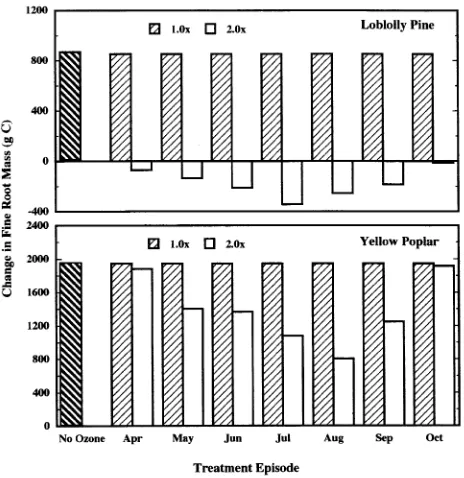
In our simulations, the presence of atmospheric O3 (1.0 or 2.0 × ambient), regardless of timing of the peak O3 episode, re-duced total tree C gain (Figure 4), coarse root C gain (Fig-ure 5), and tree TNC compartments (Fig(Fig-ure 6) compared to the control trees of both species. Carbon gain of fine roots of both species was not affected at 1.0 × ambient O3 (Figure 7). Additionally, as the O3 concentration increased (to 2.0 × ambi-ent), the O3 effects (reflected by additional reductions in total tree, coarse root, fine root, and TNC C gain) became more pronounced. Negative C gain of the coarse roots, TNC and fine roots compartments reflects utilization of previously stored TNC and root turnover without replacement, respectively. It is known from field-exposure experiments that seedlings and saplings of both species, and branches of mature loblolly pine trees are sensitive to O3 (Chappelka et al. 1985, Chappelka et al. 1988, Sasek et al. 1991, Tjoelker and Luxmoore 1992, Cannon et al. 1993, Dizengremel et al. 1994, McLaughlin et al. 1994). However, the simulation experiment represents the first time that the O3 responses of whole mature trees of these species have been examined. McLaughlin and Downing (1995) studied changes in loblolly pine stem diameter during a 5-year period in the Oak Ridge, TN area, which included the 1989 conditions used in our modeling study, and found that ambient exposure in the field in combination with elevated
temperature or low rainfall was associated with reduced stem increment. We do not know whether our simulated estimates of physiological responses accurately reflect the O3 response that would occur in mature forest-grown trees. Hanson et al. (1994) have shown that gas exchange of mature red oak ( Quer-cusrubra L.) trees exposed to O3 is affected more by O3 than similarly exposed red oak seedlings, indicating that caution
Figure 4. Change in tree mass following a 3-year TREGRO simulation of mature loblolly pine and yellow poplar trees with no O3 exposure and monthly peak O3 episodes. The response illustrated for the Octo-ber peak O3 episode was identical to a 1.0 and 2.0 × ambient exposure at this site with no peak O3 episode; therefore, values representing O3 exposure without a peak episode are not shown.
Figure 5. Change in coarse root mass following a 3-year TREGRO simulation of mature loblolly pine and yellow poplar trees with no O3 exposure and monthly peak O3 episodes. Negative values reflect utili-zation of previously stored TNC.
should be used when extrapolating the results of seedling exposure experiments to mature trees. However, the nature of our simulated responses (reduced root growth and TNC con-tent of yellow poplar and loblolly pine trees) matches those proposed in a conceptual model of O3 response (Cooley and Manning 1987), observed in O3 experiments with woody plants (see Tingey et al. 1976, Mortenson and Skyre 1990, Retzlaff et al. 1992), and predicted in other simulation exer-cises (Retzlaff et al. 1996).
Carbon gain of yellow poplar (total tree, coarse root, and TNC) was reduced by O3 to a greater extent than the corre-sponding compartments in loblolly pine, reflecting the fact that we parameterized the C assimilation (e.g., yellow poplar: Wullschleger et al. 1992 and loblolly pine: Cregg et al. 1993) and the O3 (e.g., yellow poplar: Cannon et al. 1993 and loblolly pine: Sasek et al. 1991) response parameters of the two species according to field measurements (Figure 1) (i.e., we parame-terized yellow poplar to be more sensitive to O3). This differ-ential sensitivity to O3 has implications for the competition between these two species as they co-occur and are exposed to elevated concentrations of tropospheric O3 in the forest ecosys-tems in the southeastern USA.
Phenological O3 response
The simulated response illustrated for the October peak O3 episode was identical to a 1.0 and 2.0 × ambient exposure at this site with no peak O3 episode; therefore, values repre-senting O3 exposure without a peak episode are not shown. Thus, the presence of peak O3 episodes differentially altered C gain (Figure 4), and the growth of individual tree
compart-ments (Figures 5--7) independently of the atmospheric O3 concentration. Additionally, as the O3 concentration increased to 2.0 × ambient, the effects corresponding to the timing of the peak O3 episode became more pronounced. In our simulations, the peak O3 episode in August caused the greatest reduction in C gain in yellow poplar, whereas the peak O3 episode in July caused the greatest reduction in C gain of loblolly pine. Timing of the greatest simulated O3 effect corresponded with the completion of the annual foliage production phenophase (and therefore maximum C assimilating foliage area) on each of these tree species (Figure 3). At the time of the July peak O3 episode, the simulated loblolly pine tree had reached the sea-sonal maximum photosynthetic foliage biomass. At the time of the August peak O3 episode, the simulated yellow poplar tree had produced approximately 90% of the seasonal maximum photosynthetic foliage biomass.
Similar seasonal sensitivity responses have been noted pre-viously for annual crops exposed to water stress (Eck et al. 1987, Halim et al. 1989, Stirling et al. 1989) and O3 (Blum and Heck 1980, Kohut and Laurence 1983, McLaughlin and McConathy 1983, Younglove et al. 1994). All of these studies demonstrate sensitivity (e.g., reduced biomass and crop yield) to the timing of the environmental stress, particularly when the stress corresponds with critical phenological stages. Our simu-lation is the first study to link peak O3 episodes to a specific phenophase in mature trees.
Our simulations of peak O3 episode events did not alter the phenology of the two tree species. Date of initiation, patterns, and durations of stem and fascicle elongation of loblolly pine seedlings were not affected by O3 treatment (cf. Mudano et al. 1992). However in another study, loblolly pine seedlings ex-posed to 2.0 × ambient O3 exhibited a delay in fine root production (Edwards et al. 1992). Atmospheric O3 will not normally alter the timing of phenological events directly in TREGRO because the timing of the occurrence of phenologi-cal events is driven by the accumulation (from the start of simulation) of heat degree-days above 0 °C, a model feature that is unrelated to O3 exposure. However, in our TREGRO simulations, phenology could have been altered if sufficient reductions in available C (current assimilate or stored TNC) had occurred, thereby making C unavailable at the start of a phenophase, or available C supplies were exhausted before phenophase completion.
The TREGRO simulations demonstrate that there is a criti-cal peak O3 exposure period for yellow poplar and loblolly pine that is linked to the phenology of these two species. We observed maximum O3 response when the peak O3 episode occurred at or near the completion of the annual foliage pro-duction phenophase. Such simulation studies are useful in identifying physiological responses to environmental stress heretofore unavailable because of cost and other limitations. Recent re-analysis of data from four field crop-loss yield trials identified that growth-stage-dependent phenological weight-ing of pollutant exposure may result in more effective predic-tions of O3 exposure resulting in yield reducpredic-tions (Younglove et al. 1994). Results from similar studies could be used to Figure 7. Change in fine root mass following a 3-year TREGRO
elucidate further the mechanism(s) of the phenological re-sponse of plants to environmental stress.
Acknowledgments
This research was conducted as part of research cooperative CR-820759-02 between the USEPA, the University of Nevada, Reno, and Boyce Thompson Institute for Plant Research. Additional funds were provided by the Electric Power Research Institute (EPRI) and the endowment of Boyce Thompson Institute for Plant Research. This paper has not been subject to either USEPA or EPRI policy review and should not be construed to represent policies of the agencies. We thank Dr. D. Weinstein, Dr. G. Taylor, and Dr. R. Kohut for critical manu-script review, and B. Warland for word processing assistance.
References
Baker, J.M. and O.G. Langdon. 1990. Loblolly pine (Pinustaeda L.).
In Silvics of North America, Vol. 1, Conifers. Eds. R.M. Burns and B.H. Honkala. USDA For. Serv., Agriculture Handbook 654, Wash-ington, DC, pp 497--512.
Beck, D.E. 1990. Yellow Poplar (Liriodendrontulipifera L.). In Silvics of North America, Vol. 1, Conifers. Eds. R.M. Burns and B.H. Honkala. USDA For. Serv., Agriculture Handbook 654, Washing-ton, DC, pp 406--416.
Binkley, D., D. Richter, M.B. David and B. Caldwell. 1992. Soil chemistry in a loblolly/longleaf pine forest with interval burning. Ecol. Appl. 2:157--164.
Blanche, C.A., J.D. Hodges and T.E. Nebeker. 1985. A leaf area--sap-wood area ratio developed to rate loblolly pine vigor. Can. J. For. Res. 15:1181--1184.
Blum, U. and W.W. Heck. 1980. Effects of acute ozone exposures on snap bean at various stages of its life cycle. Environ. Exp. Bot. 20:73--85.
Cannon, W.N., Jr., B.R. Roberts and J.H. Barger. 1993. Growth and physiological response of water-stressed yellow poplar seedlings exposed to chronic ozone fumigation and ethylenediurea. For. Ecol. Manag. 61:61--73.
Chappelka III, A.H., B.I. Chevone and T.E. Burk. 1985. Growth responses of yellow poplar (Liriodendrontulipifera L.) seedlings to ozone, sulfur dioxide, and simulated acidic precipitation, alone and in combination. Environ. Exp. Bot. 25:233--244.
Chappelka III, A.H., B.I. Chevone and J.R. Seiler. 1988. Growth and physiological responses of yellow poplar seedlings exposed to ozone and simulated acidic rain. Environ. Pollut. 49:1--18. Clark, A. 1992. Characteristics of timber stands containing sufficient
heartwood for cavity excavation by red-cockaded woodpecker clans. Proc. Seventh Biennial Southern Silvicultural Research Con-ference, Mobile, AL. Southern For. Exp. Stn., Gen. Tech. Rep. 50, New Orleans, LA, pp 621--626.
Clark, A. and J.G. Schroeder. 1977. Biomass of yellow poplar in natural stands in western North Carolina. USDA For. Serv. Res. Paper SE-165, Asheville, NC, 41 p.
Cooley, D.R. and W.J. Manning. 1987. The impact of ozone on assimilate partitioning in plants: A review. Environ. Pollut. 47:95--113.
Cregg, B.M., R.O. Teskey and P.M. Dougherty. 1993. Effect of shade stress on growth, morphology, and carbon dynamics of loblolly pine branches. Trees 7:208--213.
Dizengremel, P., T.W. Sasek, K.J. Brown and C.J. Richardson. 1994. Ozone-induced changes in primary carbon metabolism enzymes of loblolly pine needles. J. Plant Physiol. 144:300--306.
Eck, H.V., A.C. Mathers and J.T. Musick. 1987. Plant water stress at various growth stages and growth and yield of soybeans. Field Crops Res. 17:1--16.
Edwards, G.S., A.L. Friend, E.G. O’Neill and P.T. Tomlinson. 1992. Seasonal patterns of biomass accumulation and carbon allocation in
Pinustaeda seedlings exposed to ozone, acidic precipitation, and reduced soil Mg. Can. J. For. Res. 22:640--646.
Farquhar, G.D., S. von Caemmerer and J.A. Berry. 1980. A biochemi-cal model of photosynthetic CO2 assimilation in leaves of C3 spe-cies. Planta 149:78--90.
Fehsenfeld, F., J. Meagher and E. Cowling. 1994. Southern oxidants study: 1993 data analysis workshop report. North Carolina State University, Raleigh, NC, 92 p.
Friend, A.L., P.T. Tomlinson, R.E. Dickson, E.G. O’Neill, N.T. Ed-wards and G.E. Taylor, Jr. 1992. Biochemical composition of lob-lolly pine reflects pollutant exposure. Tree Physiol. 11:35--47. Gunderson, C.A., R.J. Norby and S.D. Wullschleger. 1993. Foliar gas
exchange responses of two deciduous hardwoods during 3 years growth in elevated CO2: no loss of photosynthetic enhancement. Plant Cell Environ. 16:797--807.
Halim, R.A., D.R. Buxton, M.J. Hattendorf and R.E. Carlson. 1989. Water-deficit effects on alfalfa at various growth stages. Agron. J. 81:765--70.
Hanson, P.J., L.J. Samuelson, S.D. Wullschleger, T.A. Tabberer and G.S. Edwards. 1994. Seasonal patterns of light-saturated photosyn-thesis and leaf conductance for mature and seedling Quercus ru-bra L. foliage: differential sensitivity to ozone exposure. Tree Physiol. 14:1351--1366.
Harris, W.F., R.S. Kinerson, Jr. and N.T. Edwards. 1977. Comparison of belowground biomass of natural deciduous forest and loblolly pine plantations. Pedobiologia 17:369--381.
Heck, W.W., A.S. Heagle, J.E. Miller and J.O. Rawlings. 1991. A national program (NCLAN) to assess the impact of ozone on agricultural resources. In Tropospheric Ozone and the Environ-ment. Eds. R.L. Berglund, D.R. Lawson and D.J. McKee. Air and Waste Management Assoc., Pittsburgh, PA, pp 225--254. Higginbotham, K.O. 1974. The influence of canopy position and the
age of leaf tissue on growth and photosynthesis in loblolly pine. Ph.D. Diss., Dept. of Botany, Duke University, Durham, NC, 246 p. Jensen, K.F. and R.L. Patton. 1990. Response of yellow poplar ( Liri-odendrontulipifera L.) seedlings to simulated acid rain and ozone. 1. Growth modifications. Environ. Exp. Bot. 30:59--66.
Kienholz, R. 1941. Seasonal course of height growth in some hard-woods in Conneticut. Ecology 22:249--258.
Kohut, R. and J.A. Laurence. 1983. Yield response of red kidney bean
Phaseolusvulgaris to incremental ozone concentrations in the field. Environ. Pollut. 32:233--240.
Kolb, T.E. and K.C. Steiner. 1990. Growth and biomass partitioning of northern red oak and yellow poplar seedling: effects of shading and grass root competition. For. Sci. 36:34--44.
Lamb, G. 1915. A calendar of the leafing, flowering and seeding of common trees of the eastern United States. USDA Weather Bureau, Monthly Weather Review Suppl., Washington, DC, 2:3--19. Lieth, H. and J.S. Radford. 1971. Phenology, resource management,
and synagraphic computer mapping. BioScience 21:62--70. McLaughlin, S.B. and D.J. Downing. 1995. Interactive effects of
ambient ozone and climate measured on growth of mature forest trees. Nature 374:252--254.
McLaughlin, S.B., P.A. Layton, M.B. Adams, N.T. Edwards, P.J. Hanson, E.G. O’Neill and W.K. Roy. 1994. Growth responses of 53 open-pollinated loblolly pine families to ozone and acid rain. J. En-viron. Qual. 23:247--257.
Miller, W.F., P.M. Dougherty and G.L. Switzer. 1987. Effect of rising carbon dioxide and potential climate change on loblolly pine distri-bution, growth, survival, and productivity. In The Greenhouse Ef-fect, Climate Change, and U.S. Forests. Eds. W.E. Shands and J.S. Hoffman. The Conservation Foundation, Washington, DC, pp 157--187.
Morrow, R.R. and W.W. McKee. 1963. Seasonal radial growth of hardwoods. Cornell Plant. 18:68--70.
Mortenson, L.M. and O. Skyre. 1990. Effects of low ozone concentra-tions on growth of Betulapubescens Ehrh., Betulaverrucosa Ehrh. and Alnusincana (L.) Moench. New Phytol. 115:165--170. Mowbray, T.B. and H.J. Oosting. 1968. Vegetation gradients in
rela-tion to environment and phenology in a southern Blue Ridge gorge. Ecol. Monogr. 38:309--344.
Mudano, J.E., H.L. Allen and L.W. Kress. 1992. Stem and foliage elongation of young loblolly pine as affected by ozone. For. Sci. 38:324--335.
Musselman, R.C., R.J. Oshima and R.E. Gallavan. 1983. Significance of pollutant concentration distribution in the response of ‘Red Kidney’ beans to ozone. J. Am. Soc. Hortic. Sci. 108:347--351. Musselman, R.C., T. Younglove and P.M. McCool. 1994. Response of
Phaseolusvulgaris L. to differing ozone regimes having identical total exposure. Atmos. Environ. 28:2727--2731.
National Academy of Science. 1992. Rethinking the ozone problem in urban and regional air pollution. National Academy Press, Wash-ington, DC, 500 p.
Neufeld, H.S., J.A. Jernstedt and B.L. Haines. 1985. Direct foliar effects of simulated acid rain. I. Damage, growth and gas exchange. New Phytol. 99:389--405.
Norby, R.J. and E.G. O’Neill. 1991. Leaf area compensation and nutrient interactions in CO2-enriched seedlings of yellow poplar (Liriodendrontulipifera L.). New Phytol. 117:515--528.
Panshin, A.J. and C. de Zeeuw. 1980. Textbook of wood technology. Structure, identification, properties and uses of the commercial woods of the United States and Canada. 4th Edn. McGraw-Hill, New York, 722 p.
Retzlaff, W.A., T.M. DeJong and L.E. Williams. 1992. Photosynthesis and growth response of almond to increased atmospheric ozone partial pressures. J. Environ. Qual. 21:208--216.
Retzlaff, W.A., D.A. Weinstein, J.A. Laurence and B. Gollands. 1996. Simulated root dynamics of a 160-year-old sugar maple (Acer saccharum Marsh.) tree with and without ozone exposure using the TREGRO model. Tree Physiol. 16:915--921.
Richter, D.D., D. Markewitz, C.G. Wells, H.L. Allen, R. April, P.R. Heine and B. Urrego. 1994. Soil chemical change during three decades in an old-field loblolly pine (Pinustaeda L.) ecosystem. Ecology 75:1463--1473.
Rubin, G., C.E. McCulloch and J.A. Laurence. 1996. A model for estimating daily ozone dose for plants from atmospheric ozone concentration and vapor pressure deficit. J. Agric. Biol. Environ. Stat. 1:1--16.
Samuelson, L.J., J.R. Seiler and P.P. Feret. 1992. Gas exchange and canopy structure of 9-year-old loblolly pine, pitch pine and pitch × loblolly hybrids. Trees 6:28--31.
Sasek, T.W., C.J. Richardson, E.A. Fendick, S.R. Bevington and L.W. Kress. 1991. Carryover effects of acid rain and ozone on the physi-ology of multiple flushes of loblolly pine seedlings. For. Sci. 37:1078--1098.
Smith, W.R., R.M. Farrar, Jr., P.A. Murphy, J.L. Yeiser, R.S. Meldahl and J.S. Kush. 1992. Crown and basal area relationships of open-grown southern pines for modeling competition and growth. Can. J. For. Res. 22:341--347.
Stirling, C.M., C.K. Ong and C.R. Black. 1989. The response of groundnut (Arachishypogaea L.) to timing of irrigation. I. Devel-opment and growth. J. Exp. Bot. 40:1145--53.
Taylor, G.E., Jr. 1994. Role of genotype in the response of loblolly pine to tropospheric ozone: Effects at the whole-tree, stand, and regional level. J. Environ. Qual. 23:63--82.
Taylor, G.E., Jr., D.W. Johnson and C.P. Andersen. 1994. Air pollution and forest ecosystems: a regional to global perspective. Ecol. Appl. 4:662--689.
Tingey, D.T., R.G. Wilhour and C. Standley. 1976. The effect of chronic ozone exposures on the metabolite content of ponderosa pine seedlings. For. Sci. 22:234--241.
Tjoelker, M.G. and R.J. Luxmoore. 1992. Soil nitrogen and chronic ozone stress influence physiology, growth and nutrient status of
Pinustaeda L. and Liriodendrontulipifera L. seedlings. New Phy-tol. 119:69--81.
Trimble, G.R., Jr. and E.H. Tryon. 1966. Crown encroachment into openings cut in Appalachian hardwood stands. J. For. 64:104--108. Van Lear, D.H. and P.R. Kapeluck. 1995. Above- and below-stump biomass and nutrient content of a mature loblolly pine plantation. Can. J. For. Res. 25:361--367.
Van Lear, D.H., M.A. Taras, J.B. Waide and M.K. Augspurger. 1986. Comparison of biomass equations for planted vs. natural loblolly pine stands of sawtimber size. For. Ecol. Manag. 14:205--210. Vogt, K. 1991. Carbon budgets of temperate forest ecosystems. Tree
Physiol. 9:69--86.
Weinstein, D.A., R.M. Beloin and R.D. Yanai. 1991. Modeling changes in red spruce carbon balance and allocation in response to interacting ozone and nutrient stresses. Tree Physiol. 9:127--146. Wullschleger, S.D., R.J. Norby and D.L. Hendrix. 1992. Carbon
ex-change rates, chlorophyll content, and carbohydrate status of two forest tree species exposed to carbon dioxide enrichment. Tree Physiol. 10:21--31.