Summary
Data were collected from two branches from each
whorl of nine open-grown
Abies balsamea
(L.) Miller trees to
test the hypothesis that specific leaf area (SLA, m
2projected
fresh leaf area kg
–1oven-dry foliage) is constant among five
foliage age classes (current-year, 1-year-old, 2-year-old,
3-year-old and 4-3-year-old-plus). Between-tree variation in SLA
was greater than within-tree variation. Differences in SLA
among the foliage age classes were small, but statistically
significant, showing a trend of decreasing SLA with increasing
foliage age. Using data from two previous biomass studies, we
found that three different methods of calculating SLA of
indi-vidual trees produced the same projected leaf area estimates.
To test the hypothesis that foliage mass increases with
foli-age foli-age as a result of secondary xylem or phloem development,
we examined the secondary vascular development of foliage
collected from five age classes and three crown sections in an
open-grown
A. balsamea. The number of rows of xylem cells
was not constant among foliage age classes, but the differences
were small and showed no consistent pattern of change with
foliage age. Total number of rows of phloem cells increased,
number of living rows of phloem cells decreased, and the
number of rows of nonliving crushed phloem cells increased
with foliage age.
Keywords: balsam fir, needle shrinkage, nested analysis of
variance, projected leaf area, secondary phloem development,
xylem.
Introduction
The assumption of a constant specific leaf area (SLA, m
2projected fresh leaf area kg
–1oven-dry foliage) within
individ-ual trees has been made in numerous ecophysiological studies
of gymnosperms (e.g., Gholz et al. 1976, Marchand 1984,
Dean and Long 1986, Long and Smith 1989, Shelburne et al.
1993, Smith 1993). In some studies, the assumption of a
constant SLA between trees has also been made (e.g.,
White-head 1978, Kaufmann and Troendle 1981, Marchand 1984).
Recently, Coyea and Margolis (1992) reported differences in
SLA between current-year and 1-year-old foliage of
Abies
balsamea
(L.) Miller, but found no statistical difference in
SLA between 1-year-old and older foliage. Although they
sampled leaves from each of three crown sections, they did not
report any variation in SLA among crown sections. Other
investigators, however, have reported differences in SLA
val-ues that they attributed to differences in foliage age class or
within-crown position (Kellomäki and Oker-Blom 1981,
Hager and Sterba 1985, Gower and Norman 1991, van Hees
and Bartelink 1993).
Both Dean and Long (1986) and Long and Smith (1989)
suggested that SLA estimates based on an oven-dry projected
leaf area would slightly underestimate total projected surface
area when applied to an entire tree crown. However, Waring et
al. (1982) estimated that oven-dry projected leaf area would be
reduced up to 25% as a result of needle shrinkage. To our
knowledge, no studies have examined the effect of
oven-dry-ing on shrinkage of
A. balsamea
foliage.
Our main objective was to test the hypothesis that a
com-mon SLA could be used for all foliar age classes of
A.
balsamea. On rejection of this hypothesis, we performed a
histological study to detect possible differences in secondary
vascular development (defined as growth after elongation and
maturation of the primary needle tissue is completed, Ewers
1982b) within xylem and phloem tissues among foliage age
classes. A secondary objective was to quantify foliage
shrink-age after oven-drying and examine the relationship among
fo-liage age classes.
Materials and methods
Study area
This study was conducted on the University of Maine Dwight
B. Demeritt Forest (44°55
′
N, 68°38
′
W) and the Penobscot
Experimental Forest (44°50
′
N, 68°35
′
W). Both forests are
located in the Penobscot River Valley on the border of the
central and southern climatic zones of Maine (Briggs and
Lemin 1992). Soils developed on a parent material of glacial
Canopy dynamics and the morphological development of
Abies
balsamea
: effects of foliage age on specific leaf area and secondary
vascular development
D. W. GILMORE,
1
R. S. SEYMOUR,
1
W. A. HALTEMAN
2
and M. S. GREENWOOD
1
1 Department of Forest Ecosystem Science, College of Natural Resources, Forestry and Agriculture, University of Maine, Orono, ME 04469-5755, USA
2 Department of Mathematics and Statistics, College of Sciences, University of Maine, Orono, ME 04469-5752, USA
Received April 12, 1994
origin (Rourke et al. 1978). Soils were variable but were
predominantly classified as coarse loamy, mixed, frigid, Aquic
or Typic Haplorthods (Soil Survey Staff 1990), or Gleyed or
Orthic Ferro-Humic Podzols (Canadian Soil Survey
Commit-tee 1978). Trees were sampled from advance regeneration
released in the mid-1980s and mixed-species, low density
conifer stands with basal area ranging from 2 to 18 m
2ha
−1and
diameter at breast height (DBH measured at 1.3 m) ranging
from 0.4 to 17.5 cm.
Specific leaf area study
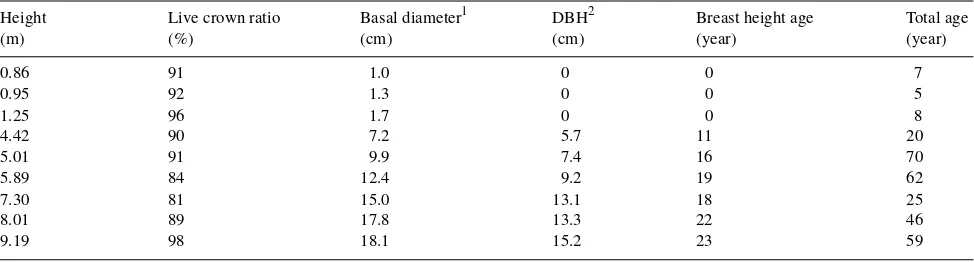
Nine trees (Table 1) were randomly selected from 27 healthy,
naturally regenerated, open-grown A. balsamea. Four of these
trees were suppressed before reaching 1.3 m. Open-grown
trees from similar sites were selected to remove competitive
influences and allow us to focus on differences in SLA that
could be attributed to individual trees and foliage age.
Two one-needle samples were collected from each of five
foliage age classes (current-year, 1-year-old, 2-year-old,
3-year-old and 4-3-year-old-plus) from two randomly selected
first-order branches within each whorl from each tree. Foliage
age was determined by counting back growth increments from
the stem tip toward the tree bole (Ewers and Schmid 1981).
Foliage samples were collected in late-July and August 1992,
2 or more weeks after bud set. Samples were placed in labeled
paper envelopes, loosely arranged in a plastic bag, temporarily
stored on ice in an insulated cooler, and frozen within 4 h of
collection. After thawing, projected leaf area (fresh) was
meas-ured (to the nearest 0.001 cm
2) for individual needles with the
Decagon Image Analysis System (Decagon Devices Inc.,
Pull-man, WA, USA). Needles were oven-dried at 65 °C for 2 days,
their mass measured (to the nearest 0.0001 g) and SLA (m
2kg
−1) values calculated. Oven-dry projected leaf areas were
determined for a subset of the needle samples that were not
damaged after oven-drying to examine the effect of foliage age
on needle shrinkage.
Histological study
On August 6, 1993, well after bud set, two, 10-needle samples
were collected from each of five foliage age classes from one
branch in each of three crown sections (upper being the sixth
whorl, middle being the fifteenth whorl, and lower being the
twenty-first whorl) from the northern portion of the crown of
an A. balsamea tree. The tree was 31 years old, naturally
regenerated with a DBH of 18.2 cm, a height of 11.3 m and a
live crown ratio of 96%. The northern exposure of this tree was
chosen because it received the least amount of shade from the
surrounding stand. One set of 10-needle samples was used to
calculate a composite SLA. The second set of needle samples
was immediately fixed in chromic acid, acetic acid and
for-malin (CRAF III, see Berlyn and Miksche 1976). Samples
were tied into five-needle bundles with thread, dehydrated in a
tertiary-butyl alcohol series, infiltrated with Paraplast
(Caro-lina Biological Supply Co., Burlington, NC, USA),
trans-versely sectioned at a 10 µm thickness near their midsection,
stained with safranin-fast green, and mounted in a Permount
resin medium (Fisher Scientific Co., Fair Lawn, NJ, USA) on
microscope slides (Berlyn and Miksche 1976). The number of
rows of xylem and phloem (both living and crushed) cells were
counted in the median radial file of cells (Ewers 1982b, Ewers
and Aloni 1987) for each of the two vascular bundles in each
individual needle under a Leitz Laborlux 20 microscope (Ernst
Leitz Wetzlar Gmblt, Wetzlar, Germany). Developing sieve
cells and cambial zone cells were included in counts of phloem
cells (Ewers 1982b).
Data analysis----specific leaf area study
One-factor ANOVAs were used to test for differences in SLA,
projected fresh leaf area (cm
2), oven-dry mass (g), needle
length (cm) and needle width (cm) among the five foliage age
classes.
To examine the effect of within-crown locations on SLA,
crowns of the three trees less than 6 m in height were divided
into two sections and crowns of the three taller trees were
divided into three (upper, middle and lower) sections. Trees
less than 1.3 m in height were excluded from this analysis. For
each of the five foliage age classes, we examined the variation
in SLA with the model:
SLA =T
+
S(T)+W(TS)
+B(TSW)
+
ε,
(1)
[image:2.612.54.541.587.718.2]where T = tree, S = crown section, W = whorl, B = branch,
Table 1. Mensurational characteristics of the sample trees (n = 9).
Height Live crown ratio Basal diameter1 DBH2 Breast height age Total age
(m) (%) (cm) (cm) (year) (year)
0.86 91 1.0 0 0 7
0.95 92 1.3 0 0 5
1.25 96 1.7 0 0 8
4.42 90 7.2 5.7 11 20
5.01 91 9.9 7.4 16 70
5.89 84 12.4 9.2 19 62
7.30 81 15.0 13.1 18 25
8.01 89 17.8 13.3 22 46
9.19 98 18.1 15.2 23 59
1 At 15 cm above ground line.
parentheses denote nested effects, and ε = error NID~(0,σ
2).
Nested ANOVAs had fixed effects (S and W) nested within
random effects (T) and a random effect (B) nested within fixed
effects. Model 1 was inherently unbalanced because of missing
whorls (e.g., whorls that failed to develop on every tree), the
presence of only one branch within some whorls, and the
absence of older foliage on younger branches. Although the
number of crown sections per tree was dependent on tree
height, this did not adversely affect the balanced design issue
because S was nested in T. Appropriate error terms were
calculated with PC-EMS (Dallal 1985).
The F statistic for T, S(T) and W(TS) effects were calculated
using the mean square for the B(TSW) effect. The F statistic for
B(TSW) was calculated with the model mean square error. We
partially compensated for the unbalanced nature of our design
by eliminating whorls with only one branch from our analysis
and using the General Linear Models Procedure of SAS (SAS
Institute Inc., Cary, NC, USA).
A two-factor ANOVA was used to examine between-tree
and between-needle age effects on needle shrinkage, as well as
the effect of their interaction.
Data analysis----secondary needle development
Two-factor, nested ANOVAs were performed with the model:
Y=Fa +S+FaS+N(S
)
+Vb(N)
+ε,
(2)
to test the main effects of foliage age (F
a) and crown section
(S), their interaction, and the nested effects of needle within
crown section N(S
) and vascular bundle within needle V
b(N)
on the number of rows of xylem cells, living phloem cells and
crushed phloem cells which are designated as Y in Model 2. All
factors in this model were fixed with the exception of N. The
F statistic for S was calculated using the mean square from F
aS;
all other F statistics were calculated with mean square error
(Dallal 1985). All statistical analyses for the histological study
were done with SYSTAT (Wilkinson 1990).
Results
Specific leaf area study
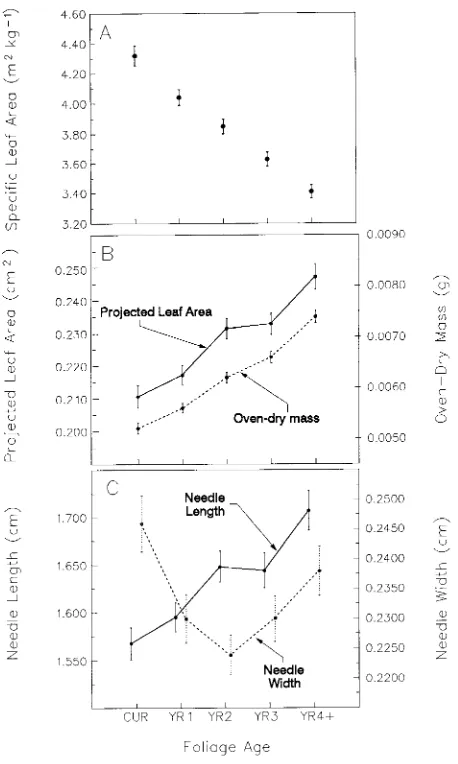
The ANOVA of the composite data revealed differences in
specific leaf area, projected fresh leaf area, oven-dry mass,
needle length, and needle width among foliage age classes
(P = 0.001 for each ANOVA). Specific leaf area declined,
projected fresh leaf area increased, oven-dry mass increased,
and needle length increased with foliage age. No consistent
change in needle width was observed with foliage age
(Fig-ure 1). Residual analyses following all ANOVA suggested no
serious departures from normality.
The null hypotheses of equal SLA values among trees [T],
among crown sections within trees [S(T)], and among their
error term, branch within crown section within tree [B(TSW)],
were rejected for all foliage age classes. Model 1 explained 86
to 96% of the variability in SLA for each of the five foliar age
classes (Table 2).
Both needle age (P = 0.005) and between-tree variation (P =
0.001) affected needle shrinkage, but no significant interaction
(P = 0.223) was detected between these two variables.
Shrink-age was relatively constant (between 8.3 and 8.9%) among the
four younger foliage age classes but decreased to 5.3% for the
4-year-old-plus foliage (Table 3); however, our shrinkage
val-ues are considerably less then the 25% estimated by Waring et
al. (1982).
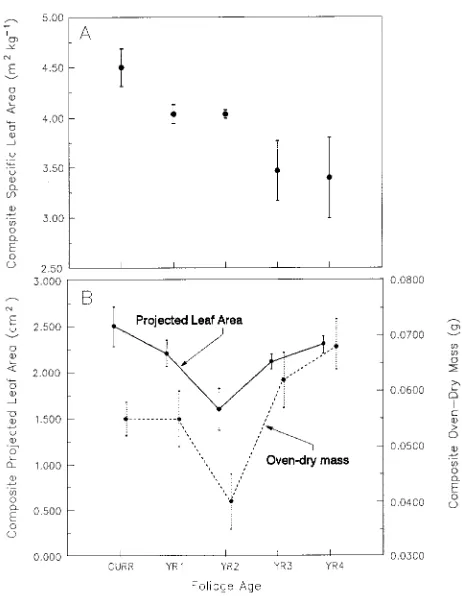
Histological study
Specific leaf area decreased as foliage age increased
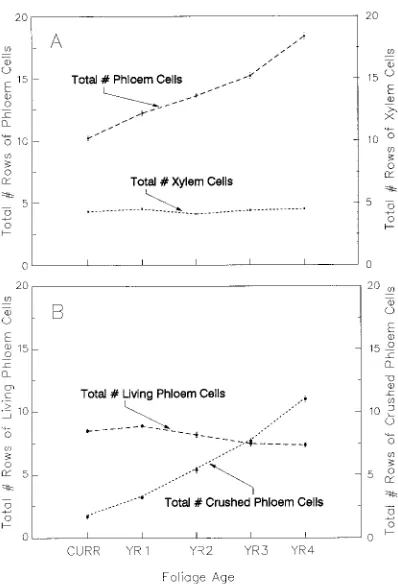
(Fig-ure 2). Foliage age class had a significant influence on the
number of rows of xylem, total phloem, living phloem and
number of crushed phloem cells per vascular bundle. Although
foliage age class had a significant effect on the number of rows
of xylem cells (Table 4), the differences were small and no
relationship was observed with foliage age (Figure 3A). The
[image:3.612.328.557.299.681.2]total number of rows of phloem cells increased steadily in
older foliage (Figure 3A), but the number of rows of living
phloem cells decreased and the number of rows of nonliving
crushed phloem cells progressively increased (Figure 3B).
Crown section (S) did not affect the number of rows of
xylem cells or total number of rows of phloem cells, but
influenced both the number of living and crushed phloem cells.
The interaction between foliage age and crown section was
significant in all four models. Between-needle variation within
S was detected only for the living phloem. No within-needle
variation was detected for the xylem or phloem (Table 4).
Discussion
We observed a trend of decreasing SLA with increasing foliage
age. Although both Marchand (1984) and Coyea and Margolis
(1992) provided foliage/sapwood area regression equations for
A. balsamea, neither paper reported SLA values for individual
needles. Our results are consistent with those for Pinus
sylvestris L. where a decrease in SLA was reported with an
increase in foliage age (van Hees and Bartelink 1993).
Secondary phloem growth occurred in the A. balsamea
needles suggesting an anatomical explanation for the increase
in foliar mass and the decrease in SLA as needles aged.
Secondary phloem growth has been observed in foliage of
other gymnosperms including Cedrus libani Barrelier.,
Cryp-tomeria japonica Don., Picea abies (L.) Karst., P. sylvestris,
Taxus baccata L. (Elliot 1937), Abies lasiocarpa (Hook.)
Nutt., Picea engelmanni (Parry) Engelm., Pinus contorta
Loud. (Stover 1944), Pinus longaeva D.K. Bailey, Pinus nigra
Arnold, Pinus strobus L., Abies concolor (Gord. and Glend.)
Lindl., Sequoia sempervirens (D. Don) Endl., Pinus
balfouri-ana var. austrina Grev. and Balf., Pinus flexilis James, Pinus
muricata D. Don (Ewers 1982b) and Pinus brutia Ten. (Ewers
and Aloni 1987).
[image:4.612.53.541.98.211.2]Little or no secondary xylem growth was detected in the
studies cited above, and it is unlikely that secondary xylem
growth occurs in gymnosperm needles (Ewers 1982a, 1982b).
Random noise, perhaps caused by between-tree variation and
annual variation in growth conditions, may have caused the
small, but significant differences in the number of rows of
Table 2. P-Values and mean squares (MS) for the nested ANOVA and factors within the nested ANOVA by foliage age class for the model: SLA = T + S(T) + W(TS)+ B(TSW) + ε1, where T = tree, S = crown section, W = whorl, and B = branch.Effect Current-year 1-Year-old 2-Year-old 3-Year-old 4-Year-old-plus
P-value MS P-value MS P-value MS P-value MS P-value MS
Model 0.001 2.66 0.001 1.27 0.001 0.86 0.001 0.64 0.001 0.47
T 0.001 21.72 0.001 10.19 0.001 8.04 0.001 5.11 0.001 2.56
S(T) 0.001 12.57 0.001 4.46 0.001 2.89 0.001 2.16 0.001 1.28
W(TS) 0.789 0.92 0.136 0.66 0.089 0.38 0.008 0.33 0.005 0.33
B(TSW) 0.001 1.13 0.001 0.49 0.001 0.25 0.001 0.25 0.001 0.13
r2 0.95 0.94 0.93 0.90 0.86
n 266 2452 222 202 1792
1 F Statistics for T, S(T) and W(TS) were calculated with MS for B(TSW).
2 One needle from one branch for each of these foliage age classes was damaged and eliminated from all analyses.
Table 3. Mean values for needle shrinkage ± 1 standard error by foliage age class.
Foliage age class n Percent shrinkage (%) Standard error
Current-year 151 8.9 ± 0.52
1-Year-old 110 8.7 ± 0.62
2-Year-old 99 8.3 ± 0.59
3-Year-old 86 8.7 ± 0.83
4-Year-old-plus 76 5.3 ± 0.56
[image:4.612.56.287.400.698.2]xylem cells among foliage age classes (Table 4 and Figure 3A).
Fluctuations in annual growth conditions may also influence
the number of radial rows of xylem cells produced in a given
year.
Gibberellic acid promotes phloem differentiation in stems of
conifers (DeMaggio 1966), and in the presence of auxin it
promotes phloem differentiation in the foliage of Pinus (Ewers
and Aloni 1985). The formation of additional phloem, but not
xylem, in the needles of A. balsamea supports the hypothesis
that, in addition to endogenous auxin and gibberellin, an
un-identified tracheid differentiation factor is produced in young,
but not old needles, that limits tracheid differentiation both in
the stem and in the needle (Ewers and Aloni 1985).
The trend of increasing projected leaf area and needle length
with increasing age of A. balsamea foliage is consistent with
the observations of Morris (1951), who suggested that primary
needle growth continues as foliage becomes older. However,
other studies have demonstrated that needle growth in
gymno-sperms is completed within one growing season (Kienholz
1934, Ewers 1982a, 1982b). Because we did not compare the
length of the same needles during two successive growing
seasons, we cannot draw any conclusions about the
continu-ation of primary needle growth in A. balsamea after the first
growing season. In contrast to our observations and those of
Morris (1951), Piene and Percy (1984) found considerable
variation in needle length among foliage age classes for A.
bal-samea, which implies differences in projected leaf area. These
differences among foliage age classes may be attributed to
growing conditions (e.g., annual precipitation, temperature)
during the time of needle formation (Morgan et al. 1983).
In addition to continued phloem development, several
physiological factors may contribute to an increase in foliage
mass as needles age. Stover (1944) found that cuticle thickness
increases with needle age in three western North American
gymnosperms. Parenchyma cells are known to accumulate
phenolic derivatives, and leaf transfusion tissue contains
in-creased concentrations of starch during certain times of the
year (Esau 1965). Oren et al. (1986a) postulated that a decrease
in SLA with age could be attributed to a reduction in the rate
of soluble carbohydrate export in relation to photosynthetic
rate in forest-grown P. abies. Loach and Little (1973) reported
that carbohydrate concentrations increase in A. balsamea as
foliage matures. Decreases in SLA with needle age may also
be caused, in part, by the absence of carbon sinks (i.e., an active
basal meristem) in the needle. This would keep leaf area
constant and possibly allow carbohydrates to accumulate in the
leaf and limit photosynthetic carbon fixation by feedback
inhibition (Ledig 1976). This hypothesis is consistent with the
findings of Clark (1961) and Loach and Little (1973) who
reported that photosynthesis decreases progressively as A.
bal-samea foliage ages.
[image:5.612.71.561.122.203.2]Our study indirectly supports the findings of Clark (1961)
and Loach and Little (1973). The decrease in number of rows
of living phloem cells with increasing foliage age (Figure 3B)
Table 4. P-Values for the nested ANOVA and factors within the nested ANOVA by foliage age class for the model: Y = Fa + S + FaS + N(S) + Vb(N)+ ε1, where Y = number of xylem, total phloem (TP), live phloem (LP) or crushed phloem (CP) cells, Fa = foliage age (current-year, 1-year-old,
2-year-old, 3-year-old or 4-year-old), S = upper, middle or lower crown section, N(S ) = nested needle effect within S, and Vb(N) = nested vascular
bundle effect within needle.
Variable Model P-Value of effect
P-value r2 Fa S FaS N(S) V(N)
Xylem 0.001 0.55 0.001 0.276 0.013 0.065 0.774
TP 0.001 0.92 0.001 0.063 0.001 0.166 0.317
LP 0.001 0.69 0.001 0.037 0.001 0.003 0.302
CP 0.001 0.95 0.001 0.003 0.002 0.156 0.629
1F Statistic for S was calculated with MS for F aS.
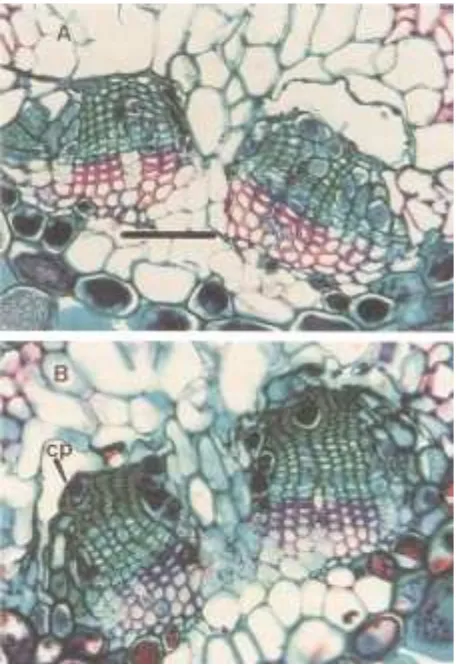
[image:5.612.75.274.240.532.2]suggests that needles gradually lose their ability to export
photosynthate. In contrast, P. longaeva has a constant number
of rows of living phloem cells regardless of foliage age (Ewers
1982b). Although Ewers (1982b) did not report any statistics,
his graphical analysis is suggestive of a decrease in the number
of rows of living phloem cells in older foliage. Phenologically,
the current-year foliage of A. balsamea appeared to be more
vigorous and healthy than the older foliage (Figures 4A and
4B). The vascular bundle becomes compressed as phloem
cells are crushed and accumulate at the endodermis.
Early studies in needle morphology have shown that
gym-nosperm sun leaves are heavier because of their thicker
epider-mis and cuticle, and greater amount of palisade tissue relative
to shade leaves (Korstian 1925, Larsen 1927). Other
ecophysi-ological studies of other gymnosperms, including Picea
sitchensis (Bong.) Carr. (Lewandowska and Jarvis 1977),
Tsuga heterophylla (Raf.) Sarg. (Tucker and Emmingham
1977) and Pseudotsuga menziesii (Mirb.) Franco (Del Rio and
Berg 1979), have shown that sun leaves have a lower SLA
than shade leaves. Sun leaves become lighter when they are
shaded (Drew and Ferrell 1977, Kozlowski et al. 1991) and
their SLA increases. Mutual shading of lower branches
in-creases as trees become older and taller, and may therefore
contribute to an increase in SLA with needle age. This would
account for the observed increase in SLA with depth in the tree
crown for P. sylvestris (Kellomäki and Oker-Blom 1981, van
Hees and Bartelink 1993). We minimized the effects of
be-tween-tree shading on needle development in this study by
se-lecting open-grown trees. Although we could not reduce the
effects of mutual shading, we conclude that the decrease in
leaf mass caused by mutual shading was minimal compared
with the increase in foliage mass as a result of secondary
vas-cular development.
Numerous investigators have sampled foliage from three
crown positions (Moir and Francis 1972, Oren et al. 1986a,
1986b, Keane and Weetman 1987, Gower and Norman 1991,
Coyea and Margolis 1992) to estimate SLA for each crown
section. Although this is more efficient than sampling foliage
from every whorl, a more efficient method of calculating SLA
would be to determine an average SLA for individual trees.
We used data from two biomass studies of A. balsamea
(Young 1981, Briggs 1982) and our average SLA values to
compare three methods of calculating projected leaf area
(PLA) (Table 5).
First, we applied our composite average SLA by foliage age
class to the data of Young (1981) and Briggs (1982) to
calcu-late PLA1. Because Briggs (1982) combined the 2-year-old
and 3-year-old foliage, we used an unweighted, arithmetic
mean calculated from the 2-year and 3-year SLAs to calculate
PLA for these foliage age classes. We calculated a second PLA
(PLA2) by using the unweighted, arithmetic mean SLA for our
composite data (Marchand 1984). A third PLA (PLA3) was
calculated with the current-year SLA and an unweighted,
arithmetic SLA of the older age classes for the older foliage
(Coyea and Margolis 1992). We then used two paired t-tests to
make comparisons between PLA1 and PLA2, and between
PLA1 and PLA3 for the combined data in Table 5. We did not
compare PLA2 and PLA3.
No differences were detected between PLA1 and PLA2
(P = 0.819), or between PLA1 and PLA3 (P = 0.359),
suggest-ing that it may be possible to obtain reliable PLA estimates
based on an average SLA for each tree provided that foliage
samples are collected from at least the five youngest foliage
age classes. Previous biomass studies have shown that 86
(Clark 1961) to 91% (Baskerville 1965) of the foliage of
forest-grown A. balsamea is in the five youngest foliage age
classes. The combined data of Young (1981) and Briggs
(1982) (Table 5) showed an average of 76% (range 54–98%)
of the foliage being in the five youngest foliage age classes.
The effects of crown section on SLA were significant, but
data to test the influence of crown section on individual tree
PLA estimates were unavailable. We conclude that, to
deter-mine PLA, foliage samples should be collected from two to
three crown sections, with the number of crown sections being
dependent on tree height, and at least the five youngest foliage
age classes from each tree. Our results indicate that it is more
prudent to sample foliage extensively from many trees rather
than to sample foliage intensively from a few trees.
[image:6.612.54.282.341.674.2]Acknowledgments
Financial support for this project was provided by a grant from the Maine Agricultural and Forest Experiment Station to R.S. Seymour and by the University of Maine Cooperative Forestry Research Unit. Appreciation is extended to K.A. Brackley, N.A. Brackley, D.S.
[image:7.612.74.562.98.599.2]Campbell, M.E. Day, D.G. Ray and P.S. Sawyer, II for field and laboratory assistance. We gratefully acknowledge presubmission re-views by R.D. Briggs, R.C. Lemin, Jr., D.A. Maguire and A.S. White. Publication 1846 of the Maine Agricultural and Forest Experiment Station.
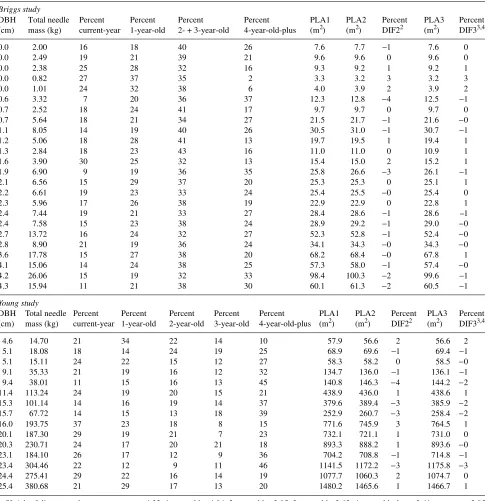
Table 5. Comparison of three methods to calculate projected leaf area using biomass data for Abies balsamea from Briggs (1982) and Young (1981)1.
Briggs study
DBH Total needle Percent Percent Percent Percent PLA1 PLA2 Percent PLA3 Percent (cm) mass (kg) current-year 1-year-old 2- + 3-year-old 4-year-old-plus (m2) (m2) DIF22 (m2) DIF33,4
0.0 2.00 16 18 40 26 7.6 7.7 −1 7.6 0
0.0 2.49 19 21 39 21 9.6 9.6 0 9.6 0
0.0 2.38 25 28 32 16 9.3 9.2 1 9.2 1
0.0 0.82 27 37 35 2 3.3 3.2 3 3.2 3
0.0 1.01 24 32 38 6 4.0 3.9 2 3.9 2
0.6 3.32 7 20 36 37 12.3 12.8 −4 12.5 −1
0.7 2.52 18 24 41 17 9.7 9.7 0 9.7 0
0.7 5.64 18 21 34 27 21.5 21.7 −1 21.6 −0
1.1 8.05 14 19 40 26 30.5 31.0 −1 30.7 −1
1.2 5.06 18 28 41 13 19.7 19.5 1 19.4 1
1.3 2.84 18 23 43 16 11.0 11.0 0 10.9 1
1.6 3.90 30 25 32 13 15.4 15.0 2 15.2 1
1.9 6.90 9 19 36 35 25.8 26.6 −3 26.1 −1
2.1 6.56 15 29 37 20 25.3 25.3 0 25.1 1
2.2 6.61 19 23 33 24 25.4 25.5 −0 25.4 0
2.3 5.96 17 26 38 19 22.9 22.9 0 22.8 1
2.4 7.44 19 21 33 27 28.4 28.6 −1 28.6 --1
2.4 7.58 15 23 38 24 28.9 29.2 −1 29.0 −0
2.7 13.72 16 24 32 27 52.3 52.8 −1 52.4 −0
2.8 8.90 21 19 36 24 34.1 34.3 −0 34.3 −0
3.6 17.78 15 27 38 20 68.2 68.4 −0 67.8 1
4.1 15.06 14 24 38 25 57.3 58.0 −1 57.4 −0
4.2 26.06 15 19 32 33 98.4 100.3 −2 99.6 −1
4.3 15.94 11 21 38 30 60.1 61.3 −2 60.5 −1
Young study
DBH Total needle Percent Percent Percent Percent Percent PLA1 PLA2 Percent PLA3 Percent (cm) mass (kg) current-year 1-year-old 2-year-old 3-year-old 4-year-old-plus (m2) (m2) DIF22 (m2) DIF33,4
4.6 14.70 21 34 22 14 10 57.9 56.6 2 56.6 2
5.1 18.08 18 14 24 19 25 68.9 69.6 −1 69.4 −1
5.1 15.11 24 22 15 12 27 58.3 58.2 0 58.5 −0
9.1 35.33 21 19 16 12 32 134.7 136.0 −1 136.1 −1
9.4 38.01 11 15 16 13 45 140.8 146.3 −4 144.2 −2
11.4 113.24 24 19 20 15 21 438.9 436.0 1 438.6 1
15.3 101.14 14 16 19 14 37 379.6 389.4 −3 385.9 −2
15.7 67.72 14 15 13 18 39 252.9 260.7 −3 258.4 −2
16.0 193.75 37 23 18 8 15 771.6 745.9 3 764.5 1
20.1 187.30 29 19 21 7 23 732.1 721.1 1 731.0 0
20.3 230.71 24 17 20 21 18 893.3 888.2 1 893.6 −0
23.1 184.10 26 17 12 9 36 704.2 708.8 −1 714.8 −1
23.4 304.46 22 12 9 11 46 1141.5 1172.2 −3 1175.8 −3
24.4 275.41 29 22 16 14 19 1077.7 1060.3 2 1074.7 0
25.4 380.68 21 29 17 13 20 1480.2 1465.6 1 1466.7 1
1 SLA by foliage age class: current-year = 4.32, 1-year-old = 4.04, 2-year-old = 3.85, 3-year-old = 3.63, 4-year-old-plus = 3.41, average = 3.85
m2k−1. Details of calculations are provided in text.
2 DIF2 = PLA1 − PLA2, ns. 3 DIF3 = PLA1 − PLA3, ns.
References
Baskerville, G.L. 1965. Dry matter production in immature balsam fir stands. For. Sci. Monogr. 9, 42 p.
Berlyn, G.P. and J.P. Miksche. 1976. Botanical microtechnique and cytochemistry. Iowa State Univ. Press, Ames, IA, 326 p. Briggs, R.D. 1982. The effects of fertilization on the nutrient
distribu-tion and biomass of the above-ground components of Abies bal-samea ((L.) Mill.). M.S. Thesis. State Univ. New York, Syracuse, NY, 160 p.
Briggs, R.D. and R.C. Lemin, Jr. 1992. Delineation of climatic regions in Maine. Can. J. For. Res. 22:801--811.
Canadian Soil Survey Committee. 1978. The Canadian system of soil classification. Can. Dept. Agric. Publ. 1646, Ottawa, Ontario, 164 p.
Clark, J. 1961. Photosynthesis and respiration in white spruce and balsam fir. Tech. Publ. 85, State Univ. Coll. For., Syracuse, NY, 72 p.
Coyea, M.R. and H.A. Margolis. 1992. Factors affecting the relation-ship between sapwood area and leaf area of balsam fir. Can. J. For. Res. 22:1684--1693.
Dallal, G.E. 1985. PC-EMS, A program to construct EMS tables. Version 1.0. USDA Human Nutrition Research Center on Aging, Tufts University, Boston.
Dean, T.J. and J.N. Long. 1986. Variation in sapwood area--leaf area relations within two stands of lodgepole pine. For. Sci. 32:749--758. Del Rio, E. and A. Berg. 1979. Specific leaf area of Douglas-fir production as affected by light and needle age. For. Sci. 25:183--186.
DeMaggio, A.E. 1966. Phloem differentiation: induced stimulation by gibberellic acid. Science 152:370--372.
Drew, A.P. and W.K. Ferrell. 1977. Morphological acclimation to light intensity in Douglas-fir seedlings. Can. J. Bot. 55:2033--2042. Elliot, J.H. 1937. The development of the vascular system in evergreen
leaves more than one year old. Ann. Bot. N.S. 1:107--127. Esau, K. 1965. Plant anatomy. 2nd Edn. John Wiley and Sons, New
York, 767 p.
Ewers, F.W. 1982a. Developmental and cytological evidence for mode of origin of secondary phloem in needle leaves of Pinus longaeva (bristlecone pine) and P. flexilis. Bot. Jahrb. Syst. 103:59--88. Ewers, F.W. 1982b. Secondary growth in needle leaves of Pinus
longaeva (bristlecone pine) and other conifers: quantitative data. Am. J. Bot. 69:1552--1559.
Ewers, F.W. and R. Aloni. 1985. Effects of applied auxin and gibberel-lin on phloem and xylem production in needle leaves of Pinus. Bot. Gaz. 146:466--471.
Ewers, F.W. and R. Aloni. 1987. Seasonal secondary growth in needle leaves of Pinus strobus and Pinus brutia. Am. J. Bot. 74:980--987. Ewers, F.W. and R. Schmid. 1981. Longevity of needle fascicles of
Pinus longaeva (bristlecone pine) and other North American pines. Oecologia 51:107--115.
Gholz, H.L., F.K. Fitz and R.H. Waring. 1976. Leaf area differences associated with old-growth forest communities in the western Ore-gon Cascades. Can. J. For. Res. 6:49--57.
Gower, S.T. and J.M. Norman. 1991. Rapid estimation of leaf area index in conifer and broad-leaf plantations. Ecology 72:1896--1900. Hager, H. and H. Sterba. 1985. Specific leaf area and needle weight of Norway spruce (Picea abies) in stands of different densities. Can. J. For. Res. 15:389--392.
Kaufmann, M.R. and C.A. Troendle. 1981. The relationship of leaf area and foliage biomass to sapwood conducting area in four subal-pine forest tree species. For. Sci. 27:477--482.
Keane, M.G. and G.F. Weetman. 1987. Leaf area--sapwood cross-sec-tional area relationships in repressed stands of lodgepole pine. Can. J. For. Res. 17:205--209.
Kellomäki, S. and P. Oker-Blom. 1981. Specific needle area of Scots pine and its dependence on light conditions inside the canopy. Silva Fenn. 15:190--198.
Kienholz, R. 1934. Leader, needle, cambial, and root growth in certain conifers and their interrelations. Bot. Gaz. 96:73--92.
Korstian, C.F. 1925. Some ecological effects of shading coniferous nursery stock. Ecology 6:48--51.
Kozlowski, T.T., P.J. Kramer and S.G. Pallardy. 1991. The physiologi-cal ecology of woody plants. Academic Press, New York, 657 p. Larsen, J.A. 1927. Relation of leaf structure of conifers to light and
moisture. Ecology 8:371--377.
Ledig, F.T. 1976. Physiological genetics, photosynthesis and growth models. In Tree Physiology and Yield Improvement. Eds. M.G.R. Cannell and F.T. Last. Academic Press, London, pp 21--54. Lewandowska, M. and P.G. Jarvis. 1977. Changes in chlorophyll and
carotenoid content, specific leaf area and dry weight fraction in Sitka spruce, in response to shading and season. New Phytol. 79:247--256.
Loach, K. and C.H.A. Little. 1973. Production, storage, and use of photosynthate during shoot elongation in balsam fir (Abies bal-samea). Can. J. Bot. 51:1161--1168.
Long, J.N. and F.W. Smith. 1989. Estimating leaf area of Abies lasiocarpa across ranges of stand density and site quality. Can. J. For. Res. 19:930--932.
Marchand, P.J. 1984. Sapwood area as an estimator of foliage biomass and projected leaf area for Abies balsamea and Picea rubens. Can. J. For. Res. 14:85--87.
Moir, W.H. and R. Francis. 1972. Foliage biomass and surface area in three Pinus contorta plots in Colorado. For. Sci. 18:41--45. Morgan, M.G., D.A. MacLean and H. Piene. 1983. Variation in balsam
fir needle length due to crown position, foliage age, and intertree differences. For. Sci. 29:412--422.
Morris, R.F. 1951. The effects of flowering on the foliage production and growth of balsam fir. For. Chron. 27:40--57.
Oren, R., E.-D. Schulze, R. Matyssek and R. Zimmermann 1986a. Estimating photosynthetic rate and annual carbon gain in conifers from specific leaf weight and leaf biomass. Oecologia 70:187--193. Oren, R., K.S. Werk and E.-D. Schulze. 1986b. Relationships between foliage and conducting xylem in Picea abies (L.) Karst. Trees 1:61--69.
Piene, H. and K.E. Percy. 1984. Changes in needle morphology, anatomy, and mineral content during the recovery of protected balsam fir trees initially defoliated by the spruce budworm. Can. J. For. Res. 14:238--245.
Rourke, R.V., J.A. Ferwerda and K.J. LaFlamme. 1978. The soils of Maine. Life Sci. and Agric. Exp. Sta. Misc. Rep. No. 203, Univ. of Maine, 37 p.
Shelburne, V.B., R.L. Hedden and R.M. Allen. 1993. The effects of site, stand density, and sapwood permeability on the relationship between leaf area and sapwood area in loblolly pine (Pinus taeda L.). For. Ecol. Manage. 58:193--209.
Smith, N.J. 1993. Estimating leaf area index and light extinction coefficients in stands of Douglas-fir (Pseudotsuga menziesii). Can. J. For. Res. 23:317--321.
Soil Survey Staff. 1990. Keys to soil taxonomy, 4th Edn. SMSS Tech. Monogr. No. 6, Blacksburg, VA, 422 p.
Tucker, G.F. and W.H. Emmingham. 1977. Morphological changes in leaves of residual western hemlock after clear and shelterwood cutting. For. Sci. 23:195--203.
van Hees, A.F.M. and H.H. Bartelink. 1993. Needle area relationships of Scots pine in the Netherlands. For. Ecol. Manage. 58:19--31. Waring, R.H., P.E. Schroeder and R. Oren. 1982. Application of the
pipe model theory to predict canopy leaf area. Can. J. For. Res. 12:556--560.
Whitehead, D. 1978. The estimation of foliage area from sapwood basal area in Scots pine. Forestry 51:137--149.
Wilkinson, L. 1990. SYSTAT: The system for statistics. SYSTAT Inc., Evanston, IL.