Artisanal Shrimp (Prawn) Fishery Value Chain
Assessment
Matarr Bah, James Tobey and Ousman Drammeh
Gambia-Senegal Sustainable Fisheries Program
(Ba Nafaa)
August, 2010
This publication is available electronically on the Coastal Resources Center’s website at
http://www.crc.uri.edu. For more information contact: Coastal Resources Center, University of Rhode Island, Narragansett Bay Campus, South Ferry Road, Narragansett, Rhode Island 02882, USA. Tel: 401) 874-6224; Fax: 401) 789-4670; Email: [email protected]
Citation: Matarr Bah, James Tobey and Ousman Drammeh, 2010, Artisanal Shrimp (Prawn) Fishery Value Chain Assessment, Coastal Resources Center, University of Rhode Island, pp.36.
Table of contents
1.0 Introduction... 5
1.1 Methodology... 5
2.0 Overview of the Shrimp Fishery in the National Context... 7
3.0 Artisanal Shrimp Fishery ... 10
3.1 Capture Methods ... 11
3.2 Social Profile of the Artisanal Shrimp Fishery... 12
3.3 Shrimp Fishery Management and Organization ... 15
4.0 Mapping the Shrimp Value Chain ... 17
4.1 Artisanal Shrimpers and Crew... 17
4.2 Shrimp Traders ... 19
4.3 Industrial Processing Plants and Exports... 20
Fig. 17. Pelican Seafood Company Production Process for Shrimp... 22
4.4 Finance in the Shrimp Value Chain... 23
5.0 Shrimp Fishing Costs and Earnings ... 23
5.1 Investment Costs ... 23
5.2 Variable Costs ... 25
5.3 Income ... 26
5.4 Maintenance and Repair ... 26
5.5 Remuneration Systems ... 27
5.6 Net Profit ... 27
5.7 Return on Investment... 28
6.0 Export Tax Concession and Investment Incentives ... 28
7.0 Recommendations... 28
8.0 References... 30
APPENDIX A: Questionnaire for The Gambia Shrimp Fisheries Value Chain Assessment ... 31
APPENDIX B: Calculation of the IRR (using Microsoft Excel IRR function)... 38
List of Figures
Fig. 1. Shrimp Value Chain Assessment, Selected Sample Sites ... 6Fig. 2. Focus Group ... 6
Fig. 3. Number of Artisanal Head Fisherman by Nationality (Countrywide)... 10
Fig. 4. Stow net diagram ... 11
Fig. 5.Stow net fishing methods(Source: Mbye, 2005) ... 11
Fig. 6. Diagram of drift gill net (fele-feleh) ... 12
Fig. 7. Ethnic Makeup of Shrimpers ... 13
Fig. 8. Nationality of Shrimpers... 13
Fig. 9. Educational Level of Shrimpers ... 14
Fig. 10. Other sources of Income for Shrimpers... 14
Fig. 11. Shrimp value chain:Production, trade, processing, and end markets ... 17
Fig. 12. Shrimp landing Site (Wharfi Njago)... 17
Fig. 13. Average Daily Shrimp Landings ... 18
Fig. 14. Average Daily Shrimp Sales Income... 18
Fig. 15. a. Shrimp retail shop (Bakau Town) b. Artisanal fish market c. Ice plant at Tanji beach ... 20
Fig. 16. Processed and packaged shrimp products (Pelican Sea Food Company)... 21
Table 1. Community, Location and Number of Respondents Selected ... 5
Table 2. Artisanal Shrimp Production... 8
Table 3. Fisheries Contribution to GDP... 9
Table 4. Social Profile of Shrimp Buyers and Sellers... 15
Table 5. Average Annual Shrimp Landings and Sales Income ... 18
Table 6. Average Annual By-catches from Shrimps landings and Sale (Dalasis) ... 19
Table 7. Distribution of Markets for Shrimp from The Gambia... 20
Table 8. Exports of Shrimp Products (2000-2006) ... 21
Table 9. Gambia Artisanal Fisheries Development Project Loan Scheme (2009)... 23
Table 10. Average Investment Cost and Characteristics of Different Fishing Canoe ... 24
Table 11. Average Investment Cost and Characteristics of Different Fishing Nets ... 24
Table 12. Equipment by Type of Canoe (Average depreciation cost) ... 24
Table 13. Average Investment Cost of Different Outboard Engines Used by Shrimpers ... 25
Table 14. Estimated Average Annual Depreciation Cost ... 25
Table 15. Daily Average Operating Cost in Dalasi... 26
Table 16. Average Annual Operating Cost in Dalasi... 26
Table 17. Average Annual Shrimp and By-catch Landings and Sales Income ... 26
Table 18. Routine maintenance of hull and engine per year... 27
List of Abbreviations and Acronyms
ADB African Development Bank
BADEA Arab Bank for Economic Development in Africa
CCLME Canary Current Large Marine Ecosystem
EEZ Exclusive Economic Zone
EU European Union
FAO United Nations Food and Agriculture Organization
GDP Gross Domestic Product
HACCP Hazards Analysis Critical Control Point
MOFWR & NAM Ministry of Fisheries, Water Resources and National Assembly Matters
MT Metric Tons
M Meters
SDF Social Development Funds
UNDP United Nations Development Programme
URI University of Rhode Island, USA
USAID United States Agency for International Development
VCA Value Chain Assessment
1.0 Introduction
The Government of The Gambia accords high priority to the development of the artisanal fisheries sub-sector because of its important role in providing much needed protein and employment opportunities, and to help reduce poverty, malnutrition and rural-urban migration.
The policy objectives of the fisheries sector are linked to key national development objectives as outlined in the Poverty Reduction Strategy Paper and the Gambia Incorporated Vision 2020, which are blueprints for eradication of poverty and the attainment of national social and economic development. National development objectives include increased food self-sufficiency and security; a healthy and productive population; enhanced employment opportunities for nationals; increased revenue generation and foreign exchange earnings; the attainment of national social and economic development; and the integration of women in the development process as equal beneficiaries and partners. The organization of fisherfolk communities into strong and viable interest groups and their active involvement and participation in all stages of the development process as equal partners and beneficiaries is key to the attainment of the sectoral policy objectives.
The purpose of this value chain assessment is to gain a better understanding of the artisanal shrimp fishery and to identify opportunities to improve cooperation and effectiveness across sub-sector participants in order to increase wealth and equity. The value chain approach helps to enhance the competitiveness of sectors, identify and understand both the major opportunities for upgrading and the driving constraints to market growth, and to generate recommendations for priority actions that can result in increased benefits for shrimp fishery sector participants.
1.1 Methodology
This VCA is prepared based on a literature review, a survey instrument applied to shrimp fishermen, Focus Group Discussions (FGD) and key informant discussions (see Appendix A). Stratified random sampling was used to ensure that shrimp fishers in the harvest and landing sites were equally represented in the survey. Fifty five (55) head shrimp fishers were interviewed at five of the major shrimp harvest and landing sites. Sixteen assistant shrimp fishers were also interviewed. The selected sites are the
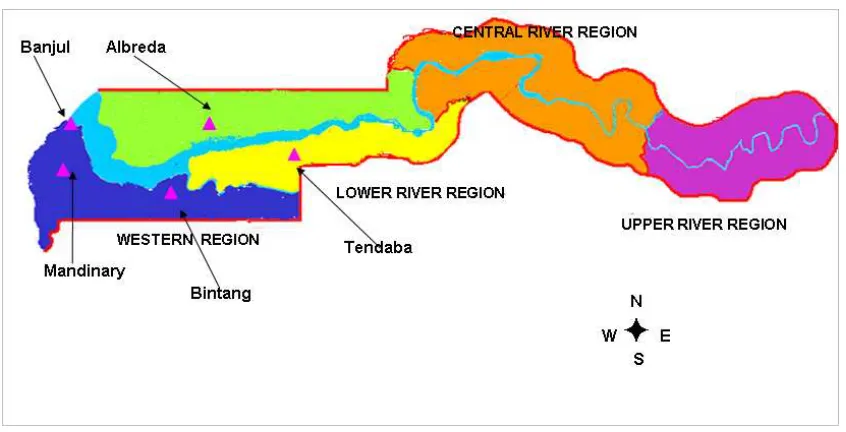
estuarine/riverine and brackish regime areas in and around Mandinary, Albreda, Bintang, Tendaba and Banjul. Fish traders and processors were also interviewed.
Table 1 lists the 5 landing sites where interviews with shrimp fishers were conducted and Figure 1 shows their geographic location.
Table 1. Community, Location and Number of Respondents Selected
Fig. 1. Shrimp Value Chain Assessment, Selected Sample Sites
All the selected study sites benefited from external donor development projects except Mandinary fishing village which has only a space for fish landing and has no other infrastructure. In the late 1980s, the Government of Italy provided grant aid to develop inland artisanal fisheries. Community Fisheries Centres were estasblished in Barra, Jurunku, Albreda and Salikene in the North Bank Division, and in Bintang, Kemoto, Tankular and Tendaba in the South Bank Division. The inland CFCs were smaller than the coastal CFCs and had fewer facilities but the CFCS of Barra and Bintang had small ice making plants of 1 ton production capacity per day.
Fig. 2. Focus Group
The questionnaire was designed to capture information in the following areas:
4. Harvesting equipment (boats, engines etc.)
5. Daily harvests, prices, markets, sharing systems, etc. 6. Shrimp traders (banabanas)
The survey instrument was pre-tested to detect inconsistencies and unclear language. It was then administered in the month of December 2009 to fishermen in privacy so as to reduce outside influence that might lead to bias of response. Callbacks were made on respondents who were not available during the first visit, giving a hundred percent completion rate. The study was conducted during the low shrimp fishing season, making field data collection difficult.
2.0 Overview of the Shrimp Fishery in the National Context
The Gambia with a population of 1.3 million, growing at an annual rate of 4.2 percent (estimated for 2003, Central Statistics Department), and a total area of 10,689 sq km is one of the most densely
populated countries in Sub-Saharan Africa. The country has a coastline of about 70 km, and 480 km along the banks of the River Gambia which divides the country into two (North Bank and South Bank). The Gambia is bordered on three sides by the Republic of Senegal and on the west by the Atlantic Ocean. The seas of The Gambia are located where two major oceanic currents converge along the coast of West Africa. One is the highly productive upwelling zone of the Canary Current Large Marine Ecosystem (CCLME). Cold and nutrient rich water flows southward starting from the seas of Mauritania and Senegal, attaining maximum effect on the Senegambia plateau in March/April. The other is the eastward-flowing warm Guinea Current. The effects of these currents together with the trade winds which blow dominantly from the Sahara Desert westerly out over the Atlantic create intermittent upwelling along the coast of The Gambia. These upwelling, combined with the huge annual influxes of nutrients from the Gambia River, fringed with mangroves on both sides up to hundred kilometers or more upstream, provide the nutrients that fuel a bountiful marine ecosystem.
The economy of The Gambia is predominantly agrarian, heavily dependent on the amount of rain falling during the wet season. After a series of droughts in the mid 1970’s and 1980’s, which resulted in a decline in agricultural production and animal husbandry, the Government of The Gambia took the decision to turn to other economic sectors, such as tourism and fisheries.
The territorial sea of The Gambia extends to 12 nautical miles with an Exclusive Economic Zone (EEZ) extending to 200 nautical miles. Under current provisions, only artisanal fishermen are allowed to operate within the first seven nautical miles of territorial waters. Only fishing vessels of 250 gross registered tons or less may operate between the 7-mile limit and a mile limit. There are no restrictions beyond the 12-mile limit (Fatajo and Bah, 2004).
An important feature of fisheries management in The Gambia is its bilateral agreement with Senegal. The Gambia and Senegal have had a bilateral agreement since 1982. Every 2 years it comes up for re-adoption (it is due for renegotiation in 2010). According to the agreement, artisanal fishers can fish in either country provided they abide by the laws of the country where they are fishing. For industrial fishing vessels there is a limit on the total maximum tonnage of fishing catch capacity but since The Gambia does not have an industrial fleet, only Senegal benefits from the reciprocal fishing agreement in terms of the industrial fishery.
The artisanal fishing sector is the dominant fishery in The Gambia. It is the major supplier of food fish for the Gambian population because of its affordability compared to meat protein, and a source of raw material (fish) for industrial and artisanal fish processing. Total fish landed from both the artisanal and industrial sub-sectors were estimated at nearly 40,000 tons in 2006 (FAO, 2007). Out of this, the artisanal fishery contributed approximately 37,000 tons (93%) with about 3,000 tons (7%) from the industrial fisheries. Of the 37,000 MT of artisanal fish production in 2006, 230 metric tons was shrimp, or less than 1% of total production. The industrial catch in Gambian waters in 2006 was 131 metric tons, or about 4.4% of the total industrial fishery production.
None of the industrial catch is landed in The Gambia, for lack of a suitable port. Catch data from foreign industrial fishing boats is collected by onboard vessel observers who are legally appointed by the Director of Fisheries under the Fisheries Act of 2007 (Sections 78, 79 and 80). The observers transmit daily (by radio) catch data to the Fisheries Department.
Table 2. Artisanal Shrimp Production
Table 3. Fisheries Contribution to GDP.
Year
Fish & Fishery Products (Metric Tons)
GDP
(Dalasis) % of GDP
1998 81,005 3,261,207 2.5%
1999 89,646 3,352,678 2.7%
2000 95,130 3,198,601 3.0%
2001 102,739 3,443,300 3.0%
2002 88,355 3,517,846 2.5%
2003 48,495 3,800,460 1.3%
2004 79,788 4,011,451 2.0%
2005 82,046 4,303,475 1.9%
2006 96,814 4,381,447 2.2%
(Source: Central Statistics Department Report, 2008)
The 2006 FRAME survey (Gambia DOF, 2006) results revealed that the artisanal fishery has a fleet of 1,785 canoes operating in both the marine and along the river Gambia, and that over 200,000 people depend directly or indirectly on artisanal fisheries and its related activities for their livelihoods. In addition to fishermen, fisheries sector participants include boat builders, fish processors, fish traders, and fish retail and wholesale buyers.
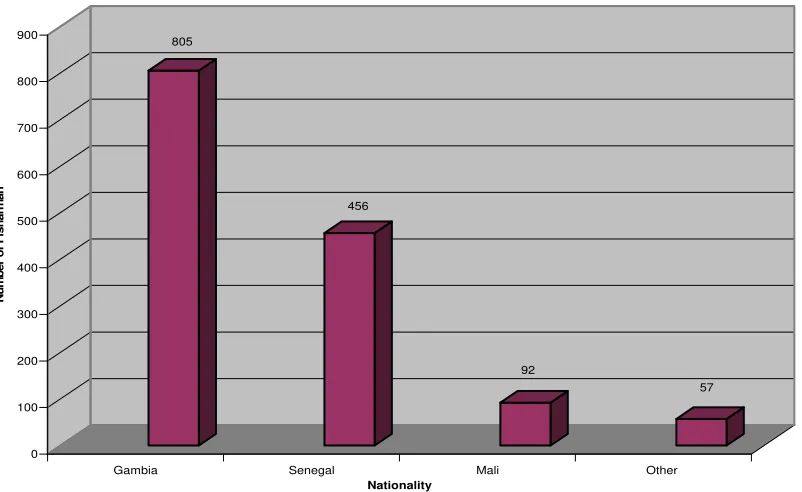
As shown in Figure 2 below, the sub-sector provides direct employment to 6,104 fishermen (1,410 head fishermen and 4,694 assistant fishermen). Out of the 1,410 head fishermen, 805 (57%) were Gambians and 605 foreigners (43%). However, foreign fishermen (mainly Senegalese) form the majority along the Atlantic coast which is the most productive area. Of the 416 head fishermen operating in the coastal area, 249 (60%) are foreign nationals compared to 167 (40%) Gambians. In the shrimp fishery, the present study identified a majority of Senegalese fishers (55% Senegalese vs. 36% Gambian among the shrimpers surveyed).
Of the 6,104 fishermen, the same FRAME survey identified 225 shrimp fishermen, or just fewer than 4% of the total number of fishermen. However, at the time of the FRAME survey, shrimp harvest and shrimp fishers were at a historic low (the year 2005). It is not known how many boats and shrimp fishermen there are now. A decade ago the FAO (2001) documented in The Gambia about 500 traditional dugout shrimp fishing boats measuring 3 to 4.5 m in length during the low season and about 1,000 boats during the peak season.
805
Fig. 3. Number of Artisanal Head Fisherman by Nationality (Countrywide) (Source: DOF Gambia, 2006)
3.0 Artisanal Shrimp Fishery
Shrimp are found in both maritime and brackish riverine waters, but the artisanal shrimp fishermen mainly operate in the estuary and tributaries within the brackish water regime. This fishery in The Gambia is relatively recent in development, starting in the early 1960s when fishing was conducted less than 5 m from the shore line at water depths not more than 1.3 m (Njai and Mendy, 2008).
Penaeus notialis (pink shrimp, known locally as Sipa Sipa) is the main target species of the artisanal fishery and is most abundant during the rainy season between July to September in the coast and estuary of The Gambia. The southern pink shrimp (Penaeus notialis) is found in the estuaries and coastal waters of West Africa from Mauritania to Angola, where it inhabits muddy as well as sandy bottoms at depths ranging from 2–100 m.
Another species of shrimp (Parapenaeus longirostris) is found in the deeper waters (100 to 400 m) and is targeted by large shrimp fishing vessels (more than 250 gross tons).
The shrimp stock found in the Gambia has its spawning grounds in the estuary/river. After hatching and metamorphosis to various larval stages in the river, juvenile shrimp migrate upstream in shallow areas of the river Gambia for feeding and growth in the nutrient-rich mangrove areas. After three months, adult shrimp migrate to sea and back for spawning in the central and deepest part of the estuary.
3.1 Capture Methods
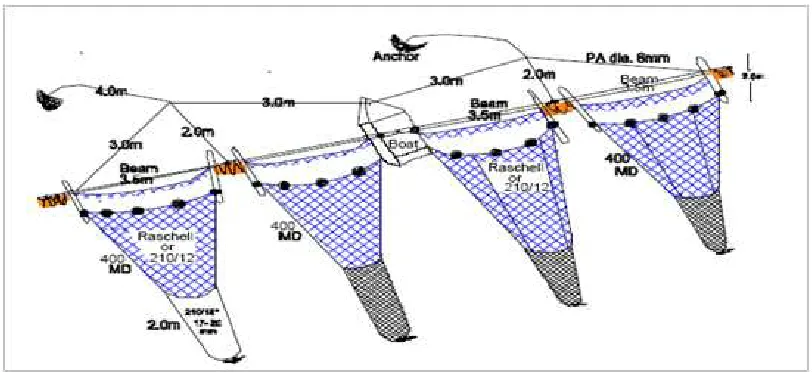
Artisanal Shrimp fishing is typically done with stow nets and shrimp drift gill nets (Figures 3 and 4). Stow nets locally know as Mujas are the main fishing gears employed in the estuary for shrimp fishing. A diverse assemblage of juvenile fish and small crustaceans are also captured as by-catch.
Fig. 4. Stow net diagram (Source: Mbye, 2005)
Fig. 5.Stow net fishing methods(Source: Mbye, 2005)
Specifications of the stow net are as follows:
• 25 mm minimum mesh size (Fisheries Regulations 1995)
• Total length between 10 and 14 m
• Netting material: Raschell (most common) and nylon knotted multifilament (210/12 for the belly and 210/18 for cod-ends)
• Colors: Blue, green (most common) and brown on the bellies and black on the cod-ends (fishermen preference)
Shrimp drift netting (fele-feleh) is a foreign fishing method from Mali and Senegal. The drift nets are attached to medium-sized boats which are allowed by fishermen to drift in the waters between the deeper channel and the more shallow parts of the river. The length ranges from 100-200 m long and 1-1.5 m wide (Figure 5). Drift nets are usually handled by three fishermen.
Fig. 6. Diagram of drift gill net (fele-feleh)
Specifications of shrimp drift gill nets are as follows:
• 25 mm mesh size
• Recommended length not to exceed 100 m. (120 to 140 m was in use before October 1st 2005)
• Maximum width allowed: 2.5 m
• Netting material is nylon either of 210/6, 210/9 or 210/12
• Color of netting is white (fishermen’s preference)
3.2 Social Profile of the Artisanal Shrimp Fishery
Head shrimpers, crew, and buyers and sellers were interviewed and information on social characteristics was collected such as nationality, ethnicity, education, age, sex, marital status, size of household, other occupations, and migration/resident status. All 55 head shrimpers and 16 crew members interviewed were male (Annex 1). The average age of shrimpers interviewed was 45 years and ranged from 23 to a
maximum of 67 years old. Average age of the crew (assistants) was 35 years old.
Fifty-two (95%) of the respondents were married, whereas 9 crew members (52%) were married. In terms of household, the average size was nearly 7 members per household, inclusive of the respondent. Four (7%) single households were recorded.
Percentage of Shrimpers Ethnic Groups Sampled
13%
18%
9% 45%
11% 4%
Mandinka
Serer Woloff Fula\Tukulor
Jola Other
Fig. 7. Ethnic Makeup of Shrimpers
The shrimpers surveyed were predominantly Senegalese (55%) and Gambian (36%) with the remainder from countries such as Mali and Guinea Bissau (as shown in Figure 14). Similarly, the nationality of the crews was predominantly Senegalese (50%), Gambian (38%) and other (12%) as shown in Figure 7 below
Total S hrimpers S ampled Nationalities in Percentage
36%
55% 9%
Gambian
Senegalese
Other
Fig. 8. Nationality of Shrimpers
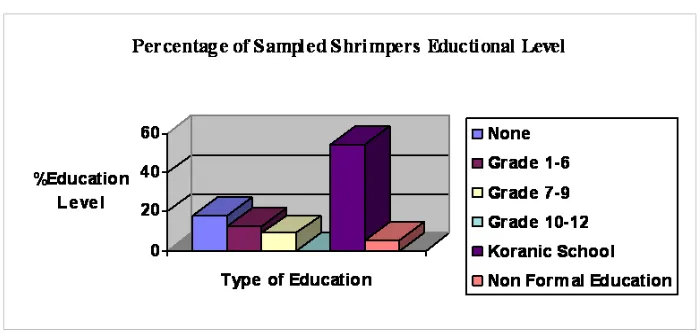
Fig. 9. Educational Level of Shrimpers
A majority of shrimpers in any particular site are non-resident; they are migrants following the movement of shrimp. Among head shrimpers 64% were migrants; among crew, 62% were migrants. Both shrimpers and crew are relatively stable, they all live in the same villages for an average of 18 years.
Generally, shrimpers come from rural backgrounds and are involved in other agricultural practices. As shown below in Figure 9, 24% of the respondents are involved in rice production, 12% are involved in horticulture production, and 8% in maize production. In terms of animal rearing, the percentage of respondents engaged in goat, cattle, sheep and poultry rearing was 16%, 12%, 20% and 8% respectively.
Fig. 10. Other sources of Income for Shrimpers
Table 4 shows socio-economic data on shrimp buyer and sellers. Out of the 16 shrimp buyers interviewed 10 were males and were 6 females. The average age of shrimp buyers was 35 years and ranged from 20 to a maximum of 50 years old. Out of 12 shrimp sellers interviewed 5 were male and 7 were female. Average age was 32 years and ranged from a minimum 18 years to a maximum of 45 years old.
Twelve (75%) of the buyers and four sellers (33%) were married. The Mandinka ethnic group of shrimp buyers was predominant (38%). Other represented groups were Woloff 25%, Sere 19%, Fula\Tukulor 12% and Jola 6%. As for the shrimp sellers sampled 42% were Wolof, 25% Mandinka, 17% Serre, 8% Fula\tukulor and 8% Jola.
Education attained by both shrimp buyers and sellers was low with a 13% and 8% illiteracy rate, respectively. Only 19% of shrimp buyers and 17% of shrimp sellers attained Grade 7-9.
Table 4. Social Profile of Shrimp Buyers and Sellers
Variable Buyers Sellers
3.3 Shrimp Fishery Management and Organization
General management measures that the Department of Fisheries has in place for the shrimp fishing industry are as follows:
• Mesh size (25 mm minimum)
• Prohibitions in the use of shrimp drift gill nets (fele-feleh) in the estuary
• Total length of the shrimp drift net must not exceed 100 m, and maximum depth of 2.5 m
• Stow net (mujass) mesh size (belly to cod-ends) must not be less than 25mm
• Stow net operator must not operate more than four nets (two pairs)
• All by-catches should be reported to the Fisheries Department for inspection
The Department of Fisheries encounters many challenges in monitoring and enforcing the above
top-down. Most artisanal fishery operators are found in remote areas along the river Gambia where they are not easily accessible.
Community-based management is also practiced in the shrimp fishery for informal rule making on user rights and conflict resolution. Regarding access to fishing grounds, limiting entry into the fishery, and the destructive nature of shrimp harvesting methods, it was observed that shrimpers do not favor measures from government or village authorities.
In most of the sites visited during the study, it was learned that stow nets are placed on either side of an anchor. This is an implicit claim to exclusive rights to the fishing grounds where the anchors are positioned, causing conflicts between the anchor owners and shrimp drift netters. Net entanglement of other fishers on the stow net anchors and stow nets is also a common cause of conflict.
All 55 shrimpers interviewed are in favor of the system of anchor rights. The majority of the respondents are also aware that these informal rights are not subject to any legal authority that could enforce
compliance. Disputes over anchor rights in almost all the sampled sites are arranged peacefully between shrimpers with the facilitation of the local shrimper association president. If that does not succeed, the dispute is taken to the Village Alkalos, District Chiefs, Regional Governors or the Department of Fisheries to resolve the conflict.
In all five shrimp landing sites surveyed, shrimpers were formally registered with Associations. The shrimp fishing association in the five sites selected for the study are listed below.
In Banjul (Wharfi Njago) the organization is legally registered with 40 members. Members pay a subscription in order to assist members in the case of loss of fishing gear, and ceremonial occurrences. The organization’s activities include regulating illegal, unreported and unregulated (IUU) shrimping and the use of small mesh sizes at cod-ends of their nets. Decisions regarding price negotiations of shrimp landings are set by the Executive of the Association.
In Mandinari, the Ladulabaa Fisheries Association of Mandinari is legally registered at the Attorney Generals’ Chambers with 10 members. Members pay a subscription and contributions are used as credit to assist members to buy fishing gear and make boat repairs. A new association was recently formed – Mandinari Shrimpers Association -- making two shrimpers’ associations in the Mandinari site.
Bintang Shrimpers Association is legally registered with 15 members and provides assistance in the form of credit for net replacement, engine repairs and also supports ceremonial events. The Association levies membership contributions to support its activities.
In Tendaba, the Chairman of the Shrimpers Association acts as an intermediary between the shrimpers and the processing factories. The Association has 30 members and participates in communal work in the village, contributing either cash or in kind. Tendaba is a major landing site but most of the fishers are migratory from proximate villages such as Kemoto, Salikene, etc.
In Albreda, the Shrimpers Organization is legally registered with 25 members and provides assistance to members who pay a subscription of 10 GMD weekly. The Organization has a formal structure comprising a President, Secretary, Organizer, Treasurer and Adviser, all of which have assistants.
4.0 Mapping the Shrimp Value Chain
As shown in Figure 10, the shrimp value chain involves a variety of boat types, traders,
processing plants and export and domestic markets.
Fig. 11. Shrimp value chain:Production, trade, processing, and end markets
4.1 Artisanal Shrimpers and Crew
Characteristics of the fishing season, fishing boats and methods, and social profile of shrimpers
were described earlier.
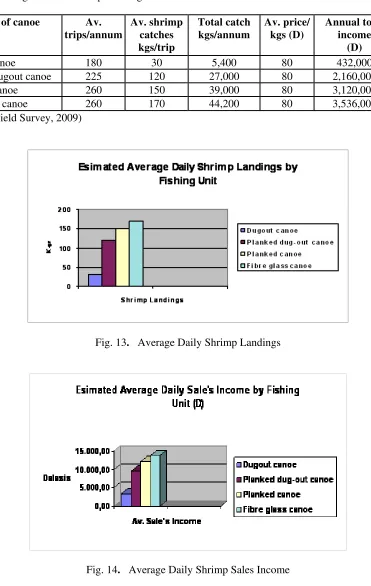
The number of trips and the average yearly landings and sales for the four types of fishing
canoes are shown in Table 5 and summarized in Figures 13 and 14. All boats make an average of
2 trips per day with the exception of dugout canoes that make one fishing trip per day. Later in
this report, the net income for owner and crew is estimated. It will be shown that the annual
income per crew member and owner net income are greatest on the fiberglass canoe, followed by
planked canoe, planked dugout canoe, and dugout canoe.
Table 5. Average Annual Shrimp Landings and Sales Income
Type of canoe Av.
trips/annum
Av. shrimp catches kgs/trip
Total catch kgs/annum
Av. price/ kgs (D)
Annual total income
(D)
Dugout canoe 180 30 5,400 80 432,000
Planked dugout canoe 225 120 27,000 80 2,160,000 Planked canoe 260 150 39,000 80 3,120,000 Fiberglass canoe 260 170 44,200 80 3,536,000 (Source: Field Survey, 2009)
Fig. 13. Average Daily Shrimp Landings
By-catch is also an important issue to mention. In terms of gross catch, it represents 5-10% of the catch. By-catch is not discarded, it is sold. Due to its low value, it represents only 1% or less of total catch income. Table 6 below shows the estimated average yearly by-catch sales income by the different fishing units.
Table 6. Average Annual By-catches from Shrimps landings and Sale (Dalasis)
Canoe Average
Shrimp fishing has been classified as a source of destruction to undersized fish resources. Fishing nets that use illegal mesh sizes of 17 to 20 mm on cod-ends, catch exceptionally large amounts of juvenile fish, affecting fish recruitment.
4.2 Shrimp Traders
There are a variety of buyers and sellers (traders) of shrimp. They include direct sale to processing plants by shrimpers themselves and representatives from the plants, family members of shrimp boat owners, banabanas, and retail and wholesale traders.
At landings sites immediately upon landings, sales are conducted by direct negotiation between shrimp boat owners or members of his family (usually wife) and the buyers. Prices of shrimp at landing sites fluctuate with shrimp supply and market conditions. At selected sites during the study, mixed shrimp (large and small sizes) caught were sold to traders (banabanas, retailers and wholesalers) at an average of 80 GMD\kilo. There is no auction and no collective selling. The types of buyers are as follows:
Self-employed middlemen, locally known as "banabanas", buy smaller quantities of mixed shrimps from fishermen at the landing beaches where they are transported for marketing by foot or on bicycles. The scope of operation of this category is usually 2 to 10 miles radius. They normally buy less than 200 kilos of mixed shrimp from fishermen at an average of 80 GMD\kilo (carried in boxes with ice) per trip. They sell the shrimp at an average of 150 GMD\kilo to the immediate environment, nearby towns and to individual consumers en route to the markets.
Retailers normally jointly hire vans or trucks to buy 2 to 3 metric tons of mixed shrimp at an average of 80 GMD\kilo (with ice) at the landing beaches and sell to processing plants, hotels, restaurants and individual consumers at an average of 150 GMD\kilo. Processing plants then add value to the product in the form of size sorting, peeling, packaging and freezing for sale to local hotels, restaurants and
Fig. 15. a. Shrimp retail shop (Bakau Town) b. Artisanal fish market c. Ice plant at Tanji beach
Wholesale traders buy 5 to10 metric tons at an average of 80 GMD\kilo of mixed shrimps from fishermen at landing beaches and sell to processing plants at an average of 150 GMD\kilo or export to Senegal at an average of 1,000 GMD\kilo (20,000 CFA).
4.3 Industrial Processing Plants and Exports
Fish processing plants in The Gambia in the past have been the primary destination for caught shrimp. The plants provide loans to fishermen in the form of fishing materials with an agreement that the most valuable categories of shrimp must be sold to the plant. Repayment is deducted from the catch on a daily basis. Almost 94% of the higher grades are processed and exported.
Until 2004, EU member countries were the major export market for Gambian shrimp products. From 2004 to 2006, 64 percent of shrimp products went to African countries including Senegal, Guinea, Ghana, Benin, Cameroon and South Africa with only 20 percent going to the EU, 10 percent to USA and 6 percent for local markets (hotels, restaurants, supermarkets and household buyers) (Table 7). Undersized shrimps are sold at a reasonable price to shrimp traders at the landing sites and eventually sold to local markets. The EU and USA receive most of the so-called high value shrimp or big size shrimps including the tiger shrimp (monodon). The tiger shrimp is not an indigenous species but was introduced in The Gambia by a fishing company for culture, processing and export. Some have escaped into the river and are now being caught along the coast and estuary.
Table 7. Distribution of Markets for Shrimp from The Gambia
Fig. 16. Processed and packaged shrimp products (Pelican Sea Food Company)
Processing plants in The Gambia compete with Senegal but are at a disadvantage due to inadequate product supply and higher costs. Critical cost components include electricity, other operational costs (e.g. fuel, cost of credit, and packaging materials), flight inconsistencies, and insufficient commercial shipping agencies.
Table 8. Exports of Shrimp Products (2000-2006)
Year Qty (kgs) Value (GMD) Value ($US)*
2000 308,002 11,672,401 $432,311
2001 336,224 16,514,111 $611,634
2002 141,894 4,453,860 $164,958
2003 97,762 2,956,532 $109,501
2004 76,193 1,970,253 $72,972
2005 88,226 2,332,411 $86,386
2006 58,551 4,962,228 $183,786
(Source: Statistics Unit, Fisheries Department) *Exchange rate: $US1 = 27 GMD
At the time of this study, Pelican Seafood Company was the only processing plant buying shrimp. The company employed forty-seven (47) people, out of which 15 are women (washing, sorting, peeling, etc) and 32 are men engaged in product collection at fish landing sites, unloading products at the factory, packaging, cold storage packing and loading for shipment. Although the company has its own shrimp collectors at some landing sites, Pelican Seafood also buys shrimp from banabanas.
Shrimp processing activities involved sorting, cleaning, peeling, chilling, freezing, portioning, packaging, labeling, and shipping (see Figure 13). Fresh shrimps to be processed are maintained chilled at all stages from capture, landings and processing. Hence an unbroken cold chain must be maintained during the production process aimed at attaining maximum product quality.
Production lines establish a consistent and uninterrupted flow of materials and shrimp products into final storage systems as fast as possible. Production lines have qualified supervisors and samples of raw materials and products are taken at intervals for inspection and analysis. Shrimp products final form includes whole, headless, head on and peeled. The finished products are packed in 1 or 2 kg boxes and later packed into 10-20 kg master cartons.
After meeting the requirements, an export permit, health certificate and catch certificate are issued to the exporter.
DOF is in the process of establishing its own fish and water quality inspection capacity. A laboratory structure has been built, but it is not yet equipped and operational. When ready, the capacity of the Department to inspect and certify fish products and exports will be greatly enhanced.
4.4 Finance in the Shrimp Value Chain
Shrimp value chain actors are highly dependent on credit through micro finance institutions, family members, friends, fish processing plants, and fish traders. Commercial banks and insurance companies do not offer loans and insurance coverage to artisanal fishermen due to the risks involved in artisanal capture fisheries and because fishing boats and equipment are not considered by commercial banks as collateral.
The Government of The Gambia obtained funds on credit from the African Development Bank and Arab Bank for Economic Development in Africa (ADB\BADEA) for the development of the artisanal fishery for a period of five years (2005-2010). The initiative is called the Gambia Artisanal Fisheries
Development Project (GAFDP). One of the critical areas of the project focused on credit. A revolving loan fund scheme for artisanal fisherfolks is provided through designated micro finance institutions such as the Social Development Fund (SDF) and Village Saving and Credit Associations (VISACAs). Money is provided to micro finance institutions at a rate of 14% and micro finance institutions lend to artisanal fisheries operators at 20%, gaining 6% to cover administration costs and other charges. The grace period of loans through this mechanism is three months, payable between one to three years depending on the amount of the loan.
As of 2009, some US$840 thousand had been disbursed under the project to 108 borrowers, for an average loan amount of US$7,783 (Table 9). It is not known how many of the borrowers are shrimp fishers.
Table 9. Gambia Artisanal Fisheries Development Project Loan Scheme (2009)
ITEMS Amount (dalasi)
Amount ($US)*
Loans Disbursed 22,696,076 $840,595 Total Loan Repayment 5,123,680 $189,766 Total Loans Outstanding 17,572,396 $650,829 Number of Beneficiaries 108
*$US1 = 27 Dalasi
(Source SDF First Quarterly Report on the Credit Fund (July-September, 2009))
5.0 Shrimp Fishing Costs and Earnings
5.1 Investment Costs
In order to estimate annual investment costs, a straight line depreciation of fishing equipment and material (canoe, engine, fishing gear) is applied. This underestimates actual costs since interest paid on financing costs are not considered. The study revealed that 45% of the fishing units sampled were financed by fish processing plants, and 18% by shrimp traders (banabana). Thirty-six percent of shrimp canoe and gear owners purchased their equipment themselves.
5.1.1 Average canoe cost
Table 10. Average Investment Cost and Characteristics of Different Fishing Canoe Used in Shrimp Fishing
Variable Dug-out Planked Planked Fiberglass
Canoe dugout Canoe Canoe
*Calculated as a proportion of boat owners in the sample that purchased new and used boats. For dug-out canoe, for example, 91% x 6,235 GMD + .09% x 2,184 GMD = 5,867 GMD.
5.1.2 Average cost of nets and other gear
The investment costs on gear depend on type, combination of fishing gear, size and materials. The prices of each specific gear type vary enormously (see Table 11).
Table 11. Average Investment Cost and Characteristics of Different Fishing Nets Used in
Average length (meters) 12 100 Estimated lifespan (years) 3 3 Average Cost of Nets (GMD) 10,500 8,650 Source: Field Survey, 2009
Average equipment requirements for shrimp boats are shown in Table 12.
Table 12. Equipment by Type of Canoe (Average depreciation cost)
Canoe Type Buoys (number) Anchors (number) Ropes (meters)
Dugout canoe 7 3.2 83
Planked dugout canoe 4.4 2 70
Planked canoe 3.75 1.75 56
Fiberglass canoe 2 1 37
Source: Field Survey, 2009
The cost of buoys was estimated at 80 GMD a piece and for anchors 250 GMD each, while the total per unit cost of ropes averaged 750 GMD. The estimated lifespan for buoys, anchors, and ropes averaged at 4, 5 and 3.5 years respectively.
5.1.3 Outboard engine
Table 13. Average Investment Cost of Different Outboard Engines Used by Shrimpers
As shown in Table 13 above, average cost of engine used by shrimpers ranges from 40,000 GMD for Yanmar 8HP, 60,000 GMD for Yamaha 15HP and 25,000 GMD for Suzuki 5HP.
5.1.4 Depreciation costs
As shown in Table 14, the annual cost of boat, engine and equipment are estimated by dividing the investment cost by the economic lifespan of the equipment. It is assumed that the residual value of the equipment is zero. This annual equipment cost represents depreciation of equipment.
Table 14. Estimated Average Annual Depreciation Cost 100 metre shrimp drift gillnet (fele-feleh) 3 8,650 2,883 (Source: Field Survey, 2009)
5.2 Variable Costs
The variable costs consist of expenditures incurred in the course of fishing operations. They depend on the type of boat and fishing effort, which determines the need for fuel, food, ice, bait, and small repairs.
In this study the variable costs are borne by the owner. The total sales income is considered as revenue to owner and the percentage share of sales income that the owner pays to the crew is considered as a variable cost of labor
Tables 15 and 16 below show the estimated daily and yearly operating costs for the different fishing units and makes it clear that, aside from the cost of labor, fuel is the most important operational cost. The planked canoe and fiberglass fishing units have the highest daily and yearly operating costs. A liter of pre-mixed fuel costs 30 GMD in January, 2010. A Yamaha 15 hp engine consumes 40 liters per fishing trip, whereas Suzuki 5 hp engine consumes 20 liters per fishing trip and a Yanmar 8 hp engine consumes 40 liters per fishing trip.
Table 15. Daily Average Operating Cost in Dalasi
Table 16. Average Annual Operating Cost in Dalasi
Variable Average operating
Planked dugout canoe 1,150 225 258,750
Planked canoe 1,800 260 468,000
Fiberglass canoe 2,000 260 520,000
(Source: Field Survey, 2009)
5.3 Income
Sales income is calculated by the product of shrimp and by-catches caught and their price paid by the buyer. Income from the sale of shrimp depends on the size of the catch, its composition and quality, the season, the demand, and the relationships with the trader. For these reasons, prices can vary significantly. Estimated average daily and annual sales income of the different fishing units for both shrimp and by-catch were shown earlier and are repeated here (Table 17).
Table 17. Average Annual Shrimp and By-catch Landings and Sales Income
Type of canoe Av.
5.4 Maintenance and Repair
Respondents had difficulty indicating the cost of maintenance and repairs. In this regard, the costs for maintenance and repair of the canoe, engine, and nets have been estimated at 10%, 15% and 20% respectively of their depreciation value.
part of the fishing net to allow continuous daily fishing operation. Therefore, after one year the whole net is replaced due to total destruction of the net.
Shrimp drift gill net fishers replace part of their nets each year. This replacement cost is considered as being part of the depreciation cost of the gear.
Annual maintenance and repair costs are shown in Table 18 below for the different fishing units.
Table 18. Routine maintenance of hull and engine per year
Type of canoe Gear (nets)
It was found that the system of sharing the divisible earnings was the same for each of the shrimp fishing canoes. For all four types of boat, the owner of the fishing equipment (canoe, engine and gear) receives 60% of the earnings as a remuneration of his capital, and the crews obtain the remaining 40% of the divisible earnings. The 40% is a fixed percentage of the income from sales, which means that it does not change with the number of crew members. Therefore, the fewer the crew members, the more each crew member will profit.
5.6 Net Profit
Table 19 calculates average annual net income to the shrimper (owner) and crew. Crew income is based on their share (40%) of the value of shrimp and by-catch harvested and sold divided by the number of crew members. The owner’s net income is based on the divisible earnings from shrimp harvest, less crew share, depreciation of equipment, maintenance and operating costs.
Table 19. Shrimp fishing net income
Variable Dug-out
Av. investment cost (boat, engine and net) (GMD) 16,367 43,234 60,230 80,983
Av. price/kilo (GMD) 80 80 80 80
Av. income from shrimp (GMD) 432,000 2,160,000 3,120,000 3,536,000 Av sales from by-catch (GMD) 9,000 22,500 13,000 39,000 Av. divisible earnings/net revenues (GMD) 396,000 1,923,750 2,665,000 3,055,000 Share crew (40%) 158,400 769,500 1,066,000 1,222,000
Crew size 2 4 6 6
Av. annual income of crew member (GMD) 79,200 192,375 177,667 203,667
Av. annual net income of crew member (US$)* $2,933 $7,125 $6,580 $7,543
Share owner (60%) 237,600 1,154,250 1,599,000 1,833,000 Av. annual operating costs (GMD) 45,000 258,750 468,000 520,000 Av. depreciation cost (GMD) 4,628 11,209 17,802 14,116 Av. routine maintenance of fishing units 700 1,075 1,327 1,452 Av. annual net profit of owner (GMD) 187,272 883,216 1,111,871 1,297,432
Av. annual net income of owner (US$)* $6,936 $32,711 $58,483 $48,053
5.7 Return on Investment
One way to compare capital investments is through the internal rate of return (IRR). Using Microsoft Excel to calculate IRR, the IRR for an investment in shrimp fishing for dug-out canoe, planked dugout, planked canoe, and fiberglass boat is 95%, 170%, 154%, and 134%, respectively. The numbers to calculate IRR are shown in Appendix B. The opportunity cost of capital can be defined as a certain percentage of the present value of the capital investment which an owner could have earned if the money were held in a savings account at a bank. In this case the return on capital investment in the shrimp fishing industry far exceeds the opportunity cost of capital.
6.0 Export Tax Concession and Investment Incentives
To encourage exports and further capital investment in export sectors, the government of The Gambia provides an export tax concession on shrimp and fish products. In addition, the Government of The Gambia maintains the following incentives to promote investment:
(a) Exemption from customs duties on approved capital equipment, machinery, appliances, and furniture and fittings as well as approved semi-finished products, spare parts, raw materials and other supplies used in the production process
(b) Exemption from the sales tax on the above mentioned imported goods
(c) Exemption from turn-over tax
(d) Preferential treatment for the allocation of land for the site of the proposed investment and government support of necessary infrastructure
7.0 Recommendations
1. The study indicated the existence of legally registered shrimpers organizations in all the sampled sites, but almost all of these associations have weak administrative and organizational structures, due to illiteracy or limited literacy. Capacity building is therefore recommended in the areas of resource management, financial management and the rules and regulations of the fishery. Training materials need to be provided in suitable text and local languages. Strengthened
Artisanal Operators Associations would be able to better coordinate the fishery and negotiate with fish traders (banabanas and processing plants).
2. The informal system of anchor rights by shrimpers causes conflict. It is therefore recommended that the Fisheries Department intervene to raise the awareness of operators on the 2007 Fisheries Act and use a co-management strategy to address the conflict.
3. Reduce post harvest losses and improve product quality through an enhanced cold chain (cold storage and transportation) and improved hygiene and sanitary practices. This will create the conditions to meet food safety requirements of international markets (e.g. HACCP requirements), and in particular, improve access to the European Union and U.S. markets.
4. Develop credit schemes for artisanal operators at low interest rates to avoid the disadvantage of borrowing from processing plants and fish traders.
6. Upgrade artisanal fish processing technology and promote the use of appropriate drying technology (drying racks)
8.0 References
Central Statistics Department Provisional Figures Population and Housing Census, 2003.
FAO (2007), National Fishery Sector Overview, Fishery Country Profile – The Gambia. Website: http://www.fao.org/fishery/countrysector/FI-CP_GM/en.
Fatajo Fafanding, and Matarr Bah (2004), Study to Determine and Analyze the Impact of Trade Policies on Fisheries Resources Management and Evolution of Cost and Earnings of Artisanal and Industrial Units Exploiting the Resources in The Gambia, Fisheries Department, The Gambia
Leendertse, Kees (1995), Management Aspects in Estuarine Shrimp Fishing in The River Gambia, FAO Field Document 5 No FI: DP/INT/91/007
Mbye, Ebou M. (2005), Dissertation (26 pages) on the Shrimp Fishery of The Gambia: A Case Study of Shrimp Fishing Gears. The United Nations University, 120 Reykjavik, Iceland.
Gambia DOF (2006), The 2006 Fishery FRAME Survey Report, Gambia Artisanal Fishery Development Project, Department of Fisheries, Department of State for Fisheries and Water Resources, Banjul, Gambia, 70 pp.
APPENDIX A: Questionnaire for The Gambia Shrimp Fisheries Value Chain Assessment
Part 1: Information on the Respondent
Fishing Unit Owner Fisherman\Shrimper
Trader\Middleman Crew Member
Buyer:-
Company Owner\Processor Restaurant Owner Hotel Manager Individual
4. Number of household members: ---
Number of dependent members: ---
Koranic school (Darah/Karanta) --- Non formal education--- None ---
8. Do you live in this village/town as full time resident? a) Yes ( ),
No ( ),
Part 2: Fishing Equipment Information
Fishing Unit Owner:………..
Fishing Site:………. Date:---
Type of Canoe Length of Canoe Total cost
Date & place of construction Outboard engine type Horsepower
Date and place of purchase Cost and source of funds Type(s) of fishing gear used Date and place of purchase Cost and source of funds Number of crews on board Share system (%)
--- --- --- --- --- --- --- --- --- --- --- ---
Part 3: Daily Catches of Shrimps
Daily average during different times off the year By-catches Catches given out to friends, relatives, etc.
Additional
How long have you been fishing?
How has shrimp abundance changed over this time?
When are shrimp most abundant?
Do you fish in only one location, or all over? Do you have formal or informal rights to those fishing grounds? Explain
Do you land at a CFC? Which?
What benefits do you get from the CFC? Are you a member of any CFC management committees?
What is the biggest problem facing the shrimp fishery?
What would you like to see changed?
Are there periods of time during the year that you do not fish?
During that time how do you provide for yourself and family?
Natural resource condition: how is the condition of the estuary, river, riverbanks, mangroves and forests?
Are they getting worse? Better? What are the main threats?
Are there conflicts in shrimp harvesting? With other shrimp fishers?
Part 4: Marketing and Distribution
Buyer :………
Site :……….…… Date:………
1. How often do you get your supplies?--- 2. Where do you get your supplies from?---
3. How much quantity of shrimp do you buy in a day? Quantity(kg) Value
11. Cost of transportation for marketing? D---
12. How much is the lowest price you sell your shrimp per kg? D--- 13. How much is the highest price you sell your shrimp per kg ?D--- 14. How long have you been a fish buyer/seller?... 15. Is buying and selling fish your only employment? ……… 16 What is the biggest challenge facing you in your job?... 17 What in your work would you like to see different in order to make you better off?
Part 5: Processing Plant
Name of Fishing Company:………
What is your position in the company (plant manager, owner, manager/owner)?…interview manager and/or owner
Fishing Site:……….…… Date:………
1. No. of Employees
currently, and if operating full capacity)
Gambians:……… Senegalese:……….. Non-Gambians:………..
Who owns the plant? Nationality of owner?... Where does the owner reside?...
2. On-Shore Facilities 3. Source of Shrimp supply
………. ……….
4. Processing Cost 5. Market Outlets
Av. Quantity (tons)
Av. Cost\ ton:……….. Domestic:………. Av. Wages\person (which? laborers/managers/accountants):……..…….. Export destination:………..
Av. Cost of Packaging Materials:………
How frequent do you export shrimps?...
6.Processing method . 7. Quantity Processed per week
……… ………
18. Does the company have staff who buy directly from fishers?
19. Do you have agreements with specific fish buyers to purchase shrimps? 20. How many? ………
21. How is the price that you buy from the buyers determined? ……… 22. What level of capacity are you operating at? ……… 23. Do you close during part of the year?...
24. What part of the year?...
25. Why do you close down? ………..
26. When closed do you still have costs to cover (security, maintenance, rental fees, etc) ……….……… 27. What type of arrangement do you have with the purchasing agent? ……… 28. Annual agreement to provide certain amount of fish? ……….. 28.1. Payment on arrival? ………. 28.2 Prepayment?... 29. What are insurance costs on the shipment?... 30. Do you have HAACP plan?... Describe it……… ………..……… 31. Has your plant ever been inspected by the Gambian government?... 32. What do you do with waste product? Where is it dumped?... 33. What is the percentage of processed/packaged fish to waste?... 34. Who makes contacts with foreign buyers and decisions on export strategy?... 35. Have you or the owners ever been to seafood trade shows?... 36. Do you think the jetty being constructed will help?... 37. What impact do you expect it will have on your sole product purchase price, on amount of product available, and on your profitability (revenues less costs)………. 38. How do you see the international market for seafood? ……… 39. Where do you see future opportunities for exports?... 40. Do you feel the shrimp fishery resources are well managed? ………. 40.1 Why or why not?...
41. What needs to be done to improve the fisheries sector?... 42. Over the years have you seen any changes in the abundance of fish product available to buy for processing?... 43. How do you get your information on global markets and fishing prices?
44. Why do you think Senegal is more cost competitive in seafood processing/exports than The Gambia? 45. Do you file income taxes?... How often? ………What percentage is tax on
income?...
46. Do you pay export taxes? ………What percentage of value of product?... 47. What are the 3 greatest challenges and do you have any ideas for how to resolve them?
……… ……… 48. Other buyers( restaurants and hotels)
48.1 How is price determined? ……….. 48.2 What much and how often do you buy?... 48.3 How do you buy (whole fresh, filets, on ice?)………
APPENDIX B: Calculation of the IRR (using Microsoft Excel IRR function)
Month
Dugout canoe (GMD)
Planked dugout canoe (GMD)
Planked canoe (GMD)
Fiberglass boat (GMD)
0 -16,367* -43,232* -60,230* -80,983*
1 15,606** 73,601** 92,656** 108,119**
2 15,606 73,601 92,656 108,119
3 15,606 73,601 92,656 108,119
4 15,606 73,601 92,656 108,119
5 15,606 73,601 92,656 108,119
6 15,606 73,601 92,656 108,119
7 15,606 73,601 92,656 108,119
8 15,606 73,601 92,656 108,119
9 15,606 73,601 92,656 108,119
10 15,606 73,601 92,656 108,119
11 15,606 73,601 92,656 108,119
12 15,606 73,601 92,656 108,119
IRR 95% 170% 154% 134%
*This is the initial cost of the business (boat, net, engine)