Universitas Indonesia
,
Center for Health Economics and Policy StudiesFinancing JKN: Where to
Go?
Hasbullah Thabrany
This is Happening
9/23/17 H Thabrany - HC reform 2
•
Ministry of
Finance: No
money, fiscal
inadequate,
control
expenditure
•
Ministry of Health:
too little money
•
Health care
providers: colonial
prices
•
Employers: burden
for our
competitiveness
•
Members/employe
es: poor JKN
Universitas Indonesia
,
Center for Health Economics and Policy StudiesHow Much to Spend?
•
How much Indonesian doctors’
made a month? May be IDR
2.5 – IDR 500 millions per
month.
•
Distribution?
•
Take a case – a general
practitioner managing 3,000
JKN members. Revenue = IDR
8,000 x 3,000 = IDR 24 M,
including drugs, investment,
office rent, salary for nurses,
etc.
•
Net Income? Compared to
income of BPJS or a bank
manager?
9/23/17 H Thabrany - HC reform 3
This news
creates
The Chronic Problems
•
There is no standard of acceptable market costs.
•
There is no standard of acceptable income for
health care professionals
•
THERE IS “standards” salary and perks for
construction, consultant, and state and central
banks
•
Poor mind set. Contribution of PBI IDR 23,000.
Contribution for high rank official, Jamkestama,
>IDR 1,700,000 per employees.
–
A decision made for “people” is different from a
decision made for government employees
Universitas Indonesia
,
Center for Health Economics and Policy StudiesFour Years Ago
•
I protested to the Minster of Finance because
he said “I
WANT
contribution of PBI IDR
10,000 per capita per month”. While a
government bank already spent IDR 330,000
per capita per month for its employee
•
I protested to an official in the Ministry of
Health who said “Impossible increase
contribution more than double”. I
SAID
, why
it is possible to increase remuneration of DG
of Tax more than tripple?
Why Insurance Mechanism?
•
MAIN requirement for insurance
mechanism, in contrast to tax funded
system, is ADEQUACY
•
Adequacy is calculated = Expected claim
costs (on average market costs/prices) +
Loading factors (administration).
9/23/17 H Thabrany - HC reform 6
BUT in reality; Contributions
are SET by POLITICAL or
PERCEPTION of High Rank
Government officials
BUT in reality; Contributions
are SET by POLITICAL or
Universitas Indonesia
,
Center for Health Economics and Policy StudiesThe Best Way
•
Find a standard/benchmark. A team of
experts, governments (multi sector),
professionals, and other stakeholders examine
thoroughly balance between Benefit Market
Costs and Ability of People to contribute.
•
There are potential fiscal spaces to be
mobilized. Thus, a political will is needed.
Ada
kemauan ada jalan.
•
Take Lessons from other countries. No need
foreign consultant. We could do it!!
9/23/17 8
Public Health Expenditures, %
THE,1995-2011.
Some Countries
19
95
19
96
19
97
19
98
19
99
20
00
20
01
20
02
20
03
20
04
20
05
20
06
20
07
20
08
20
09
20
10
20
11
20
30
40
50
60
70
80
High income Low income
Lower middle income Middle income
North America OECD members Thailand
Malaysia Indonesia
Sources:
World Bank, 2013
Hasbullah Thabrany
Universitas Indonesia
,
Center for Health Economics and Policy StudiesWe Have been Spending TOO LOW for
Health, NHA 2016
9/23/17 H Thabrany - HC reform 9
60
CHEPS UI | INDONESIA NHA TEAM
International Comparison
1. Total Health Expenditures of Selected Countries
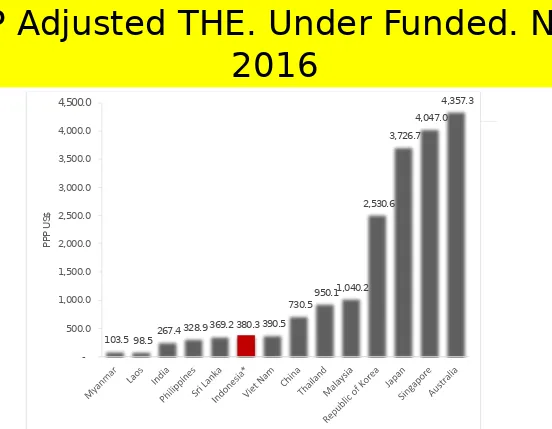
Total health expenditure (THE) and ratio of THE to GDP in 2014 was relatively low as compared to other countries in the Asia-Pacific region (Table 9). The ratio of Indonesia’s THE to GDP was at 3.6 percent, lower than many other developing countries, such as Viet Nam (7.1 percent) and Philippines (4.7 percent), even though Indonesia’s GDP per capita is higher than both of those countries. It was even much lower compared to the developed countries such as Australia (9.4 percent) and Japan (10.2) percent. It is expected that GDP per capita of a country reflects it’s the per capita health expenditure, the higher income of the country, the higher its health expenditure.
Table 9. GDP per Capita, THE Per-capita, and Share of THE to GDP in Selected Countries in the Asia-Pacific, 2014
Country GDP per Capita
(US$)
THE (US$ million) THE per Capita (US$)
THE as % of GDP
Myanmar 891.5 1,084.1 20.3 2.3
India 1,600.7 97,139.9 75.0 4.7
Laos 1,745.9 217.9 32.6 1.9
Viet Nam 2,014.7 13,158.7 142.4 7.1
Philippines 2,870.5 13,403.8 135.2 4.7
Sri Lanka 3,634.6 2,625.5 127.3 3.5
Indonesia 3,523.6 31,838.1 126.3 3.6
Thailand 5,519.4 24,407.3 360.4 6.5
China 7,565.2 574,799.0 419.7 5.5
Malaysia 10,933.5 13,630.1 455.8 4.2
Republic of Korea 27,942.7 103,989.1 2,060.2 7.4
Japan 36,201.4 470,671.7 3,703.0 10.2
Singapore 55,909.7 15,155.9 2,752.3 4.9
Australia 64,008.9 140,035.3 6,031.1 9.4
PPP Adjusted THE. Under Funded. NHA
2016
9/23/17 H Thabrany - HC reform 10
INDONESIA NATIONAL HEALTH ACCOUNTS 2014 | FINAL REPORT
61
Figure 42. Total Health Expenditure Per-capita by Purchasing Power Parity (US$) in Selected Countries within the Asia-Pacific, 2014
Source: WHO Global Health Expenditure Database - Table of key indicators, May 2016 *Indonesia National Health Accounts, updated May 2016
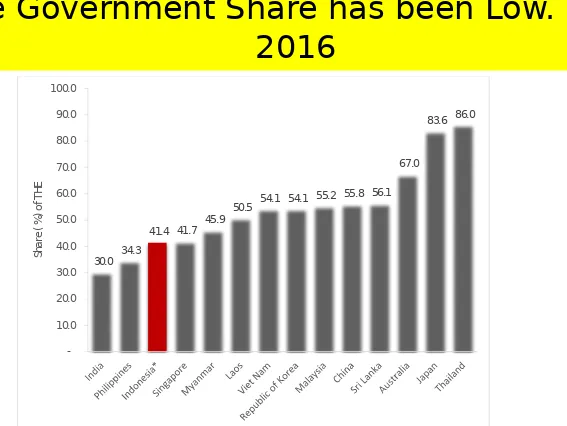
2. General Government Health Expenditures
The role of the government to support universal health coverage and financing health care is reflected by the share of government health expenditure (GGHE) as compared to total health expenditure of the country (Figure 43). The share of government spending in Indonesia tend to increase, reaching 41.4 percent from the total health expenditures in 2014. However, when compared internationally, GGHE Indonesia is still far behind Malaysia (55.2 percent), Japan (83.6 percent), and Thailand (86.0 percent), that have implemented universal health coverage.
103.5 98.5 267.4 328.9 369.2
Universitas Indonesia
,
Center for Health Economics and Policy Studies9/23/17 H Thabrany-CHEPS UI 11
Annual Health Expenditure per Capita USD,
1995-2011, Some Countries
19
95
19
96
19
97
19
98
19
99
20
00
20
01
20
02
20
03
20
04
20
05
20
06
20
07
20
08
20
09
20
10
20
11
0
50
100
150
200
250
300
350
400
Low income
Lower middle
income
Middle income
Thailand
Malaysia
Indonesia
Source: WB, 2013
2016
9/23/17 H Thabrany - HC reform 12
62
CHEPS UI | INDONESIA NHA TEAM
Figure 43. Share of General Government Health Expenditure (GGHE) of Total Health Expenditure (THE) of Selected Countries in the Asia-Pacific, 2014
Source: WHO Global Health Expenditure Database - Table of key indicators, May 2016 *Indonesia National Health Accounts, updated May 2016
3. OOP Health Expenditures
In 2014, OOP health expenditures per-capita in Indonesia was estimated to be at Rp678.8 thousand, with a share of 45.3 percent from total health expenditures (Figure 44), showing a decline of 3 percent from the previous year. Although the share of OOP in relation to THE has shown a decreasing trend over the years, Indonesia’s OOP figures are still considerably high when compared to Thailand (7.9 percent), Japan (13.9 percent), Australia (18.8 percent), and Malaysia (35.3 percent). The share of OOP spending to THE of Indonesia is only slightly better when compared Myanmar (50.7 percent) and Philippines (53.7 percent).
30.0 34.3
41.4 41.7 45.9
50.5 54.1 54.1 55.2 55.8 56.1 67.0
83.6 86.0
Universitas Indonesia
,
Center for Health Economics and Policy StudiesCurrently, UHC in Indonesia is
considered Inferior
165 million, 60%
14%
??%
Pop covered, %
S
er
vi
ce
s
co
ve
re
d
C
o
s
ts
c
o
v
e
re
d
,
O
O
P
9/23/17 H Thabrany -- Personal Views 13
HTA
Universitas Indonesia
,
Center for Health Economics and Policy StudiesThe JKN Contribution to the THE is still
Small. NHA 2016
9/23/17 H Thabrany - HC reform 14
INDONESIA NATIONAL HEALTH ACCOUNTS 2014 | FINAL REPORT
Table 3. CHE by Functions Based on SHA 2011 and SHA 1.0, 2014
Functions SHA 2011 SHA 1.0
In-patient curative care 37.9% 37.9%
Out-patient curative care 34.4% 28.6%
Services of rehabilitative care 0.2% 0.2%
Ancillary services to health care 3.5% 3.9%
Medical goods dispensed to out-patients 13.5% 19.1%
Prevention and public health services 6.6% 6.4%
Health administration and health insurance 3.9% 3.9%
Total 100.0% 100.0%
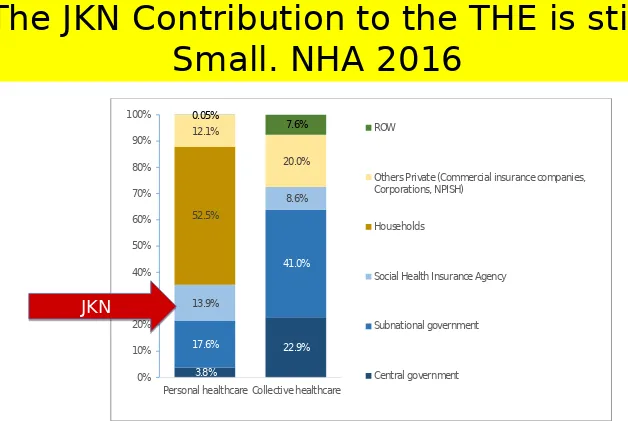
Spending by function in CHE and financing agent can also be analyzed using this SHA framework (figure 7). Approximately, 64.6 percent of personal healthcare spending was financed from private agents; reversely 72.5 percent of collective healthcare spending was from public agents. Personal health care covers inpatient, outpatient, rehabilitative and ancillary cares, drugs and medical goods, while collective healthcare covers preventive care and administrative management, system and health financing.
Figure 7. CHE and Function according to Healthcare Financing Agent, 2014
During 2010-2014, CHE by function using SHA 1.0 showed a different pattern as compared to figures using SHA 2011 classification, particularly function for administration, system, and health financing (table 4). Better process on data collection by involving stakeholders
52.5% 13.9% 8.6% 17.6% 41.0% 3.8% 22.9% 12.1% 20.0% 0.05% 7.6% 0% 10% 20% 30% 40% 50% 60% 70% 80% 90% 100%
Personal healthcare Collective healthcare
ROW
Others Private (Commercial insurance companies, Corporations, NPISH)
Households
Social Health Insurance Agency
Subnational government
Central government
JKN
Universitas Indonesia
,
Center for Health Economics and Policy StudiesConclusion
JKN and Public Health
Programs Have Been
Chronically Under Funded
Universitas Indonesia
,
Center for Health Economics and Policy StudiesThe Borobudur temple, built in the 9th century, was
constructed for long time; it last long!!!
Major Debates and Complaints will
still be Observed in the next 2-5 Years
before the JKN Reaches its Maturity
and Stability