EXTRACTION OF VINEYARDS OUT OF AERIAL ORTHO-IMAGE USING TEXTURE
INFORMATION
Arnaud LE BRIS
IGN, MATIS, 73 Avenue de Paris, 94160 SAINT-MANDE, FRANCE Universit´e Paris-Est
KEY WORDS:Classification - SIFT - Fourier - Semi-variogram - Vineyard - Land cover
ABSTRACT:
A cartography of vineyards is required by many mapping agencies, both to draw topographic maps and to complete the “vineyard” layer of large scale land cover databases. In this paper, two distinct approaches are proposed and tested to achieve a (semi-)automatic detection of vineyards task out of 50cm ground resolution ortho-images. Both are object based approaches relying on image texture analysis in homogeneous land cover regions. Therefore, the first step (common to both approaches) is a segmentation of the image into homogeneous land cover regions. These regions can then be classified as vineyards or not by the next approaches.
A first approach consists in a frequency analysis of the image texture in each region. A semi-variogram is first calculated from the ortho-image for each region of the segmentation. A Fourier transform (FFT) of this semi-variogram of the image is then considered. If a periodic signal with a high frequency (i.e. of which the frequency is upper than a threshold) is identified, the region is labelled as a vineyard.
The second approach is a supervised (per region) land cover classification one. It uses texture indexes calculated from ortho-images as input image information. In particular, some texture indexes derived from SIFT descriptors calculated from ortho-images have been used in the experiments, giving good results.
1 INTRODUCTION
1.1 Context
The French national mapping agency (IGN) is responsible for the production of several national geographic databases (including many topographic classes such as buildings, roads, forests, water system, cadastral parcels, ...) covering the whole French terri-tory. It also has to produce the national base map. Huge efforts have been made during the last decade to derive this map (almost completely) automatically from these digital databases. Never-theless some items still miss in the databases or exist but have not been updated for quite a long time, whereas they are necessary for the map to be drawn. For instance, the legend of the national base map includes a vineyard item, whereas this class is not com-pletely up-to-date on the whole territory. This updating task is indeed quite long and performed manually by operators, while this legend item is not considered among the most important for the quality of the map.
Furthermore, during forecoming years, a new national large scale land cover database will have to be plotted by IGN. The nomen-clature of this new database will also include a “vineyard” layer. Thus, in the future, the vineyards objects of the maps will be di-rectly drawn from this database.
As a consequence, there is a growing need for a new cartogra-phy of vineyards, and therefore for a new process to be able to produce it and then to update it.
1.2 Existing databases
However, several databases concerning vineyards produced by other authorities are already available. Such external sources could thus be used to help to produce the ”vineyards” layer of the future land cover database.
Nevertheless, all of them are different from what is required :
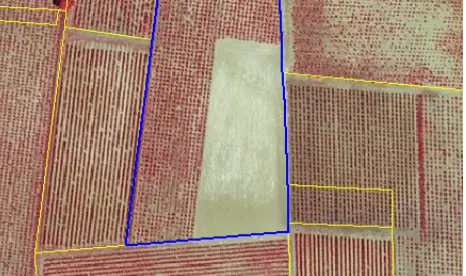
• On one hand, some of these databases are very exhaustive (in the sense that almost all cadastral parcels containing a vineyard part are present) but only mention the value of the area covered by vineyards per cadastral parcel. In these databases, vineyards are not precisely delineated among the parcels, as shown by fig. 1.
• On the other hand, other ones offer locally a very fine plot-ting of vineyards but are not exhaustive at all.
Figure 1: As in the blue parcel, vineyard objects are not precisely delineated in this database, although it is very exhaustive.
As a consequence, the required vineyard layer can not be auto-matically derived directly owing to a simple integration of these data sources (even for the most exhaustive among them). There-fore, vineyards will sometimes have to be extracted (at least man-ually and selectively to correct some mistakes) directly from aerial ortho-images to produce the “vineyard” layer of the national land cover database. Such a task should therefore be (at least partially) automated.
available external data sources. A possible way to achieve this can consist in comparing them to the result of an automatic de-tection of vineyards from aerial image data, or simply analysing indexes used by this detection method. Database parcels identi-fied as “not sure” would then be checked by operators.
Besides, some vineyard parcels can be missed even in the most exhaustive information sources and would be interesting to be de-tected (semi-)automatically out of aerial images.
As a consequence, there is a growing need for semi-automatic tools to detect vineyards out of aerial images.
Images used for this task would be 4 bands (red, green, blue and near infrared bands) 50cm ground resolution ortho-images of the national ortho-image database of IGN.
1.3 Difficulties
Several difficulties are encountered for this vineyard detection.
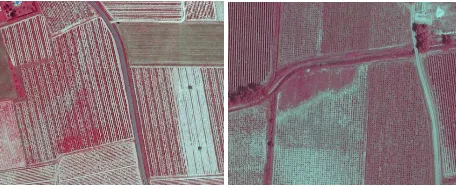
1.3.1 A varying appearance Vineyards can have a very dif-ferent appearance from one parcel to an other, as it can be seen on figure 2. This depends on various parameters, such as the age of the plants or the existence of several cultural methods :
• Vineyards have a more or less grassy ground : some of them have a bare ground, whereas other ones are covered by grass. Besides, this can vary inside a same parcel, probably de-pending on the quality and the moisture of the ground.
• The vineyard texture can be more or less pronounced, de-pending on the size (and the age) of the plants, and the fact they have more or less leafs.
• Some vineyards are cultivated by rows, whereas in other ones, vine plants are isolated. As a consequence, the tex-ture of these parcels varies from clearly linear to dotted, as on the second picture of figure 2.
• Other vineyards parcels consists in a succession of bands of grass and groups of rows of vine plants, presenting thus a “bar code” texture, as on the first picture of figure 2.
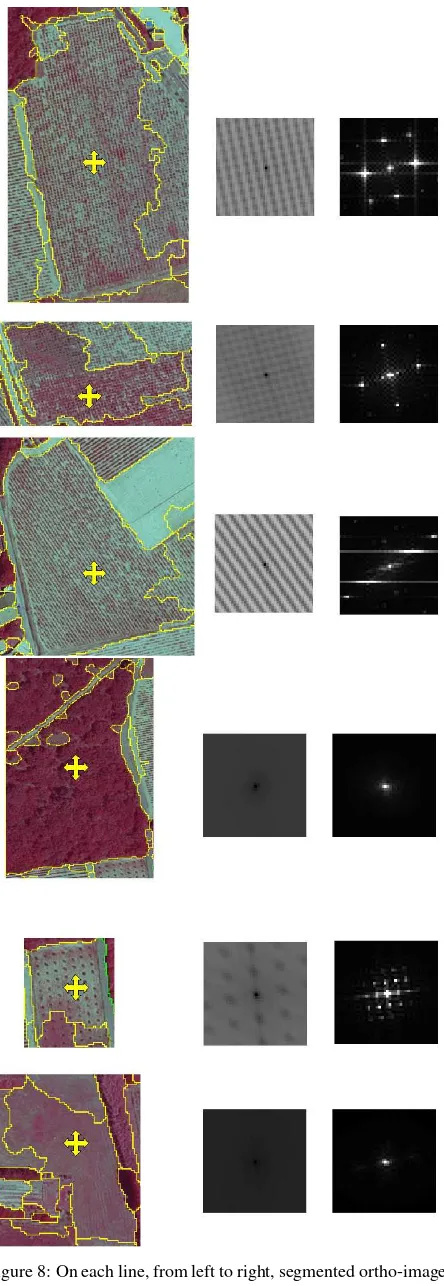
To sum it up, vineyards have a very varying appearance and pure radiometric information is not sufficient to discriminate them from other classes. However, in all cases, vineyards always have ahigh frequency periodic (quite linear) repetitive texture.
Figure 2: The appearance of vineyards varies.
1.3.2 Other periodic textured objects Nevertheless, vineyard is not the only land cover class with an almost repetitive structure. Other kinds of land cover can have a quite similar texture, leading to possible misclassifications.
Orchards also have a periodic (sometimes linear) texture but most of the time it has slightly lower frequency. (Inter-row spac-ing is more important and plants are larger.) Nevertheless, this also depends on cultural practises. There are even mixed vine-yard/orchard parcels alternating rows of vine plants and rows of fruit trees.
Tilled fields (and especially recently plowed ones) have also often a high frequency linear quite periodic texture, sometimes locally quite similar to the one of vineyards, but less pronounced. This will be an important cause of misclassification, especially on images captured in early spring, when vine plants are not fully grown and fields have just been tilled. Nevertheless, knowledge from external databases of section 1.2 could be an help to pre-vent them, some parcels being clearly identified as non vineyards ones.
1.4 Methodology
1.4.1 State-of-the-art The extraction of vineyards out of aerial or very high resolution satellite has been widely studied, and sev-eral approaches have already been proposed.
Some approaches are based on Fourier transform. For instance, in (Delenne et al., 2008) a Fourier transform of image parts is first computed. The peaks corresponding to vineyard parcels are then extracted in the Fourier space among the frequencies corre-sponding to suitable row spacing for this land cover class. Each detected peak is then modelled by a Gabor function and the im-age is convolved by this Gabor filter, revealing the corresponding vineyard as the part of the image having a strong answer (up to a threshold) to the filter. This method is interesting since it re-quires no previous segmentation of the image. In (Chanussot et al., 2005), some parameters (inter-row spacing, holes ...) are esti-mated from a Radon transform of the Fourier transform of crops of the image corresponding to vine parcels, but the context is dif-ferent from the one in this paper since detecting vineyards is not aimed at there and work is performed on higher resolution aerial images.
Other approaches are object ones (thus requiring a previous seg-mentation of the image) using semi-variograms. For instance, (Trias-Sanz, 2006b) first calculates the semi-variogram of each cadastral parcel, and then uses this information to estimate whether they have a periodic structure, and whether they correspond to vineyard or other land cover classes. (Balaguer et al., 2010) cal-culates the semi-variogram of each cadastral parcels and derives a set of features from it. These features are then used in a super-vised classification process.
Several approaches are based on classification using textural fea-tures. For instance, Haralick and morphological features are used to detect orchards in (Kupidura and Gwadera, 2010). A bank of Gabor filters can also be used.
Bag-of-word approaches used in (Lienou et al., 2010) to seman-tize lower resolution satellite images could also be used.
1.4.2 Proposed approaches In this paper, two distinct ap-proaches have been proposed and tested to achieve this semi-automatic detection of vineyards out of 50 cm ground resolution ortho-images from the national ortho-image database. Both are object based approaches relying on image texture analysis in ho-mogeneous land cover regions.Therefore, the first step (common to both approaches) is a segmentation of the image into homoge-neous land cover regions (and even more into regions having a homogeneous image texture). These regions can then be labelled as vineyards or not by the following approaches.
The second approach is a supervised (per region) land cover clas-sification one. It uses texture indexes calculated from ortho-images as input image information. In particular, some texture indexes derived from SIFT descriptors calculated from ortho-images have been used in the experiments, giving good results.
To sum it, the proposed process consists in the next steps : 1. Segmentthe ortho-image into homogeneous regions 2. Detectvineyards regions using both proposed approaches 3.(Optional :Mergeresults obtained by these two approaches) 4. (Optional : Post-process(delete too small regions, intersect with parcel identified as containing vineyards in existing databases, clean classification using other databases (roads, buildings, for-est,...), simplify contours of detected objects ...) )
2 SEGMENTATION
As both proposed approaches to detect vineyards from aerial im-ages are object based ones, the imim-ages have first to be segmented into homogeneous land cover regions (and even more into regions having a homogeneous image texture). The cadastral parcels can not be used directly as a segmentation because they can contain several distinct land cover classes. Therefore, this task is per-formed directly from image information using image segmenta-tion algorithms.
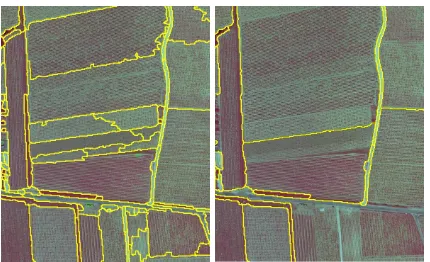
This is here achieved thanks to the multi-scale segmentation de-scribed in (Guigues et al., 2006). A pyramid of segmentations of the image is first computed from a watershed over segmentation. Each level of this pyramid corresponds to an alternative between detail and generalization. This pyramid is then cut at a level cho-sen to obtain a suitable image partition. This cut level is empiri-cally selected by the user by visual inspection on a small part of the data set area. It is a compromise between desired details and the size of regions which is not easy to set in the present context since on one hand, if this image is over segmented, some regions will be too small to have meaning and are at risk to be misclas-sified. Besides, on vineyard parcels, there is a risk to obtain one region per row of vine plants and one region per inter-row, mak-ing it impossible to extract vineyard by texture analysis of the regions. On the other hand, some regions of a too coarse segmen-tation include several distinct land cover classes. Furthermore, in the present case, it is even important to prevent to have regions containing only vineyards but with different texture parameters (orientation, “density”), making it difficult to extract vineyards by simply analysing these regions (e.g. on figure 3).
From a more operational point of view, a way to correct this pos-sible problem of too coarse segmentation could consist in using the cadastral parcels at the end of the segmentation process, to divide segmentation regions belonging to several parcels. Too small regions created by this operation are then merged to their neighbour with the longest common border.
In these experiments, segmentation has directly been processed on red-green-blue images.
3 FIRST APPROACH : “FREQUENCY ANALYSIS” 3.1 Definitions
Semi-variogram LetIbe anband image and letRbe a region of the segmentation of I.
An interesting information is the “mean” variation of the radiom-etry of the image for a 2D shift(a, b)inside the regionR. This value is obtained applying the next formula :
Figure 3: From left to right : example of a suitable and of a too coarse segmentation.
The functionVRis called thesemi-variogramof the imageI in-side the regionR. (Clark, 1979)
Fourier transform Letf be a 2D function and letF be the Fourier transform off:F =T F(f) (Fourier, 1822) :
The Fourier transform is a common tool to study the frequency and the behaviour of a periodic signal. Concerning implementa-tion, Fast Fourier Transform (FFT) algorithms of the FFTW li-brary ( (FFTW, last visited on the 16th of january 2012)) have been used int this study.
3.2 Proposed approach
The proposed method for vineyard detection consists of the fol-lowing steps :
1. Segmentthe image into (almost) homogeneous texture re-gions. (cf part 2)
2. Compute a vineyard indexfor each regionR
(a) Calculate the semi-variogramVR of the red band of the image in regionR
(b) Calculate the FFTT F(VR)of this semi-variogram (c) Analyse the modulus ofT F(VR): if a peak exists
for a frequency higher than a certain threshold, it cor-responds to a vineyard area. This is used to define a “vineyard index”, as explained below.
3. Detect vineyards by simply thresholding the “vineyard” indexpreviously obtained.
A “vineyard index” : Analysing the modulus of the Fourier transform of the semi-variogram of a region makes it possible to decide whether it is a vineyard area. It is also a way to identify the direction and the wave length (i.e. the inter-row spacing) of its oriented texture.
LetT F(VR) be the Fourier transform of the variogramVR of the image inside regionR. To detect only vineyards, only the existence of a peak in|T F(VR)|among frequencies correspond-ing to possible “vineyards” wave length (i.e. row spaccorrespond-ing) is checked. As|T F(VR)|is maximum in(0; 0), its second max-imum is sought, i.e.(ˆu; ˆv) =argmax(u;v)6=(0;0)|T F(VR)|.
The distance between(ˆu; ˆv)and(0; 0)is then calculated : this value√uˆ2+ ˆv2 is the “vineyard index” previously mentioned
Comments : Compared to other approaches based on Fourier transform, using the semi-variogram as an intermediate step is a way to use the information of the whole region whatever its shape. One the other hand, contrary to (Trias-Sanz, 2006b, Bal-aguer et al., 2010) who also use semi-variograms but try to clas-sify several classes, only vineyards are sought in this study. As a consequence, a more simple analysis simply using the Fourier transform is possible (to detect high frequency periodic texture).
Figure 4: “Vineyard” index computed from the left image.
4 SECOND APPROACH : CLASSIFICATION USING TEXTURAL FEATURES
The second approach consists in performing a per region classifi-cation of the image using an association of texture channels.
4.1 SIFT based features
SIFT based texture features have been tested, instead of well known image texture features such as Gabor filters and Haral-ick indexes.
SIFT (Scale Invariant Feature Transform) described with details in (Lowe, 2004) is both a multiscale keypoints detector (also known as DoG) and a keypoint descriptor used for point match-ing purposes. The SIFT descriptor describes the behaviour of the image in the neighbourhood of its associated keypoint. Thus, it is also a texture descriptor, which has already been used for re-mote sensing classification tasks such as in (Yang and Newsam, 2008).The standard SIFT scheme is described below :
1. Multiscale keypoints are detected in images.
2. An orientation is computed and assigned to each detected keypoint. (It corresponds to the main direction of pixel gra-dients in the neighbourhood of the keypoint).
3. A SIFT descriptor (relative to the orientation and scale of the keypoint) is then calculated for each detected keypoint.
Contrary to the standard SIFT pipeline presented above, descrip-tors are here calculated for a regular grid of points (i.e. the de-tector part is not used) at the image resolution (the multiscale aspect of SIFT is not used), since the interesting information for the present application is at the lowest level of the scale space.
SIFT descriptors are 128 dimensional vectors. This is quite im-portant and it is useful to reduce their dimensionality for the clas-sification task. Two strategies are possible to achieve this :
• A possible way is a bag-of-words one. N words are ex-tracted (by clustering) from the set of all keypoints, and dis-tances to these words are then studied.
• An other solution consists in performing a principal compo-nent analysis (PCA) of a set of SIFT descriptors. Only the firstNcomponents are kept.
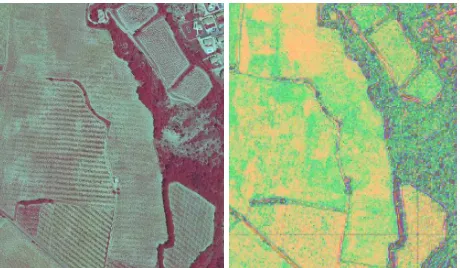
This second solution has been used here. Only the three first com-ponents of the PCA of SIFT descriptors are kept providing (after rasterization) images such as the one shown by figure 5. Exper-iments have then showed that the best classification results have been obtained using the second and the third of these channels.
Figure 5: The second image is a texture image obtained from SIFT descriptors extracted from the left image.
4.2 Classification algorithm
The regions of the segmentation are classified by theper region classification algorithms described in (Trias-Sanz, 2006a). This tool works in two steps :
1 - Model estimation from training data captured by an op-erator : first, for each class, the best parameters of several sta-tistical distributions (such as Gaussian, laplacian laws but also histograms (raw or obtained by kernel density estimation)...) are computed to fit to the radiometric n-dimensional histogram of the class (with n number of image derived channels used for the clas-sification). Then the best model is selected thanks to a Bayes Information Criterion enabling to choose an alternative between fit to data and model complexity.
2 - Classification : The image can then be classified according to the previously estimated statistical model of the radiometry of the different classes. Several per pixel and per region classifica-tion algorithms are proposed in (Trias-Sanz, 2006a) :
Maximum A Posteriori (MAP) andMaximum Likelihood(ML) per region classification algorithms : The labelco(R)given to a regionRis its most probable class according to the model previously estimated (and to prior probabilities). Hence, with the MLalgorithm,co(R)is the classcthat maximizes the following
function :Q
pixel s∈RPmodel(I(s)|c(s) =c) Card R1
with I(s) standing for the radiometry vector of pixel s, c(z)
meaning region or pixel “z’s class” andP(c(z) = c)standing for the probability for pixel or regionzto belong to classc.
Per region classification algorithms based on the comparison of distributions : The label given to a region is the class with the most similar model to the distribution of pixel values in the re-gion to be classified. Theχ2statistic and the Kullback-Leibler di-vergence (also called relative entropy) are two possible dissymi-larity coefficients that can be used to compare these distributions.
5 MERGE RESULTS
Results provided by the two approaches can be merged using the next strategy. First, intersection and union masks of objects de-tected by both approaches are computed. Secondly, too small elements of the intersection mask are deleted. Lastly, objects of the union mask are deleted if they don’t contain an object of the intersection mask. Remaining objects of this cleaned union mask are the final objects.
6 EXPERIMENTS AND RESULTS
The method has been tested on 2 datasets. Both consist of aerial 50 cm ground resolution ortho-images. Groundtruth data is not the same.
6.1 First data set
On this 242 km2 test area, images have been captured during summer time.
Results of the vineyard extraction processes have been compared to a groundtruth derived from cadastral parcels labelled by an op-erator into the following classes :
- more than 90% of the parcel covered by vineyard - from 50% to 90% of the parcel covered by vineyard - from 10% to 50% of the parcel covered by vineyard - less than 10% of the parcel covered by vineyard - no vineyard on the parcel
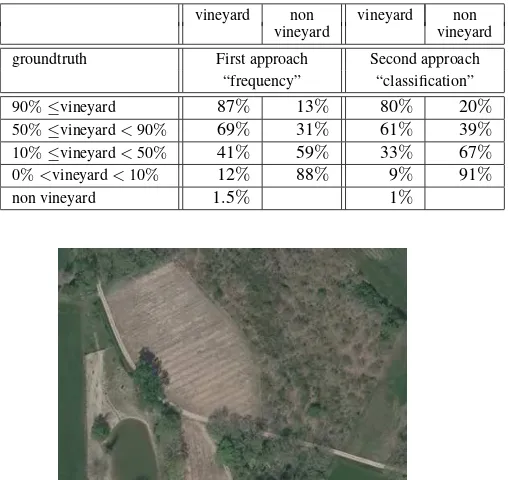
“Confusion matrices” (see table 1) have then been calculated. For both methods, the percentage of detected vineyard among the different categories of labelled parcels is coherent to what could be expected. The vineyards are globally retrieved (see fig. 7). Nevertheless, some parcels have been forgotten (especially the ones with a “bar code” texture previously mentioned). On the opposite, some orchards or tilled field areas have also been de-tected as vineyards.
Most of the time, detected vineyard areas have a more precise delineation than the cadastral parcel. However, their border can also sometimes be irregular.
6.2 Second data set
This second data set covers a 400 km2 and includes a true for evaluation, since vine areas have already been plotted by an op-erator there.
Nevertheless, aerial images have been captured in early spring and vegetation was not fully grown (as on fig. 6), making it dif-ficult in some parts to see rows of vine plants. Besides, many fields have also just been tilled. As a consequence, vineyards are often difficult to discriminate from these other classes (even for a human being) leading to many misclassifications. Therefore, obtained results are not so good than for the previous data set. 63% of the groundtruth vine area is detected by the “frequency analysis” method, but 42% of the area of detected vineyards is over-detection.
75% of the groundtruth vine area is detected by the “classifica-tion” approach (using the ML algorithm), but 39% of the area of detected vineyards is over-detection.
Merging these results leads to an improvement since 75% of vine-yard area is detected and over-detection only concerns 35% of the detected vineyard area.
7 CONCLUSION
To sum it up, obtained results are not perfect (most of all for the second data set) but remain very encouraging, especially in
Table 1: First data set : results of the approaches “frequency anal-ysis” and “classification” (using per region maximum likelihood classification algorithm applied to SIFT based texture indexes)
vineyard non vineyard non vineyard vineyard
groundtruth First approach Second approach “frequency” “classification”
90%≤vineyard 87% 13% 80% 20%
50%≤vineyard<90% 69% 31% 61% 39%
10%≤vineyard<50% 41% 59% 33% 67%
0%<vineyard<10% 12% 88% 9% 91%
non vineyard 1.5% 1%
Figure 6: Second data set : example of vineyard where plants are not fully grown, making it difficult to be detected
this specific context where additional information (such as exter-nal databases concerning vineyards or other land cover items re available) could be used to prevent over-detection and to clean the detection results. (Such information has not been used in the previous experiments.) Work could now be done to :
• improve the first approach, to try to better discriminate vine-yards from tilled fields, using a complementary index de-rived from the Fourier transform of the semi-variogram, to measure to what extent a texture is “pronounced”.
• merge the results, using directly confidence indexes given by the two approaches
• improve the quality of the border of detected vineyards (mak-ing them be less noisy), for instance us(mak-ing an approach sim-ilar to the one of (Delenne et al., 2008). From the previous frequency analysis, the best parameters for a Gabor function are estimated to describe the region identified as vineyard. The contour of this region could then be fit (using for in-stance an active contour model) to the result of the convolu-tion of the image with this Gabor funcconvolu-tion.
ACKNOWLEDGEMENTS
Thanks to C. Mohsen (IGN/SBV) for having prepared datasets and evaluation.
REFERENCES
Figure 7: First data set : results of the approaches “frequency analysis” (top) and “classification” (bottom) using per region ML classification algorithm applied to SIFT based texture indexes
Chanussot, J., Bas, P. and Bombrun, L., 2005. Airborne remote sensing of vineyards for the detection of dead vine trees. In: Proc. of the IEEE International Geoscience And Remote Sensing Sym-posium (IGARSS’05), Seoul, Korea.
Clark, I., 1979. Practical Geostatistics. Elsevier applied science, London. UK.
Delenne, C., Rabatel, G. and Deshayes, M., 2008. An automa-tized frequency analysis for vine plot detection and delineation in remote sensing. IEEE Geoscience and Remote Sensing Letters 5(3), pp. 341 – 345.
FFTW, last visited on the 16th of january 2012. Fastest Fourier Transform in the West (FFTW). http://www.fftw.org/.
Fourier, J., 1822. Th´eorie analytique de la chaleur. Firmin Didot, p`ere et fils.
Guigues, L., Cocquerez, J.-P. and Le Men, H., 2006. Scale sets image analysis. International Journal of Computer Vision 68(3), pp. 289–317.
Kupidura, P. and Gwadera, L., 2010. Comparison of different ap-proaches to extract heterogeneous objects from an image using an orchards example. The International Archives of the Photogram-metry, Remote Sensing and Spatial Information Sciences 38 (Part 3B), pp. 13–18.
Lienou, M., Datcu, M. and Maˆıtre, H., 2010. Semantic anno-tation of satellite images using latent dirichlet allocation. IEEE Geoscience and Remote Sensing Letters 7(1), pp. 28 – 32.
Lowe, D. G., 2004. Distinctive image features from scale-invariant keypoints. International Journal of Computer Vision 60(2), pp. 91–110.
Trias-Sanz, R., 2006a. Semi-automatic high-resolution rural land cover classification. PhD thesis, Universit´e Paris 5, Paris, France.
Trias-Sanz, R., 2006b. A texture orientation and period estimator for discriminating between forests, orchards, vineyards, and tilled fields. IEEE Transactions on Geoscience and Remote Sensing 44(10), pp. 2755–2760.
Yang, Y. and Newsam, S., 2008. Comparing SIFT descriptors and gabor texture features for classification of remote sensed imagery. In: Proc. of the 15th IEEE International Conference on Image Processing, San Diego, USA, pp. 1852–1855.