Sign In
SearchGXP
Sampling by Attributes Using the ANSI/ASQ Z1.4-2008 Standard | IVT
By Eugenie Webster (Khlebnikova) Nov 24, 2013 12:39 pm PST
Peer Reviewed: Sampling
The views and opinions expressed in this paper are those of the individual author and should not be attributed to any company with which the author is now or has been employed or affiliated.
Abstract
This paper discusses the application of American National Standards Institute ”ANSI)/American Society for Quality ”ASQ) Z1.4-2008: Sampling Procedures and Tables for Inspection by Attributes. It provides simple instructions on how to correctly select the sampling plan based on the population size and the acceptable risk. In addition, this paper provides a general overview of statistics behind the development of sampling plans. The intent of this paper is to present a quick refresher on sampling by attributes using the ANSI/ASQ Z1.4 2008 standard and to educate a reader on the common mistakes users make during the use of this standard.
Introduction
Attribute sampling plans are often used to inspect the effectiveness of the product/process and to determine the rate of compliance with established criteria. It is a common pharmaceutical industry practice to employ American National Standards Institute ”ANSI)/American Society for Quality ”ASQ) Z1.4-2008: Sampling Procedures and Tables for Inspection by Attributes for inspection of product/process defects. ANSI/ASQ Z1.4-2008: Sampling Procedures and Tables for Inspectionby Attributes is an acceptance sampling system that provides tightened, normal, and reduced plans to be applied for attributes inspection for percent nonconforming or nonconformities per 100 units. The use of sampling tables provides a quicker way of selecting the sampling plan instead of developing a sampling plan using complex statistics. The standard provides instructions on how it is supposed to be applied; however, it is often misinterpreted. The common mistakes include, but not are limited to, the selection of incorrect sampling size, selection of incorrect acceptance criteria, or attribute plan used for variable data, etc. Therefore, it is very important to properly interpret the standard and apply the inspection rules as they are prescribed. Incorrect application can result in regulatory observations.
The Importance of Sampling
Sampling is a regulatory requirement in the pharmaceutical industry. The current good manufacturing practice ”cGMP) requires sampling plans to be defined as well as samples to be representative of the population and based on appropriate statistical criteria. For instance, as per Code of Federal Regulations Title (CFR) 21Part211.165”d), Acceptance criteria for the sampling and testing conducted by the quality control unit shall be adequate to assure that batches of drug products meet each appropriate specification and appropriate statistical quality control criteria as a condition for their approval and release. The statistical quality control criteria shall include appropriate acceptance levels and/or appropriate rejection levels. Acceptance inspection is performed at many stages in the pharmaceutical process, from testing raw materials to the final packaging stage. Acceptance testing is necessary since 100% inspection is not practical and would be very costly. In acceptance testing by attributes, a sample is randomly taken and inspected against established specifications ”allowable number of defects). If the number of defects exceeds the allowable number of defects, then the entire lot is rejected.
ANSI/ASQ Z1.4-2008
Sampling For Attributes
ANSI/ASQ Z1.4-2008: Sampling Procedures and Tables for Inspection by Attributes is one of the most frequently used plans by many pharmaceutical companies as well as other industries. It is recognized by the US Food and Drug Administration and Health Canada. The standard provides various inspection plans without getting into complex statistics.
The standard is intended for inspection of final product, components and raw materials, materials in process, and data and records.
characteristic). The standard was cancelled in 1995 but the content was adopted by ANSI/ASQ Z1.4-2008: Sampling Procedures and Tables for Inspection by Attributes.
The Z1.4 provides acceptance sampling tables based on the acceptable quality level ”AQL) designation that is generally specified in the company standard operating procedure ”SOP). Different AQLs may be designated for different types of defects ”critical, major, and minor). AQL is defined as the maximum percent defective ”or the maximum number of defects per hundred units) that, for purposes of sampling inspection, can be considered satisfactory as a process average.
Inspection Level
The inspection level determines how the lot size and the sample size are related. The standard divides inspection levels into two main categories: special inspection levels ”S-1, S-2, S-3, and S-4) and general inspection levels ”I, II, III). According to the standard, inspection Level II should be used unless otherwise specified. The sampling acceptance criteria discrimination increases from special levels to general levels with Level III having the greatest discrimination. Special levels shall be used when relatively small sample sizes are required and large sampling risks can be tolerated.
Inspection Rules
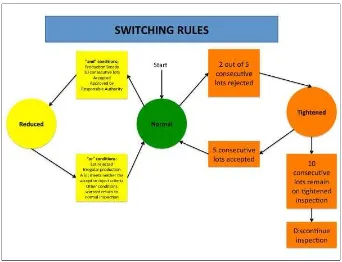
Provisions for each sampling plan include normal, tightened, or reduced inspection. Normal inspection should always be conducted at the start of inspection. When normal inspection is applied, tightened inspection can be implemented when two out of five or fewer consecutive lots failed normal inspection. When tightened inspection is applied, normal inspection can be implemented when five consecutive lots pass the tightened inspection. The reduced inspection can be used conditionally when the normal inspection passes for more than two consecutive lots. Inspection can be discontinued when 10 consecutive lots remain on tightened inspection. The switching rule diagram is provided below.
Figure 1: Switching Inspection Rules.
Sampling Plan Types
Three types of sampling plans are provided: single, double, or multiple. Figure 2 outlines the differences of each plan.
Figure 2: Types of Sampling Plans.
Single Sampling Plan Double Sampling Plan Multiple Sampling Plan
sample. A new Accept/Reject level number is determined with the second sampling. At the end of the second sample the lot is then either accepted or rejected.
accept the lot. However, if there are rejects, then multiple sampling plans become very complicated.
Inspection Procedure
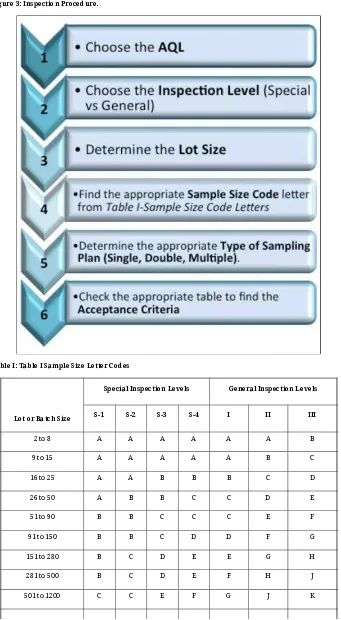
The general procedure ”Figure 3) in designing the sampling plan is the following.
Figure 3: Inspection Procedure.
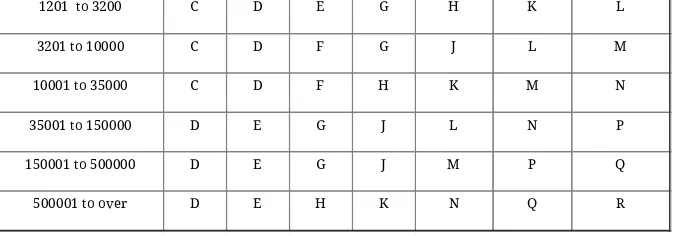
Table I: Table I Sample Size Letter Codes
Lot or Batch Size
Special Inspection Levels General Inspection Levels
S-1 S-2 S-3 S-4 I II III
1201 to 3200 C D E G H K L 3201 to 10000 C D F G J L M 10001 to 35000 C D F H K M N 35001 to 150000 D E G J L N P 150001 to 500000 D E G J M P Q 500001 to over D E H K N Q R
Table II: Table II – Single Sampling Plans for Tightened Inspection
Note: Use ↓ first sampling plan below arrow. If sample size equals or exceeds lot or batch size, do 100% inspection.
Ac = Acceptance Number Re = Rejection Number
Caution: Note, the sampling plan consists of a sample size and acceptance criteria at particular AQL. It is common to select one or another; however, this application of the sampling procedure is incorrect. The correct use of these tables is discussed further.
Application of a Single Sampling Plan for Packaging Defects
An example of the application of ANSI sampling is the inspection of packaging defects. The packaging defects can be classified into three major categories: critical, major, and minor. Defect categories are divided based on criticality to product quality attributes. Each defect category is assigned a different AQL level. Table III provides a list of typical tablet packaging defect classifications.
Table III: Defect Classification.
Defect Class
Definition Description AQL
Critical A defect that can compromise product safety, purity, or identity that may be harmful to the consumer.
Incorrect label, carton, insert, foreign tablet, incorrect code
0.01 %
Major A defect that jeopardizes the integrity or function of the package.
Missing band, deformed/cracked closure, no foil, short
count/overfill, etc.
0.65%
purity, or identity, or package integrity of function.
on the label, flaps not glued on the carton.
For each defect category, defects are also classified into different types. For instance, if inspecting a bottle for tablet count, closure, seal, label and carton defects, these defects are not added together since they are results of different packaging processes. Instead, these defects are added based on the product attribute ”tablet count, closure, etc.).
The inspection procedure should include the sampling plan with inspection level, type, and accept/reject criteria. For instance, if the expected packaging lot size is 36,000 bottles, it would be impossible to test all 36,000 bottles, so a representative sampling size should be selected. To determine an inspection sample size, ANSI/ASQ Z1.4-2008 Sampling by Attributes Plan, General Inspection II, Tightened Plan can be used. A lot of 36,000 bottles corresponds to letter N ”General Inspection Level II) ”see Table I. A sample size from Table II ”Table II-B, Single Sampling Plans for Tightened Inspection) is selected. Letter N corresponds to sample size of 500. If AQL level desired is specified as 0.010%, it means that 2000 samples need to be inspected and all 2000 samples should have no defects to pass a lot. For AQL 0.65%, 500 samples require inspection failing a lot if six defects are found. For AQL 4%, only 315 samples require inspection failing a lot if 19 defects are found.
Statistics Behind Sampling Plans
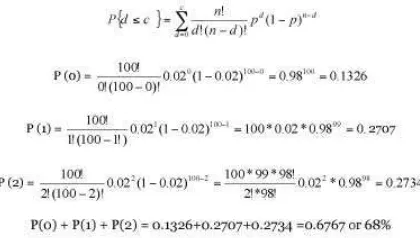
Sampling by attributes is based on binomial distribution. The performance of sampling plan is given by the operating characteristic ”OC) curve. The OC curve shows the probability, Pa, that a submitted lot will be accepted for any given fraction defective p. To construct an OC curve, one needs to know the sample size ”n) and the number of defects ”c) one is willing to accept. For example, with n=100, if c=2, p would equal to 2/100=0.02. Therefore, to compute probabilities for c below and above 2, to bracket 0.02, Pa versus p is plotted.
Since the sample with up to c defects is accepted, the cumulative binomial distribution is used to compute the probability of acceptance, P.
The Excel function BINOMDIST(c, n, p, TRUE) can be used, where c = number of defects, n = sample size, p = probability of defect occurring, and TRUE is for cumulative distribution. Figure 4 shows how BINOMDIST function is used.
Figure 5 shows the OC constructed by plotting Pa vs. p.
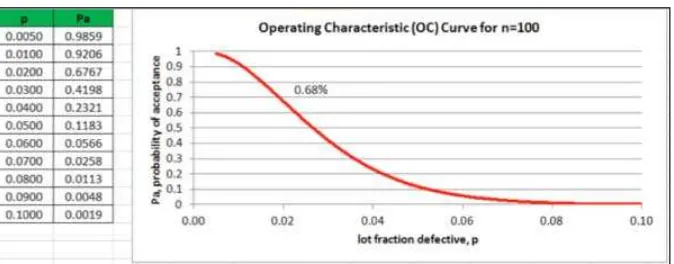
Figure 5: OC Curve Constructed Using Excel.
As shown in Figure 5, the probability of accepting a lot containing 2% defectives is 68% ”i.e., out of 100 lots, it is expected to accept 68 and reject 32 when the sample size is 100 and the acceptance number is two).
Figure 6: OC Curve for n=100.
Figure 7 demonstrates that if n is increased while c is constant, we obtain a lower acceptance level with increasing n. As n increases, we approach 100% sampling. As shown in Figure 7, the probability of accepting a lot containing 2% defectives is 68% for n=100, 24% for n=200, 1% for n=400, and 0% for n=800 at c=2.
Figure 7: OC Curve for n=100, 200, 400, and 800 with c=2.
Warning
Since the regulatory requirements are very strict when it comes to defects that are related to safety, purity, etc., it is a common misconception that the sample inspected must not contain any non-conformance units for the lot to be accepted.
For example, as shown in Figure 8, the OC curves show that lots that are 2% defective will be accepted 90% of the time inspecting five samples, 82% of the time inspecting 10 samples, 67% of the time inspecting 20 samples, and 13% of the time inspecting 100 sample. With more samples we test, the probability of accepting a lot with defects decreases. Thus if we claim that we accept zero defects and test a very small sample, in this case five samples, there is a high probability that we are accepting defects in the lot without being able to detect them.
PRINTER-FRIENDLY VERSION
Tags: GMP - Variation & Statistics, GXP
Summary
In summary, correct statistical sampling is required by the pharmaceutical industry regulations.
Understanding of ANSI sampling by attributes and correct application will help to avoid sampling mistakes and potential observations.
Acronym Listing
AQL Average Quality Limit
ANSI American National Standard Institute
ASQ American Society for Quality
FDA US Food and Drug Administration
GMP Good Manufacturing Practice
General References
ASQ, ANSI/ASQ Z1.4-2008: Sampling Procedures and Tables for Inspection by Attributes, 2008.