The First
Annual Report of the
National Eye Database
2007
2007
Includes reports on:
Cataract Surgery Registry 2002,2003,2004 and 2007
Diabetic Eye Registry 2007
Contact Lens Related Corneal Ulcer Surveillance 2007
Glaucoma Registry, 2007
MOH Ophthalmology Service Census 2002 - 2007
The First
Annual Report of the
National Eye Database
2007
2007
Includes reports on:
Cataract Surgery Registry 2002,2003,2004 and 2007
Diabetic Eye Registry 2007
Contact Lens Related Corneal Ulcer Surveillance 2007
Glaucoma Registry, 2007
MOH Ophthalmology Service Census 2002 - 2007
Edited by:
Jointly Published by:
National Eye Database (NED) and Clinical Research Centre (CRC)
Contact:
Clinical Registry Manager National Eye Database Registry Coordinating Centre C/o Clinical Research Centre Level 4, Specialist Offi ce
Hospital Selayang Lebuhraya Selayang-Kepong
68100 Batu Caves Selangor Malaysia
General Line: 603-61203233 Ext.: 4169 Fax: 603-61207564
Email: [email protected] Website: http://www.acrm.org.my/ned
Disclaimer
Data reported here are supplied by the NED. Interpretation and reporting of these data are the responsibility of the editors and in no way should be seen as an offi cial policy or interpretation of the NED.
This report is copyright. However it can be freely reproduced without the permission of the NED. Acknowledgement would be appreciated.
Suggested citation
The suggested citation for this report is as follows: Goh Pik Pin, Elias Hussein, Mariam Ismail (Eds)
THE FIRST ANNUAL REPORT OF THE NATIONAL EYE DATABASE, 2007 Kuala Lumpur, Malaysia 2008
Electronic version
The National Eye Database (NED) thank the following:
Dr. Mariam Ismail, the head of Ministry of Health (MOH) Ophthalmology Service (2002 to 2008), for her vision and support in the establishment of NED, an eye health information system.
The 36 MOH ophthalmology departments who are source data producers (SDP) and their heads of department, site coordinators, doctors in-charge, resident optometrist at Kulim district hospital and staff who worked hard to collect and enter patients’ data into the NED electronic web application.
Staff Nurse Teng Kam Yoke, NED clinical registry manager and registry assistant Madam Tuan Junaidah Bt Tuan Jusoh.
Dr. Lim Teck Onn, director of Clinical Research Center (CRC) Network, MOH, Dr. Jamaiyah Haniff, head of Clinical Epidemiology Unit of CRC, and Ms. Celine Tsai Pao Chien, CRC IT manager for their unceasing support and encouragement.
Information technology personnel namely Ms. Lim Jie Ying, database administrator, Ms Teo Jau Shya, clinical data manager, Ms. Amy Porle, web application programmer, Ms. Azizah Alimat, desktop publisher, Ms. Huziana Fauzi, clinical data assistant and Ms. Anne John Michael for proofreading.
Dr. Hoo Ling Ping and Ms. Wahidah Tumijan, the statisticians who convert registry data into meaningful statistic.
Madam Noraida Mohammed Yusof, administrative clerk of Ophthalmology Department, Hospital Selayang, who helped in the medical devices phone survey.
Matron Wakia Abdul Wahab, CRC Manager and Ms. Norazah Md Yusoff, research assistant at CRC, Selayang Hospital for their kind assistance in coordinating training workshops, NED steering committee meetings and annual SDP management meetings.
Dr. Hjh Siti Zaleha Mohd Salleh, director and Madam Lee Sak Wah, head of Information Technology department of Selayang Hospital.
Many others whose names may not be listed here for their help in many ways.
The future of NED is challenging. The continuity of NED will certainly need every stakeholder’s perseverance, enthusiasm, courage and hard work. We hope for your continuous support.
Thank you.
Advisor Dr. Mariam Ismail
Head, Ophthalmology Service, MOH
& Head, Ophthalmology Department, Hospital Selayang
Chairperson Dr. Goh Pik Pin
Public Health Ophthalmologist/ Consultant Ophthalmologist Ophthalmology Department, Hospital Selayang
Principal Investigator for Cataract Surgery Registry
Members Dr. Elias Hussein
Consultant Ophthalmologist, Primary Eye Care Service Ophthalmology Department, Hospital Selayang National Coordinator for Key Performance Indicators Dr. Radzlian Othman
Head & Consultant Ophthalmologist, Oculoplasty Service Ophthalmology Department, Hospital Serdang
National Coordinator for Monthly Ophthalmology Service Census, MOH Dr. Shamala Retnasabapathy
Consultant Ophthalmologist, Corneal Service Ophthalmology Department, Hospital Sungai Buloh
Principal Investigator for Contact Lens-related Corneal Ulcer Surveillance
Dr. Ong Poh Yan
Consultant Ophthalmologist, Glaucoma Service Ophthalmology Department, Hospital Selayang Principal Investigator for Glaucoma Registry
Dr. Nor Fariza Ngah
Consultant Ophthalmologist, Medical Retina Service Ophthalmology Department, Hospital Selayang Principal Investigator for Diabetic Eye Registry Dr. Zuraidah Mustari
Head & Consultant Ophthalmologist
Ophthalmology Department, Hospital Sultanah Nur Zahirah Kuala Terengganu
Principal Investigator for Tele-Diabetic Retinopathy Secretariat Teng Kam Yoke
Ophthalmic trained staff nurse NED Clinical Registry Manager
Technical Support Personnel
Statisticians Dr. Hoo Ling Ping
Ms. Wahidah Tumijan
Database Administrator Ms. Lim Jie Ying
Introduc
i
on
The National Eye Database (NED) is an eye health information system supported by MOH. It is a clinical database consisting of six patient registries and a monthly ophthalmology service census. The patient registries are Cataract Surgery Registry, Diabetic Eye Registry, Contact Lens-related Corneal Ulcer Surveillance, Glaucoma Registry, Retinoblastoma Registry, and Age Related Macular Degeneration Registry. The source data producers are eye care providers, currently from the public sectors only, but will expand to university and private sectors. Information collected, both clinical and epidemiological, will be very useful in assisting the MOH, Non-Governmental Organizations, private healthcare providers and industry in the planning, evaluation and continuous improvement of eye care services, leading to prevention and control of blindness in the nation.
Vision
Accessible eye health information.
General Objec
i
ves of the Na
i
onal Eye Database
1. To establish and maintain a web based eye health information system on natural history of visually threatening eye diseases, which are of public health importance. The information is useful in the planning and evaluation of eye care service.
2. To determine the effectiveness of treatment, both clinical outcomes and cost, and identify factors infl uencing outcomes. This serves the needs of outcome assessment.
3. To provide information necessary to evaluate ophthalmology services through census and key performance indicators, as well as on safety or harm of products and services used in the treatment of eye disease. This contributes to continuous quality initiatives.
4. To evaluate the accessibility and equity in health care provision. This information enhances accountability.
5. To provide means of prompt and wide dissemination of epidemiological and clinical information such as real-time registry reports and notifi cation of epidemic of contact lens-related corneal ulcer through the web. This is essential for advocating public health.
6. To stimulate and facilitate research on eye diseases.
Speci
fi
c Objec
i
ves of Individual Registry and Census
Cataract Surgery Registry
The Cataract Surgery Registry (CSR) collects data pertaining to patients who have had cataract surgery. Data collected include demography, medical history, operative events, post-operative visual outcomes and probable causes for poor outcome. The CSR is a continuation of the National Cataract Surgery Registry (NCSR), which was operational from 2002 to 2004. Annual NCSR reports for the year 2002, 2003, and 2004 are available at the publication section at www.acrm.org.my/ned.
Diabetes mellitus (DM) is becoming an epidemic in Malaysia. Based on the National Health and Morbidity Survey, the prevalence of known and newly diagnosed diabetes among adults above 30 years old has risen from 8.3% in 1996 to 14.9% in 2006. With the increasing prevalence of diabetes, it is also expected that complications related to DM to be on the rise. Diabetic retinopathy (DR), a microvascular complication of diabetes, may lead to blindness. However it is preventable if detected and intervened early.
The Diabetic Eye Registry (DER) aims to observe the status of diabetic retinopathy among diabetics referred to the ophthalmology clinics. The information is useful in the planning and evaluation of diabetic eye screening and provision of treatment for patients who have DR. With evidence-based public health program, we hope DR does not become the major cause of visual impairment and blindness in this country.
Speci
fi
c Objec
i
ve
1. To evaluate the status of diabetic retinopathy at the fi rst diabetic eye screening at ophthalmology clinics
Contact Lens-related Corneal Ulcer Surveillance
Contact lens wear is one of the ways to correct refractive errors. However, it is associated with complications such as allergic conjunctivitis, corneal abrasion and corneal ulcer. Among these, corneal ulcer or infective keratitis is the most serious as it can lead to devastating visual outcomes such as blindness and even loss of eyeball through evisceration.
Monitoring of contact lens-related corneal ulcer, as a mean to evaluate contact lens practice, has been part of the ophthalmology service census since 2002. Subsequent to the global outbreak of fusarium keratitis related to contact lens cleaning solution in 2006, the monitoring is now done on-line through web application. Reports of cases notifi ed can be viewed on-line. This has made monitoring and dissemination of information more effi cient.
Doctors who diagnose patients with suspected contact lens-related corneal ulcer are encouraged to notify cases to the NED surveillance. Data collected include demography, types of contact lens and cleaning solution used, wearing pattern, causative organism, vision and treatment outcome after 1 month.
Speci
fi
c Objec
i
ves
1. To detect outbreak of contact lens-related corneal ulcer
2. To determine pattern of causative organism of contact lens-related corneal ulcer
3. To study the characteristics of patients in terms of demography, risk factors and contact lens type and wearing patterns
4. To monitor the outcome of patients with contact lens-related corneal ulcer
Glaucoma Registry
1. To study the demographic characteristics of glaucoma patients, glaucoma suspects and patients with ocular hypertension
2. To determine the types of glaucoma
3. To access risk factors associated with glaucoma, glaucoma suspects and patients with ocular hypertension
4. To evaluate the pattern of management among glaucoma patients
Re
i
noblastoma Registry
Retinoblastoma (RB) is the most common intraocular malignant tumour encountered in children. Without early diagnosis and proper treatment, RB results in visual impairment or blindness. Untreated, the disease is fatal. With early diagnosis, eyes and lives of those affected can be saved.
Globally, RB affects between 1 in 14,000 and 1 in 20,000 live births. Currently, there are no data available on the incidence, prevalence and disease characteristics of RB in Malaysia. This registry is developed as database on the magnitude and pattern, as well as mode of treatment and outcome of RB in Malaysia.
Speci
fi
c Objec
i
ves
1. To determine the incidence and distribution of retinoblastoma in different states in Malaysia 2. To determine the ethnic-specifi c prevalence of retinoblastoma in Malaysia
3. To study characteristics of retinoblastoma patients in terms of clinical presentation and disease stages based on the International Intraocular Retinoblastoma Classifi cation
4. To evaluate types of treatments and monitor treatment trends
5. To evaluate treatment outcomes including complications related to treatment
Age Related Macular Degenera
i
on Registry
Age related macular degeneration (AMD) is one of the leading causes of blindness in individuals over the age of 50 years. The prevalence of early and late AMD among Singaporean Malays is 3.5% and 0.3% respectively, affecting more men than women.
In the past, AMD was perceived to be more prevalent in Caucasians than Asians. However, recent studies have shown that although this is true of late AMD, the prevalence of early AMD among Caucasians and Asians is similar.
To date, there is no data on AMD among Malaysians. This registry aims to establish a database on demographics, risk factors, clinical features and methods of treatment used in patients newly diagnosed with AMD.
Since 2002, Ophthalmology Service of MOH has been collecting annual census from all the hospitals with ophthalmology departments. Data include essential service census and key performance indicators (KPI) for ophthalmology service. There are 13 sections in the census return. They consist of section on out-patients, in -patients, major eye operations, cataract service, diabetic service, glaucoma service, optometry service and subspecialty services such as vitreoretinal, corneal, paediatric ophthalmology, oculoplasty, medical retinal, and a public health ophthalmology section with data on training and prevention of blindness activities. These data are very useful in the planning of ophthalmology service in MOH. With the monthly on-line data entry, heads of each ophthalmology department can now view the real-time census.
Speci
fi
c Objec
i
ves
1. To evaluate service output in all ophthalmology departments 2. To study trends in service output and service pattern
3. To get baseline data on services provided by MOH ophthalmology departments
4. To determine norm and set standards for performance indicators for centres which differ in physical and human resources strength.
Na
i
onal Eye Database Methodology
NED is designed as a cohort study. It is an online clinical database hosted at the Association of Clinical Registry, Malaysia website at www.acrm.org.my/ned. Its protocol has been approved by the Medical Research Ethics Committee of MOH on 2nd September 2008 (NMRR 08-552-1707). The protocol is accessible at the
NED website.
Data collection and data entry are done at source data producer (SDP) sites. Data are collected either using case report form (CRF) (refer to appendix), which are later entered into the web application, or are directly entered into the web application during the course of clinical work.
Data management using data query are set in the web application to reduce inconsistency, out of range or missing values. Authorized staff at each SDP are given passwords to perform data entry. Individual SDP reports and aggregated reports based on cumulative data of all SDPs are available real-time at NED website. These reports are accessible by heads of department, doctors in charge and site coordinators via authorized password. The web reports are descriptive analysis of data which have been entered. Annual statistical report is produced based on data collected for a specifi c year. The statistical reports will be published yearly and be distributed to users comprising of divisions and units of MOH, ophthalmology departments, universities, other relevant public agencies and non-governmental organizations.
Organiza
i
on Chart
Sponsors
The NED is sponsored by a registry grant from the MOH, via Clinical Research Center, one of the MOH National Institutes of Health.
The CRC shall:
1. Be responsible to the Deputy Director General (Research and Technical Support) of the MOH for the effective, effi cient and proper conduct of the registry
2. Provide oversight for the operations of the registry
3. Appoint the Principal Investigator (PI) of the registry after due consultation with the participating clinical sites and other relevant experts. The appointed PI shall then appoint members of the Governance Board and Steering Committee, with due consultation with the participating clinical sites and other relevant experts.
4. Provide financial, human and other resources required Sponsor
Steering Commit ee
• Ophthalmologists • Optometrists
Sub commit ee / Expert Panels
• Registry PI/Co - PI
• Independent Data Monitoring Commit ee
• Outcome Evaluai on
• Data Access & Publicai on Commit ee • Medical Wrii ng Commit ee
Governance / Advisory Board
• MOH • Public • University
• Private ophthalmologist
Registry Coordinai ng Centre
• Public Health Ophthalmologist/Epidemiologist • Clinical Registry Manager
• Research Assistant • IT Personnel • Stai si cian
Source Data Producers
• Heads of Department (Site Co-Invesi gators) • Doctors-in-charge • Site Coordinators
Users
• SDP • MOH • Universii es
6. Approve, and if necessary validate, the statistical analysis plan 7. Determines policy and procedures for the operations of the database
8. Establish the Registry Coordinating Centre (RCC) and appoint its project team members 9. Direct the activities of the RCC
10. Oversee matters related to research such as:
10.1. Collaborate research activities with all ophthalmology departments at MOH, universities, private eye centres and international organizations
10.2. Coordinate collaborated research activities in ophthalmology
10.3. Assist ophthalmologists in developing research protocol for the MOH Research and Ethical Committee (MREC) and grant application
10.4. Organize training related to research
Governance Board
NED is yet to set up a governance board. The members of the board will consist of those with experience in research and clinical practice and should represent all identifi ed stakeholders.
The Board shall
Provide leadership and direction for the NED
Communicate NED vision, strategic direction, policies and decisions to all interested parties. Determine the objectives of the NED
Provide expertise for the NED
Oversee the progress of the NED to ensure its continuing relevance Assist in enlisting SDPs for the NED and facilitate access to source data
Provide avenues for users input to the NED, and to convey their needs and concerns Secure ongoing funding support for the NED
Galvanize commitment of all interested parties to the NED
Conduct the annual review of the NED and the performance of the project team
Sub-commi
t
ees or expert panels
From time to time, the Steering Committee may appoint sub-committee or expert panels to assist in some specifi c aspects of the registry work. These may include the following:
1. Principal Investigator and Co-investigators in Sub-registries under NED
This is an expert panel responsible for the development and maintenance of eye disease registries under NED.
The responsibilities of Principal Investigators for the respective registries in NED are: a. To publicize and encourage others to participate in the registry
b. To review and improve registry web reports
c. To prepare annual statistical report based on aggregated data d. To present fi ndings on registry at local and international meetings
e. To publish registry fi ndings in peer reviewed journals
f. To use and encourage others to use registry data for improving eye care services and in the training of eye care professionals, including doctors, optometrists, orthoptics and mid level eye care personnel.
2. Independent Data Monitoring Committee
The committee is responsible for reviewing and approving application to access registry data for research and publications based on registry data.
5. Medical Writing Committee
A committee constituted to prepare the registry regular or interim registry reports, and to prepare manuscripts on registry data for journal submission.
Registry Coordina
i
ng Centre
The Registry Coordinating Centre (RCC) is located at CRC Hospital Selayang. It is headed by a clinical registry manager (CRM) and assisted by a clinical registry assistant (CRA). They manage, coordinate and monitor the progress of the registry as follows:
1. Manage the activities for setting-up and initiating the registry 2. Design and prepare protocol and CRF
3. Prepare document submission for ethics approval, and subsequent liaison with ethics committee and regulatory authority concerned
4. Develop and validate registry database, and undertake data management such as data clarifi cation and data entry
5. Help SDPs which do not have on-line facilities for data entry
6. Assist SDP sites in initiating and conducting the registry, in enrolling patients into the registry and in promoting the registry using various media
7. Undertake safety surveillance of the therapeutic products of interest to the registry
8. Communicate with staff-in-charge at SDP to monitor the registry conduct and visit SDP sites when necessary
9. Communicate with designated statistician appointed by the RCC, who will be responsible for statistical analysis of the registry data
10. Assist Steering Committee and PIs with drafting of the registry reports, manuscripts and abstracts
Source Data Producers
SDP are centers who participate in the NED. They provide data essential for each registry and service census. At each participating SDP, personnel involved in the operation of NED are the heads of department (HOD), who are also NED site-co-investigators, doctors in charge and sitecoordinators, who are mostly optometrists. (Refer to the list of current SDPs and personnel in charge at each SDP in pages xi and xii in this report).
Personnel involve at each SDP are given the rights to manage their own center data, including data edit, data download and to view real time web reports. They must ensure complete data ascertainment, good quality data and up to date data entry. Data collection and data entry should as much as possible be done at the course of clinical work. HODs appoint staff for data entry and approve their applications to get user names and passwords. Staff involved are advised to refer to the user instruction manual, which is posted on the web.
Responsibili
i
es of heads of department
1. Create awareness among department staff on the objectives and patients to be included in the registries 2. Provide training to new staff in data defi nition and CRF completion
3. Coordinate with RCC in the application of usernames and passwords for staff
4. Periodically review completed CRF and centre web reports to check for inconsistency, out of range or missing values
5. Communicate with RCC on any arising problems
Responsibili
i
es of site-coordinators
1. Provide training in data entry to new staff 2. Perform data entry
3. Review patient listing for outcome not yet submitted, gather and enter outcome data
4. Feedback to HOD and doctor-in-charge on any problems arising from data collection and data entry 5. Communicate with RCC on any arising problem
Users
The users of NED data include
1. Eye care providers such as ophthalmologists, optometrists, opticians and orthoptics 2. MOH agencies, department and division
3. Academic institutions including ophthalmology and optometry departments at universities, nursing colleges etc
4. NGO providing eye care services or involved in the blindness prevention activities 5. Industry
Site Heads of Dept Doctors In charge Site coordinators
1. Hospital Alor Star Dr. Ahmad Mat Saad Dr. Zaharidah Abdul Kadir
Noor Suriani bt Mohamad
2. Hospital Ampang Dr. Siti Haida Mad Isa Dr. Zalifa Zakiah bt Asnir
Noriah bt Abdullah
3. Hospital Batu Pahat
Dr. Jawiah bt Hassan Dr. Jawiah bt Hassan Afifah bt Kamaruddin
4. Hospital Bintulu Dr. K.M. Reddy Dr. K.M. Reddy Nurulain Mat Zain
5. Hospital Bukit Mertajam
Dr. Rohana Taharin Dr. Wong Chi Lun Tengku Azlina bt Tengku Loding
6. Hospital Duchess of Kent, Sandakan
Dr. Adarsh Bharwaj Dr. Adarsh Bharwaj Norhafi zah Abd Razik
7. Hospital Ipoh Dato’ Dr. P. Balaravi Dr Poh Eu Ping Najihah Muhammad Sharif
8. Hospital Kangar Dr. Mohd Nazri Sulaiman
Dr. Noram Azian bin Ramli
Roslinda bt Rahman
9. Hospital Keningau Dr. P.S.P. Ravindran Dr. Christina Lee Lai Ling
Hr Shredznear Yabi
10. Hospital Kota Bharu
Dr. Zulkifl i Abd Ghani Dr. Azma Azalina bt Ahmad Alwi
Rossaidah bt Mustapa
11. Hospital Kuala Krai
Dr. Tg Norina Tuan Jaafar
Dr. Salazahrin Salleh Farawahida Fakaruddin
12. Hospital Kuala Lumpur
Dr. Joseph Alagaratnam
Dr. Jelina Mohd Noor Intan Khusiah Abd Rahman
13. Hospital Kuala Pilah
Dr. Khairul Husnaini bt Mohd Khalid
Dr. Khairul Husnaini bt Mohd Khalid
Suzana bt Ahmad
14. Hospital Sultanah Nur Zahirah Kuala Terengganu
Dr. Zuraidah Mustari Dr. Nor Anita bt Che Omar
Farah Wahidah Hashim
15. Hospital Melaka Dr. S Anusiah Selvathurai
Dr. Juliana Jalaruddin Diana Bt Mohamed
16. Hospital Miri Dr. Chieng Lee Ling Dr. Chieng Lee Ling Noor Asmah Md Azmi
22. Hospital Sibu Dr. H. A. Faisal Dr. Jakiyah Daud Suzzana Abdul Karim
23. Hospital Sri Manjung
Dr. Yushaniza Yaacob Dr. Yushaniza Yaacob Juhaida bt Zahri
24. Hospital Sultan Ismail, Pandan
Dr. Hooi SiewTong Dr.Hooi SiewTong Nursalinah bt Adam
25. Hospital Sultanah Aminah Johor Bahru
Dr. Loh Swee Seng Dr. Kevin Ong Nurazilah Ismail
26. Hospital Sultanah Fatimah, Muar
27. Hospital Sungai Buloh
Dr. Mohamad Sharif Fahruddin
Dr. Shamala Retnasabapathy
Majidah Zainal Abidin
28. Hospital Sungei Petani
Dr. Rosnita bt Alias Dr. Rosnita bt Alias Naseha Hussain
29. Hospital Taiping Dr. Ng Sok Lin Dr. Rosilah bt Mohamad
Rohaiza bt Abdul Hamid
30. Hospital Tawau Dr. Ajit Majumder Dr. Ajit Majumder Nurliyana bt Ishak 31. Hospital Teluk
Intan
Dr. Noram Bt Mat Saad
Dr. Noram bt Mat Saad Norina Abdul Gafor
32. Hospital Temerloh Dr. Nor Higrayati bt Ahmad Kasah
Dr. Nor Higrayati bt Ahmad Kasah
Nor Hanim Ahmad Adnan
33. Hospital Tengku Ampuan Afzan,Kuantan
Dato’ Dr. Vasantha Kumar
Dr. Aidila Jesmin Jabbari
Noor Azhari bin Ahmad
34. Hospital Tengku Ampuan
35. Hospital Tuanku Jaafar, Seremban
Dr. Bethel Indira Livingstone
Dr. Norlelawati Abu Normalisa Muhammad Som
36. Hospital Umum Sarawak Kuching
Dr. Intan Gudom Dr. Mohd Aziz Salowi Nazirin bin Arshad
37. Hospital Kulim - En Ku Hazemie,
Optometrist
-Title Editors Institution
1. Cataract Surgery Registry
Dr. Goh Pik Pin Public Health Ophthalmologist Consultant Ophthalmologist
Ophthalmology Department Hospital Selayang
Dr. Loh Swee Seng Head of Consultant Ophthalmologist Ophthalmology Department
Hospital Sultanah Aminah, Johor Baru Dr. Poh Eu Ping Ophthalmologist
Ophthalmology Department Hospital Ipoh
Dr. Ang Ee Ling Ophthalmologist
Ophthalmology Department Hospital P.Pinang 2. Diabetic Eye
Registry
Dr. Zuraidah Mustari Head & Consultant Ophthalmologist, Ophthalmology Department
Hospital Sultanah Nur Zahirah Kuala Terengganu
Dr. Nor Fariza Ngah Consultant Ophthalmologist Medical Retina Service Ophthalmology Department Hospital Selayang
3. Contact Lens-Related Corneal Ulcer Surveillance
Dr. Shamala Retnasabapathy
Consultant Ophthalmologist Corneal Service Ophthalmology Department Hospital Sungai Buloh
Dr. Chandramalar T. Santhirathelagan
Consultant Ophthalmologist Corneal Service
Ophthalmology Department Hospital Sungai Buloh 4. Glaucoma
Registry
Dr. Ong Poh Yan Consultant Ophthalmologist Glaucoma Service
Ophthalmology Department Hospital Selayang
Dr. Gong VHM Consultant Ophthalmologist Glaucoma Service
Ophthalmology Department Hospital Ipoh
5. Ophthalmology Service Census
Dr. Mariam Ismail Head, Ophthalmology Service Head & Consultant Ophthalmologist
Ophthalmology Department Hospital Selayang
The National Eye Database (NED) was established to provide a system to collect data required for service and monitoring of sight-threatening eye diseases. It is an expansion of the already existing paper-based National Cataract Surgery Registry (NCSR) and the annual ophthalmology service census established in 2002 with the addition of fi ve other eye disease registries namely diabetic eye registry, contact lens-related corneal ulcer surveillance, glaucoma registry, age-related macular degeneration and retinoblastoma registry. Its web application form was launched on the 1st January 2007 and is hosted at www.acrm.org. my/ned.
The source data producers are 36 MOH ophthalmology departments. In addition, Hospital Kulim, a district hospital with resident optometry service contributed data for the diabetic eye registry. Currently, data are being collected from MOH hospitals only.
The fi rst NED annual report 2007 includes fi ndings on cataract surgery registry (CSR) from 2002 to 2004, and 2007, diabetic eye registry (DER) 2007, and contact lens-related corneal ulcer surveillance 2007, glaucoma registry preliminary report 2007, and the ophthalmology service census 2002 to 2007. Data collected in the age related macular degeneration and retinoblastoma registry, are in the pilot phase and are not reported. Data from a medical device survey and listing of MOH health clinics which have fundus cameras for diabetic eye screening, are included in the appendix of this report.
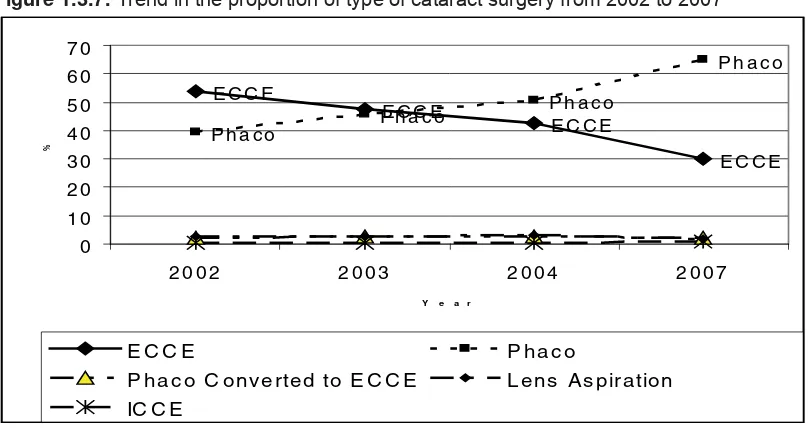
The fi ndings for the four-year cumulative data on 66,431 cataract surgeries showed that 67.5% of the patients had systemic co-morbidity and 32.4% had ocular co-morbidity. There is a change in the type of cataract surgery performed, from predominantly extracapsular cataract extraction (at 54.0% in 2002) to phacoemulsifi cation (phaco at 65.1% in 2007). Besides, there is an increasing trend of subtenon and topical anaesthesia used during cataract surgery. The visual outcome was best following phacoemulsifi cation, with cumulative rate of 89.4% achieving refracted vision of 6/12 or better, followed by ECCE,80.8%. The rate of posterior capsular rupture, an intra-operative complication was 5.4%, higher than the standard of less than 5%, set by the MOH. SDPs can evaluate their cataract surgery service performance based on CSR data as part of their department’s continuous quality improvement initiatives. Individual surgeons can now review cataract surgery outcome data on patients they operated on and apply CUSUM, a statistical process control method to audit their performance in order to improve outcome. The CUSUM application is made easier via automated data mining from CSR to eCUSUM. (https://app.acrm.org.my/eCUSUM).
The DER data on 10,856 diabetic patients who were seen for the fi rst time for an eye assessment at MOH ophthalmology clinics showed that majority, 60.4% had no apparent diabetic retinopathy (DR) and 38.2% had some form of DR. These results further emphasized that diabetic eye screening should be done at the primary care level and only patients who require further management be referred to the ophthalmology clinics. By doing so, doctors at ophthalmology clinics can focus on patients who need specialized care. A coordinated diabetic eye screening program using fundus photography would be the most logical approach to screen and detect DR so as to prevent blindness from diabetes mellitus.
The contact lens-related corneal ulcer surveillance was initiated as part of the ophthalmology service census to monitor incidence of contact lens-related corneal ulcer. Its rate would refl ect the standard of contact lens practice. Subsequent to the outbreak of fusarium keratitis related to contact lens cleaning solution in United Kingdom, Hong Kong and Singapore in 2006, the surveillance was further extended to capture further detail on contact lens wear. A total of 103 patients (109 eyes) were notifi ed to the surveillance throughout 2007. The occurrence did not indicate any epidemic. Pseudomonas was the commonest causative agent (79.5%).
The 2007 NED annual report contains important information useful for evaluation and planning of ophthalmology service in MOH in general, and quality improvement for individual SDP in particular. We hope users fi nd this report resourceful and will translate the fi ndings for advocating action in improving standard of eye care.
Dr. Mariam Ismail Dr. Goh Pik Pin
CAI Carbonic Anhydrase Inhibitor
CF Counting Fingers
CLRCU Contact Lens-Related Corneal Ulcer
CSMO Clinically Signifi cant Macular Odema
CMO Cystoid Macular Oedema
CSR Cataract Surgery Registry
DER Diabetic Eye Registry
DM Diabetes Mellitus
DR Diabetic Retinopathy
ECCE Extracapsular Cataract Extraction
FU Follow-up
HM Hand Movement
HPT Hypertension
ICCE Intracapsular Cataract Extraction
IOL Intraocular Lens
KPI Key Performance Indicator
MOH Ministry Of Health
NED National Eye Database
NHMS National Health and Morbidity Survey
NPDR Non Proliferative Diabetic Retinopathy
NPL No Perception Of Light
OT Operating Theater
PCO Posterior Capsule Opacifi cation
PCR Posterior Capsular Rapture
PDR Proliferative Diabetic Retinopathy
Phaco Phacoemulsifi cation
PL Perception Of Light
PI Principal Investigator
PMMA Polymethyl Methacrylate
RCC Registry Coordinating Center
Page
ACKNOWLEDGEMENTS i
NED STEERING COMMITTEE MEMBERS 2007-2008 ii
ABOUT NATIONAL EYE DATABASE iii
NED SOURCE DATA PRODUCERS 2007/2008 xi
CONTRIBUTING EDITORS xiii
FOREWORD xiv
ABBREVIATIONS xvi
CONTENTS xvii
LIST OF TABLES xx
LIST OF FIGURES xxii
REPORT SUMMARY xxiv
CHAPTER 1: CATARACT SURGERY REGISTRY 2002 TO 2004 AND 2007 1
1.1 STOCK AND FLOW 2
1.2 CHARACTERISTICS OF PATIENTS 3
1.2.1 Patient demography 3
1.2.2 Medical history 5
1.2.2.1 Systemic co-morbidity 5
1.2.2.2 Causes of cataract 7
1.2.2.3 First or second eye cataract surgery 7
1.2.2.4 Past ocular surgery in the eye to be operated 8
1.2.2.5 Pre-existing ocular co-morbidity 8
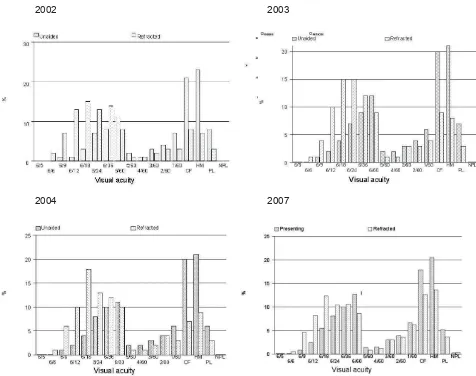
1.2.2.6 Pre-operative vision 10
1.2.2.7 Planned refractive power 12
1.3 CATARACT SURGERY PRACTICE PATTERN 13
1.3.1 Number of cataract surgeries performed by SDP 13
1.3.2 Number of cataract surgeries performed by month 14
1.3.3 Number of cataract surgeries performed by states 16
1.3.4 Surgeon status 16
1.3.5 Duration of cataract surgery 17
1.3.6 Distribution of cataract surgeries performed under day care setting 18
1.3.7 Distribution of types of cataract surgery 19
1.3.8 Distribution of combined surgery 19
1.3.9 Anaesthesia in cataract surgery 20
1.3.10 Intraocular lens implantation 21
1.4 INTRA-OPERATIVE COMPLICATIONS 23
1.4.1 Intra-operative complications 23
1.4.2 Intra-operative complication by type of surgery 23
1.4.3 Intra-operative complications by combined surgery 24
1.4.4 Distribution of intra-operative complications by type of combined surgery 24
1.4.5 Intra-operative complications by surgeon status 25
1.4.6 Rate of posterior capsular rupture by SDP 25
1.5 CATARACT SURGERY OUTCOME 26
1.5.3.2.2 Post-operative refracted VA 6/12 or better among patients without
ocular co-morbidity 31
1.5.3.2.3 Post-operative refracted VA 6/12 or better in relation to age of patients 32 1.5.3.2.4 Post-operative refracted VA 6/12 or better in relation to occurrence
of intra-operative complications 33
1.5.3.2.5 Post-operative refracted VA 6/12 or better in relation to intraocular lens 33 1.5.3.2.6 Post-operative refracted VA 6/12 or better in relation to surgeon status 34 1.5.3.2.7 Factors contributing to post-operative refracted VA of worse than 6/12 34
1.5.4 Final refractive power 36
1.5.4.1 Final refractive power for ECCE and phaco 36
1.5.4.2 Difference between planned and fi nal refractive power for patients who had
phacoemulsifi cation 38
CHAPTER 2: DIABETIC EYE REGISTRY 2007 41
2.1 STOCK AND FLOW 42
2.1.1 Number of cases registered by states 42
2.1.2 Number of cases registered by month 42
2.2 CHARACTERISTICS OF PATIENTS 43
2.2.1 Patient demoghraphy 43
2.2.2 Source of referral 45
2.3 MEDICAL HISTORY AND PRACTICE PATTERN 45
2.3.1 Type of diabetes 45
2.3.2 Duration of diabetes 45
2.3.3 Types of treatment 45
2.3.4 Systemic co-morbidities 45
2.3.5 Risk factors 45
2.3.6 Ocular co-morbidities 45
2.3.7 Pregnancy and eye examinations 47
2.3.8 Previous eye examinations 48
2.4 STATUS OF THE EYES 48
2.4.1 Status of visual acuity 48
2.4.2 Status of diabetic retinopathy and maculopathy 51
2.5 TREATMENT PLAN 52
CHAPTER 3: CONTACT LENS-RELATED CORNEAL ULCER SURVEILLANCE 2007 53
3.1 STOCK AND FLOW 54
3.2 CHARATERISTICS OF PATIENTS 56
3.2.1 Patient demography 56
3.2.2 Source of referral 57
3.3 MEDICAL HISTORY AND CONTACT LENS WEARING PRACTICE 58
3.3.1 Eyes affected 58
3.3.2 Duration of symptoms 58
3.3.3 History of ocular trauma as predisposing factor 58
3.3.4 Types of contact lens, wearing pattern and cleaning solution used 59
3.4 EYE STATUS 60
3.4.2 Presumptive causative organism 62
3.4.3 Microbiological results 62
3.4.3.1 Types of laboratory investigations performed 62
CHAPTER 4: GLAUCOMA REGISTRY-PRELIMINARY REPORT 2007 67
4.1 CHARACTERISTICS OF PATIENTS 68
4.2 MEDICAL HISTORY 68
4.3 CLINICAL FEATURES 68
4.3.1 Visual acuity 68
4.3.2 Cup disc ratio 68
4.4 TYPES OF GLAUCOMA 69
4.5 MANAGEMENT OF GLAUCOMA 69
CHAPTER 5: MOH OPHTHALMOLOGY SERVICE CENSUS 2002 TO 2007 72
APPENDIX
Appendix 1: Medical Devices Survey on Ophthalmology Services at MOH Hospitals, 2008 80 Appendix 2: Health Clinics With Fundus Cameras (Dated November 2008) 85
Appendix 3: Publications on NED 88
Table 1.1 (a): Stock and fl ow of cataract surgery 2
Table 1.1 (b): Ascertainment rate for MOH SDPs 2
Table 1.2.1: Age and gender distributions 4
Table 1.2.2.1: Percent distribution of systemic co-morbidity 6
Table 1.2.2.2: Causes of cataract 7
Table 1.2.2.3: First or second eye cataract surgery 7
Table 1.2.2.4: Past ocular surgery of the eye to be operated 8
Table 1.2.2.5: Distribution of pre-existing ocular co-morbidity 8
Table 1.2.2.5: Distribution of pre-existing ocular co-morbidity (cont.) 9
Table 1.2.2.6: Pre-operative vision among eyes operated in 2002-2004 and 2007 10
Table 1.2.2.7 (a): Distribution of planned refractive power, 2007 12
Table 1.2.2.7(b): Distribution of planned refractive power, 2007 12
Table 1.3.1: Distribution of number of cataract surgery performed by SDP in a year 13
Table 1.3.2: Number of cataract surgeries performed by month 14
Table 1.3.3: Number of cataract surgeries registered to NED by state 16
Table 1.3.3: Surgeon status 16
Table 1.3.5 (a): Duration of surgery in minutes, 2007 17
Table 1.3.5 (b): Duration of surgery by surgeon status, 2007 17
Table 1.3.6: Distribution of cataract surgeries performed as day care setting 18
Table 1.3.7: Distribution of types of cataract surgery 19
Table 1.3.8: Distribution of combined surgery 19
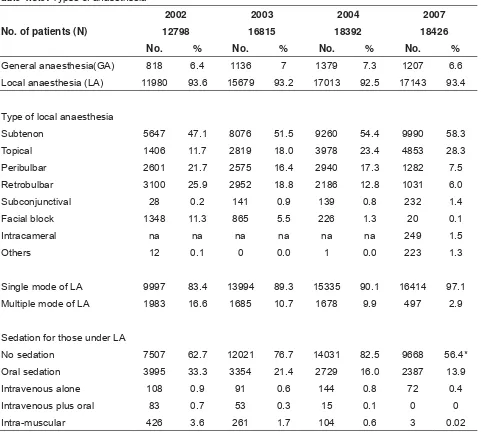
Table 1.3.9: Types of anaesthesia 20
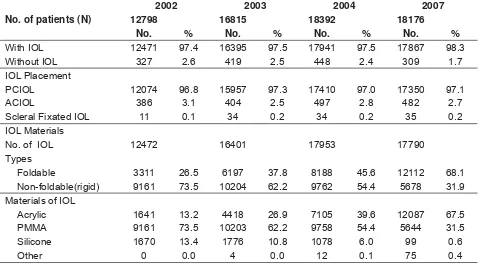
Table 1.3.10: Intraocular lens 21
Table 1.4.1: Intra-operative complication by patient and by types of complications 23
Table 1.4.2: Intra-operative complication by types of cataract surgery 23
Table 1.4.3: Intra-operative complications by combined surgery 24
Table 1.4.4: Distribution of Intra-operative complications by type of combined surgery, 2007 24
Table 1.4.5: Intra-operative complications by surgeon status, 2007 25
Table 1.5.1.1 (a): Rate of post-operative infectious endophthalmitis 26
Table 1.5.1.1 (b): Period of onset of infectious endophthalmitis after cataract surgery, 2007 26
Table 1.5.1.2 (a): Rate of unplanned return to OT 27
Table 1.5.1.2 (b): Reasons for unplanned return to OT 27
Table 1.5.2.2: Reasons for no records of visual acuity 28
Table 1.5.3.1: Post-operative VA for all patients with or without ocular co-morbidity 29
Table 1.5.3.2.1: Percent distribution post-operative unaided VA 6/12 or better among patients
without ocular co-morbidity, by surgery 30
Table 1.5.3.2.2: Percentage of post-operative refracted VA 6/12 or better for patients without
ocular co-morbidity, by surgery 31
Table 1.5.3.2.3: Post-operative refracted VA 6/12 or better in relation to age and types of surgery
for patients without ocular co-morbidity, 2007 32
Table 1.5.3.2.4: Percentage of eyes with post-operative refracted VA 6/12 or better in relation to
occurrence of intra-operative complications and types of surgery, 2007 33
Table 1.5.3.2.5: Percentage of eyes with post-operative refracted VA 6/12 or better in relation
to IOL and type of surgery, 2007 33
Table 1.5.3.2.6: Percentage of post-operative refracted VA 6/12 or better in relation to surgeon
status and types of surgery, 2007 34
Table 1.5.3.2.7 (a): Factors contributing to post-operative refracted VA of worse than 6/12 35
Table 1.5.3.2.7 (b):Factors contributing to post-operative refracted VA of worse than 6/12 after
excluding patients with pre-existing ocular co-morbidity, noted before surgery 2007 35
Table 2.1.1: Number of cases of diabetic patients registered to DER 42
Table 2.1.2: Number of cases registered by month, 2007 42
Table 2.2.1: Demographics of diabetic patients 44
Table 2.2.2: Sources of referral for diabetic patients 45
Table 2.3: Past medical and ocular history 46
Table 2.3.7: Female diabetic patients who were pregnant 47
Table 2.3.8: Distribution of previous eye examination 48
Table 2.4.1 (a): Distribution of unaided visual acuity by eyes 48
Table 2.4.1 (b): Distribution of presenting visual acuity by eyes 49
Table 2.4.1 (c): Status of visual acuity among diabetic patients with and without DR 50
Table 2.4.2 (a): Status of diabetic retinopathy, by persons 51
Table 2.4.2 (b): Status of diabetic retinopathy, by eyes 51
Table 2.4.2 (c): Level of severity of diabetic retinopathy by eyes 52
Table 2.4.2 (d): Level of severity of maculopathy, by eyes 52
Table 2.5: Treatment plans 52
Table 3.1 (a): Number of contact lens-related corneal ulcer cases 54
Table 3.1 (b): Distribution of cases by centre 55
Table 3.2.1: Patient demography 56
Table 3.2.2: Sources of referral of the patients 57
Table 3.3.1: Affected eyes 58
Table 3.3.2: Duration of symptoms 58
Table 3.3.3: History of trauma 58
Table 3.3.4 (a): Types of contact lens worn at diagnosis 59
Table 3.3.4 (b): Contact lens wearing pattern at diagnosis 59
Table 3.3.4 (c): Types of cleaning solution used at diagnosis 59
Table 3.4.1: Vision at presentation 60
Table 3.4.2: Presumptive causative organisms 62
Table 3.4.3.1: Types of laboratory investigations performed 62
Table 3.4.3.2 (a): Culture results 63
Table 3.4.3.2 (b): Bacteria cultured from each type of laboratory investigation 63
Table 3.5.1: Vision by one month by one month 64
Table 3.5.2: Status of vision from presentation to one month after presentation 66
Table 4.1: Distribution of medical co-morbidity 68
Table 4.2: Types of antiglaucoma agents prescribed 69
Table 4.3: Number of eye drops prescribed per eye 69
Table 5.1: Number of MOH ophthalmology departments with census data 72
Table 1: Medical devices or equipment at ophthalmology clinics, MOH hospitals 80
Table 2: Medical devices in ophthalmology operating theater, MOH 82
Table 3: Facilities and medical devices at eight district hospitals with optometrists
Page
Figure 1.1: Stock and fl ow of cataract surgery 3
Figure 1.2.1: Percentdistribution of age among patients who had cataract surgery 5
Figure 1.2.2.1: Proportion of patients who underwent cataract surgery and have HPT, DM and IHD 6
Figure 1.2.2.5: Proportion of patients who had diabetic retinopathy, glaucoma and
lens-induced glaucoma 9
Figure 1.2.2.6 (a): Distribution of pre-operative visual acuity for patients operated in
2002, 2003, 2004, 2007 11
Figure 1.2.2.6 (b): Distribution of pre-operative unaided and refracted visual acuity by gender, 2007 11
Figure 1.2.2.7: Percentdistribution of planned refractive power, 2007 13
Figure 1.3.2: Number of surgeries done by month 15
Figure 1.3.6: Distribution of day care and in-patient for patients with cataract surgery by centre
(exclude children and those with combined surgery) in 2007 18
Figure 1.3.7: Trend in the proportion of type of cataract surgery from 2002 to 2007 19
Figure 1.3.9: Types of local anesthesia 21
Figure 1.3.10: IOL types 22
Figure 1.4.6: Rate of PCR by SDP in 2007 25
Figure 1.5.1.1: Rate of post-operative infectious endophthalmitis in 2007, by SDP 26
Figure 1.5.1.2: Rate for unplanned return to OT by SDP, 2007 27
Figure 1.5.3.2.1: Percent distribution post-operative unaided VA 6/12 or better among patients
without ocular co-morbidity, by surgery 30
Figure 1.5.3.2.2 (a): Percentage of post-operative refracted VA 6/12 or better among patients without
ocular co-morbidity, by surgery 31
Figure 1.5.3.2.2 (b): Percentage of post-operative refracted VA 6/12 or better among patients without
ocular co-morbidity, by SDP, 2007 32
Figure 1.5.4.1 (a): Percent distribution of planned and fi nal refractive power or spherical equivalent
for eyes with ECCE and phaco, 2007 38
Figure 1.5.4.2 (a): Percent distribution of the differences between planned and fi nal refractive
power for patients who had phaco, 2007 40
Figure 2.1.2: Percentage of patients registered by month, 2007 43
Figure 2.3.1: Systemic co-morbidities 47
Figure 3.1: Epidemiological curve for incidence of contact lens-related corneal ulcer, by week 54
Figure 3.2.1: Age distribution 57
Figure 3.4.1 (a): Distribution of unaided vision at presentation 61
Figure 3.4.1 (b): Distribution of vision with glasses at presentation 61
Figure 3.5.1 (a): Distribution of unaided vision by one month 65
Figure 3.5.1 (b): Distribution of vision with glasses by one month 65
Figure 3.5.2: Status of vision from presentation to one month after presentation 66
Figure 4.1: Distribution of occupation 68
Figure 5.1: Number of out-patients (total and new cases) seen at ophthalmology clinics,
2002-2007 72
Figure 5.2: Number of in-patients admitted to eye wards, 2002-2007 73
Figure 5.3: Number of ocular operations performed, 2002-2007 73
Figure 5.4: Number of cataract surgeries, ECCE and phacoemulsifi cation performed,
2002-2007 74
Figure 5.5: Percent distribution of ECCE and phacoemulsifi cation 74
Figure 5.6: Diabetic patients seen at ophthalmology clinics, 2002-2007 75
Figure 5.7: Proportion of new patients at eye clinics who came for diabetic eye screening,
2002-2007 75
Page
Figure 1: Distribution of fundus cameras at MOH hospitals 81
Figure 2: Distribution of argon laser machines at MOH hospitals 81
Figure 3: Distribution of operating microscopes at MOH hospitals 83
Figure 4: Distribution of phacoemulsifi cation machines at MOH hospitals 83
CATARACT SURGERY REGISTRY 2002 TO 2004 AND 2007
1. Stock and Flow
1.1. The number of SDP has increased from 25 in 2002 to 32 in 2007. For 2007, all the SDPs are ophthalmology departments from MOH hospitals. From 2009 onwards universities and private eye care centres will be invited to participate.
1.2. The total number of cataract surgery registered to CSR was 66,431 and it has increased over the years (12,552 in 2002, 16,039 in 2003, 17,536 in 2004, and 18,426 in 2007).
1.3. The ascertainment rates for MOH SDP, calculated based on census returns on the total number of cataract surgeries performed were satisfactory over the years (87.6% in 2002, 97.2% in 2003, 92.9% in 2004, 83.6% in 2007). With the launch of web application in 2007, where data entry is done by staff at SDP site, there is a decline in ascertainment rate.
1.4. Except for the year 2003, more than 80% of cataract surgeries registered have outcome data.
2. Characteris
i
cs of Pa
i
ents and Eyes to be Operated
2.1. The demographic features of patients who had cataract surgery at public hospitals over the 6 years were consistent, with a mean age of 64 years and slight female preponderance. However, there was a marked increase in patients older than 64 years in 2007 (54.2%), indicating a rise in the aging population and thus higher demand for cataract surgery.
2.2. Proportion of patients with systemic co-morbidity increased from 56.8% in 2002 to 67.5% in 2007. The commonest was hypertension (about half), followed by DM (about a third). Cataract surgeons need to take a holistic approach in assessing patients pre-operatively to ensure patients are fi t for surgery to avoid intra-operative and post-operative adverse events.
2.3. Most common cause of cataract was primary senile cataract (> 95% in all the years). Trauma was the most common cause for secondary cataract.
2.4. Over the years, only one third of patients returned for cataract surgery for the fellow eye. As senile cataract usually affect both eyes, patients should be encouraged to have second eye cataract surgery as binocular vision has better visual function.
2.5. Over the years, more than 95% of the eyes operated were not operated on before. In 2007, among eyes which had eye operation before, the commonest was vitreoretinal surgery (1.4%).
2.6. One third of the eyes to be operated have ocular co-morbidity, commonest were diabetic retinopathy and glaucoma. This pattern was consistent throughout the years.
2.7. The 4-year cumulative data showed that 58% of the eyes to be operated had unaided vision of worse than 3/60 which is classified as blind. Refraction was not done in 84.5% of the eyes, probably due to dense cataract. Among eyes refracted, 30% were still in blindness category. This finding may indicate that patients seek treatment when their vision are really bad, or surgeons decide to operate at a lower vision category, or patients’ vision get worse while waiting to have their surgery done. Public should be made aware that cataract surgery can be done whenever patients’ visual function is affected, especially when they are unable to perform activities of daily living, and old people should not accept poor vision as part of aging but should seek treatment early. With improved technology, doctors can now offer surgery based on patients’ impaired visual function rather than visual acuity measurement.
2.8. There was a consistent bimodal pattern of pre-operative vision over the years with one peak at the range between 6/18 to 6/36 and another peak at VA worse than 3/60. This may be due to the manner of vision taking. The worst vision that can be recorded at Snellen vision chart is 6/60. To get record of 5/60 to 1/60, patients have to be made to walk towards the vision charts and this may not be performed as it takes longer time. Staff who take VA should be adviced to adhere to proper procedure.
3. Cataract Surgery Prac
i
ce Pa
t
erns
3.1. The number of cataract surgeries done by SDPs varies greatly. In 2007, 48.3% of the SDPs performed less than 500 surgeries and 24.1% performed more than 1,000 cataract surgeries.
3.2. The average number of cataract surgery performed by all SDPs per month was about 1,500 cases in the year 2004 and 2007. However the number of surgery performed in January, February, October to December in each year was less than average. This pattern was consistent through the years. Evaluation on number of surgery and use of OT time should be done to optimize output.
3.3. More surgeries were done in states with more than one SDP and with denser population such as Selangor, Johor, Sarawak, Penang and Kedah.
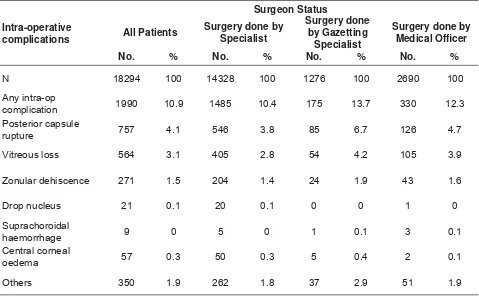
3.4. Specialists performed the most surgeries (2/3), followed by gazetting specialists and medical offi cers.
3.5. The average time taken to perform phaco and ECCE was 36.8 and 45.3 minutes respectively. Time taken can be shortened with improved skill and with newer phaco machine allowing surgeon to have better control.
3.6. Proportion of surgery performed as day care was less than 50%. As day care is certainly more cost effective than in-patient, and with more ambulatory care centers being established in public hospitals, more surgery should be done as day care.
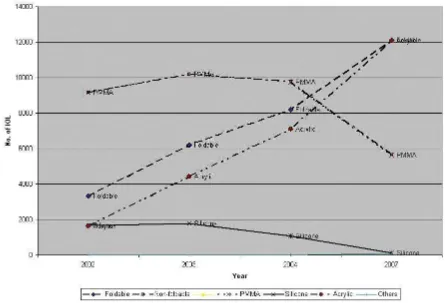
3.7. Over the last 6 years, we observed a transition from conventional large incision ECCE to the small incision phacoemulsification technique. Percentage of phaco increased from 39.7% in 2002 to 65.1% in 2007 and this proportion although encouraging, is small. Phaco is a safer surgery with lesser complication, has better outcome, and faster visual recovery. All cataract surgeons should master this skill so that it can be done in most cases.
3.8. The proportion of combined cataract surgery increased from 2.9% in 2002 to 4.8% in 2007. The commonest combination surgery was with vitreoretinal surgery. There is a marked decrease in combined fi ltering glaucoma surgeries over the years.
3.9. Over the years, more than 90% of cases were done under local anaesthesia, with subtenon injection (>50%) being the commonest approach. There was an increase in the use of topical anaesthesia from 2003 (11.7%) to 2007(28.3%). There was a decline in the use of sedation, although some SDPs employed it consistently.
3.10. For the year 2007, majority of the eyes (98%) had IOL implantation, with 97% PCIOL. Foldable IOL (68.1%), particularly made from acrylic, increased over the years and was the commonest IOL implanted (67.5%).
4. Intra-opera
i
ve Complica
i
ons
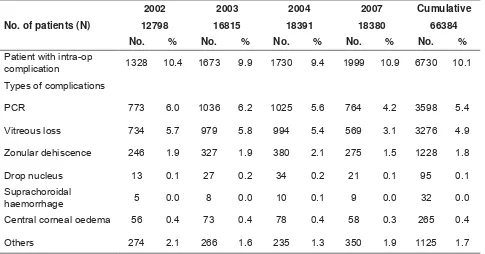
4.1 The four-year cumulative rate of intra-operative complication was 10.1%. The commonest was posterior capsular rupture (5.4%) and vitreous loss (4.9%).
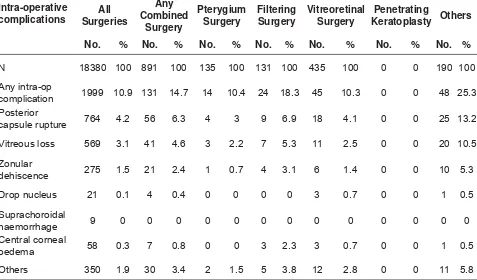
4.2 Intra-operative complications rates were higher in phaco conversion, ICCE and combined cataract surgery, especially with fi ltering surgery.
4.3 In 2007, 24 SDPs achieved the KPI standard set for PCR of below 5%.
5. Cataract Surgery Outcome
-1.1D (SD 1.4D). ECCE eyes showed a more myopic shift than phaco eyes. The mean difference between final and planned refractive power was -0.38D (SD 1.15D). Majority of eyes (71.1%) had difference between planned and final refractive power of within -1.0D to +1.0D.
5.6. The main contributing factor for eyes with post-operative refracted VA worse than 6/12 was pre-existing ocular co-morbidity, ranging from 47.2% in 2004 to 28.5% in 2007. The second common cause was high astigmatism.
DIABETIC EYE REGISTRY 2007
1. Stock and Fow
1.1. A total of 10,856 diabetic patients who were seen for the first time at MOH ophthalmology clinics and optometry clinics from January to December 2007 were registered to DER. The number of diabetic patients registered by SDP varied widely.
2. Characteris
i
c of Diabe
i
c Pa
i
ents
2.1. The mean age of patients registered was 57.2 years. About half (52.8%) were of working age group of between 30 and 60 years. There were slightly more female (54.6%) and Malay (54.0%) patients. 2.2. Patients’ mean age was similar for those with DR (56.7 years) and without DR (56.8 years).The
percentage of DR among males was 39.2% and females was 37.3%. The proportion of those with DR was similar in the different ethnicities, 39.7% among Malay, 38.4% among Chinese and 36.5% among Indians.
2.3. Government hospitals and primary care providers (91.7%) were the main source of referral and only 2% were referred from private care providers.
3. Medical History and Prac
i
ce Pa
t
ern
3.1. Majority of cases (92%) had type II DM.
3.2. Sixty-four percent of patients had diabetes for 10 years or less and 3.1% had diabetes for more than 20 years.
3.3. Eighty-two percent of the patients were on oral medication whilst 11.8% were on insulin.
3.4. Systemic co-morbidity - Hypertension (63.9%) was one of the commonest systemic co-morbidity among DM patients followed by hypercholesterolaemia (18.3%), ischaemic heart disease (11.1%), and 5.8% of diabetic patients who were first seen at ophthalmology clinics have renal impairment. 3.5. Of those screened, 9% were smokers.
3.6. For ocular co-morbidity – 44.2% was found to have cataract and 3.1% had glaucoma.
3.7. For pregnancy and eye examinations – 148 female (2.5%) patients were pregnant. Although clinical practice guideline recommends that pregnant diabetics should be assessed during the first trimester, only 41.2 % pregnant diabetics registered to DER had eye examinations during that time.
3.8. For previous eye examinations - 70.9% of patients never had their fundus examined before. Among those examined, 71.9% had it done one year ago.
4. Eye Status
4.1. About 40% of the eyes had presenting visual acuity worse than 6/12, and 9% had vision at blindness category. Among eyes with DR, 8% had vision in blindness category.
4.2. Among patients screened, 60.4% had no apparent DR in both their eyes. Up to 38.2% patients had some form of DR in either eye and 11.9% of them had maculopathy.
1. Stock and Flow
1.1 A total of 103 patients were found to have contact lens-related corneal ulcer (CLRCU) in 2007. Six patients had it in both their eyes (a total of 109 eyes).
1.2 The highest number reported was in January (19 cases) and lowest number was in the month of October (one case). The average number per month was eight cases. The distribution of cases in 2007 did not reveal any outbreak of contact lens-related corneal ulcer seen at the MOH Hospitals.
2. Characteris
i
c of Pa
i
ents and Contact Lens Wearing Prac
i
ce
2.1 The mean age of affected patients was 26.7 years and 71.8% was female.
2.2 All the patients wore soft contact lens. Majority wore the monthly disposable types (83.5%) and 5.5% wore daily disposable types. Among them, 62.4% removed their lens before sleep but 30.3% wore them overnight.
2.3 Bausch & Lomb and Allergan was the commonly reported brands of cleaning solution. There were three patients (2.8%) who used tap water to clean their contact lens and 24 patients (22.0%) could not recall type of cleaning solutions used. As the types and proportion of cleaning solutions sold in Malaysia were not known, we could not determine which cleaning solution was associated with CLRCU.
3. Eye Status and Causa
i
ve Organism
3.1 Bacteria was the most common presumptive organism (79.8% of cases) and it was confi rmed to be the causative organism in 37.4% of the corneal scrapping samples.
3.2 Corneal scrapings of 91 eyes (83.5%) were sent for microbiology investigations, of which half (49.5%) had no yield. Among 34 culture proven cases, 33 were bacteria, one fungus and one acanthamoeba. Among bacteria cultured, pseudomonas (79.5%) was the commonest, followed by enterobacter (8.9%).
4. Treatment Outcome
4.1 Eighteen patients had presenting vision with glasses of worse than 3/60 (legally blind). One month post- onset, 56.6% of the eyes had best corrected vision better than 3/60 but four eyes (3.7%) were legally blind.
4.2. None of the affected eyes had perforation or required any surgical intervention such as penetrating keratoplasty, evisceration or surgical glue.
GLAUCOMA REGISTRY - PRELIMINARY REPORT 2007
1. The preliminary report had 1,155 patients registered to the glaucoma registry.
2. Eighty-eight percent of the eyes had primary glaucoma, mainly primary open angle glaucoma (55%). 3. About 80% of the patients were on medical treatment. Among the eyes treated with anti-glaucoma drug,
CHAPTER 1
CATARACT SURGERY REGISTRY 2002-2004
AND 2007
Contributing Editors
Dr. Goh Pik Pin
Dr. Loh Swee Seng
1.1 STOCK AND FLOW
The number of CSR source data producers increases from 25 in 2002 to 32 in 2007. Majority were MOH ophthalmology departments. For the year 2002 to 2004, SDPs included Klinik Mata Azman, Angkatan Tentera Kem Hospital Terendak and Hospital Universiti Sains Malaysia and for the year 2004, Hospital Universiti Kebangsaan Malaysia also participated. In 2007, as CSR was piloting its on-line registry using web application, data were collected in MOH ophthalmology departments only. From 2009 onwards, universities, army hospitals and private eye care centers will be invited to participate.
The total number of cataract surgery registered to CSR over the years was 66,431. It increased from 12,768 in 2002 to18,426 in 2007. As one of the objectives of CSR is to monitor cataract surgery outcome, the proportion of patients registered with outcome data were satisfactory, above 85% in all the years except for the year 2003 (33.9%).
Using MOH cataract surgery census as denominator, the proportion of cataract surgeries performed at MOH hospitals that were registered to CSR was more than 90% in 2003 and 2004, while it reduced to 83.6% in 2007. The reduced ascertainment rate in 2007 may be due to the change from paper-based to web-based CSR. Evaluation was done and strategies to improve ascertainment such as provision of computers, internet lines and data entry personal in some SDPs are being implemented.
Table 1.1 (a): Stock and fl ow of cataract surgery
2002 2003 2004 2007 All
Number of SDP 25 32 33 32
Total number of cataract surgery registered to CSR
12798 16815 18392 18426 66431
Number of patients with post-operative vision recorded in CSR
12512 14683 6228 15786 49209
% Patient with post-operative vision recorded in CSR
97.7% 87.3% 33.9% 85.7% 74.1%
Table 1.1 (b): Ascertainment rate for MOH SDPs
2002 2003 2004 2007 All
Total number of cataract surgery performed at MOH hospitals (Source: MOH census returns)
14316 16498 18884 22051 71749
Total number of cataract surgery performed at MOH hospitals and registered to CSR
12552 16039 17536 18426 64553
Figure 1.1: Stock and fl ow of cataract surgery
1.2 CHARACTERISTICS OF PATIENTS
1.2.1 Patient demography
The mean age for patients who had cataract surgery was 64 years. The youngest was about one month and the oldest was 104 years old. Patients who were older than 54 years ranged from 82 % in 2003 to 93% in 2007. The percentage of patients older than 74 years rose markedly from 18.0% in 2002 to 54.2% in 2007. This may either be due to delay in patients’ seeking surgical treatment or an increase in the proportion of older population. With this demographic change, eye care providers must be prepared to face the increasing demand for cataract surgery.
Table 1.2.1: Age and gender distributions
Year 2002 2003 2004 2007
No. of patients (N) 12798 16815 18392 18426
Age
Mean (years) 64.0 63.7 63.5 64.3
Median (years) 66 66 66 66
Minimum (month) 1 month 1 month 1 month 1 month
Maximum (years) 97 100 104 97
% Distributions of age group, years
<1 years 0.2 0.1 0.3 0.3
1-14 years 1.0 1.0 1.0 0.1
15-24 years 1.0 1.0 1.0 0.8
25-34 years 1.0 1.0 1.0 0.7
35-44 years 3.0 3.0 3.0 0.9
45-54 years 12.0 12.0 12.0 2.7
55-64 years 27.0 27.0 27.0 11.5
65-74 years 38.0 39.0 38.0 27.3
75-84 years 16.0 15.0 15.0 38.5
>=85 years 2.0 2.0 2.0 15.7
Missing na na na 1.5
% 65 years and older 18 17 17 54.2
Gender
% Female 51.0 50.0 51.0 52.1
Gender ratio for Malaysian population more
Figure 1.2.1: Percentdistribution of age among patients who had cataract surgery
0 .0 5 .0 1 0 .0 1 5 .0 2 0 .0 2 5 .0 3 0 .0 3 5 .0 4 0 .0 4 5 .0
< 1 ye a rs 1 -1 4 ye a rs 1 5 -2 4 ye a rs 2 5 -3 4 ye a rs 3 5 -4 4 ye a rs 4 5 -5 4 ye a rs 5 5 -6 4 ye a rs 6 5 -7 4 ye a rs 7 5 -8 4 ye a rs > = 8 5 ye a rs
Ag e ( Ye a r s )
%
2 0 0 2 2 0 0 3 2 0 0 4 2 0 0 7
1.2.2 Medical history
1.2.2.1 Systemic co-morbidity
Majority of the patients who came for cataract surgery had systemic co-morbidity. The proportion increased from 56.8% in 2002 to 67.5% in 2007, a linear increment of 10.7% over the last 6 years. This trend was in tandem with the increase in chronic diseases prevalence as shown in the National Health and Morbidity Survey (Prevalence of hypertension among those age >30 years was 32.9% in 1996, 42.6% in 2006; prevalence of DM among those age >30 years was 8.3% in 1996, and increased to 14.9% in 2006). The proportion of patients with ischaemic heart disease was consistent at 9% over last 6 years.
Table 1.2.2.1: Percent distribution of systemic co-morbidity
Year 2002 2003 2004 2007
No. of patients (N) 12798 16815 18392 18426
Percentage of patients with any systemic
co-morbidity 56.8 59.1 59.9 67.5
Percentage of patients with specifi c systemic co-morbidity*
% Hypertension 35.4 38.1 40.4 46.8
% Diabetes Mellitus 28.9 30.5 31.5 37.3
% COAD**/Asthma 5.2 5.4 5.2 4.3
% Ischaemic Heart Disease 9.0 9.1 9.7 9.1
% Renal Failure 1.6 1.8 1.9 2.5
% Cerebrovascular accident 0.8 1.0 0.9 0
% Others 7.3 7.2 4.7 7.6
Note: *Patients may have more than one type of systemic co-morbidity **COAD = Chronic Obstructive Airway Disease
1.2.2.2 Causes of cataract
Majority (more than 95%) had primary cataract. Among eyes with primary cataract, senile- or age-related cataract was the commonest. Among the secondary cataract, trauma was the commonest cause followed by those induced by surgery.
Table 1.2.2.2: Causes of cataract
Causes Of Cataract 2002 2003 2004 2007
No. of patients (N) 12793 16815 18392 18426
Primary Cataract (%) 96.1 96.1 96.2 94.4
Secondary Cataract (%) 3.9 3.9 3.8 3.0
Missing value (%) - - - 2.5
Primary Cataract (n) 12294 15623 17697 17410
Senile/age related (%) 97.3 96.7 97.7 98.1
Development (%) 1.3 2.0 1.2 1
Congenital (%) 1.1 1.1 1 0.7
Others (%) 0.4 0.3 0.1 0.2
Secondary Cataract (n) 499 654 695 557
Trauma (%) 65.1 61.0 63.3 63.7
Surgery induced (%) 4.6 10.2 8.1 14.7
Drug induced (%) 10.6 12.4 12.1 9.9
Others (%) 19.6 16.4 16.5 11.7
1.2.2.3 First or second eye cataract surgery
More than 2/3 of patients came for fi rst eye cataract surgery. In 2007, those who came back for cataract surgery in the fellow eye or second eye surgery waited for about 23 months to have it done.
Table 1.2.2.3: First or second eye cataract surgery
2002 2003 2004 2007
No. of patients (N) 12798 16815 18392 18426
First eye surgery (%) 70 70.5 70.2 69.5