THIS REPORT CONTAINS ASSESSMENTS OF COMMODITY AND TRADE ISSUES MADE BY USDA STAFF AND NOT NECESSARILY STATEMENTS OF OFFICIAL U.S. GOVERNMENT POLICY
This is Posts’ first report on the Zambia sugar industry. The sugar industry has grown significantly since
its establishment in 1964. Zambia Sugar Plc is the most dominant company contributing about 92.5% of the total sugar production in Zambia. Post estimates that the Zambia sugar cane crop will decrease by three percent to 3,250,745 MT in the 2016/17 MY, due to drought conditions in the sugar growing areas and power interruptions which restricted irrigation. Sugar production will decrease by six percent to 388,405 MT in the 2016/17 MY, due to the decrease in sugarcane delivered for processing at the mills and the lower quality of sugarcane crushed during the season. Zambia`s exports are mainly to Africa and the European Union (EU). Sugar imports are minimal. Zambia does not benefit from the U.S raw sugar tariff-rate quotas (TRQ).
Wellington Sikuka Kyle Bonsu Sugar
The supply and demand for sugar in Zambia
PretoriaZambia
9/7/2017 Public
Commodities:
Sources:
Zambia Sugar Plc - https://www.illovosugarafrica.com/About-Us/Zambia/Zambia-Sugar-Plc SADC Sugar Digest - http://www.sadcsugardigest.com/
Zambia Revenue Authority - https://www.zra.org.zm/ Global Trade Atlas (GTA)
MT – Metric Tons
MY – Marketing Year (April to March)
Background
Sugarcane in Zambia is grown under irrigation in the Northern and Southern parts of the country. Miller owned estates contribute about sixty percent of the total sugarcane production, and forty percent of the sugarcane production is from independent farmers and out grower schemes. Figure 1 below, shows the three main sugarcane growing areas in Zambia, namely, Nakambala, Kafue and Kalungwishi. The marketing year for sugar production is from April to March.
Figure 1: Sugarcane Production Areas in Zambia
Source: SADC Sugar Digest Sugar, Centrifugal
The sugar industry plays an important role in the Zambian economy. In 2016, the sugar sector
contributed about three percent to Zambia`s Gross Domestic Product (GDP) and six percent to the total national exports. The development of the Zambia sugar industry was a joint effort from the British based multinational company Tate & Lyle, and the government. Prior to 1964, there was only one sugar
refinery in Zambia, named Ndola Sugar Refinery which imported raw sugar from Zimbabwe and Mozambique for further processing. The establishment of the Nakambala Sugar Estate in 1964 by Tate & Lyle and the government marked the beginning of the sugar cane industry in Zambia. In 1965, the Zambia Sugar Company took over the ownership of the Nakambala Sugar Estate and Ndola Sugar Refinery. The Zambia Sugar Company was 80% owned by Tate & Lyle; 12% owned by the Industrial Development Corporation (Government Agency), and 8% owned by private shareholders. The
Nakambala Sugar Estate started with an experimental pilot scheme involving only 50 hectares of planted land. Full scale operations began in 1968, when 173,514 tons of sugar cane was produced from 1,380 hectares. By the end of 1971, the Nakambala Sugar Estate supplied about 70% of the Zambia sugar requirement. Following the government policy of nationalization in the early 1970s, the Industrial Development Corporation shareholding increased to 51% in 1974, and thereafter to 78% in 1984. Sugar production grew largely on the basis of high demand in the local market, and exports only started after 1980 when Zambia started producing surplus sugar.
From the mid-1980s to the 1990s, the Zambia economy underwent serious challenges and political pressure which resulted in the government pursuing a nationwide privatization policy in the mid-1990s. The growth of sugar production also remained stagnant during this period. During the privatization period in 1994, Tate & Lyle and the Commonwealth Development Corporation repurchased the Zambia Sugar Company from the government and became the majority shareholders. In 1996, the Zambia Sugar Company was listed on the Lusaka Stock Exchange and changed its name to Zambia Sugar Plc. In 2001, Tate & Lyle sold its 89% shareholding to Illovo Sugar Pty Ltd. In the year 2001 and 2006, new
privately owned sugar milling companies were also established, namely, Kalungwishi Kasama Sugar and Kafue Sugar, respectively. These developments together with increased investments contributed to the growth of the sugar industry in Zambia.
Sugar cane:
Production
Post estimates that the Zambia sugar cane crop will decrease by three percent to 3,250,745 MT in the 2016/17 MY, from 3,353,217 MT in the 2015/16 MY due to drought conditions in the sugar growing areas, lower yields and power interruptions which restricted irrigation. Sugar cane production has generally declined from the 2014/15 MY to date, due to the past seasons drought conditions and lower yields.
Figure 2 below shows the historic sugarcane production statistics. The production trends in the Zambia
between 2001 and 2017, based on two new sugar companies established in 2001 (Kalungwishi Kasama Sugar) and 2006 (Kafue Sugar), as well as increased investments and capacity by the Zambia Sugar Plc. Other fluctuations in sugar cane production within these three phases are mainly weather related, namely droughts and sugar cane yields.
Figure 2: Historic Sugarcane Production
Source: Zambia Sugar Plc and Post calculations
Table 1: PSD Table for sugarcane
Sugar Cane for Centrifugal 2014/2015 2015/2016 2016/2017
Market Begin Year Apr 2014 Apr 2015 Apr 2016
Zambia USDA Official New Post USDA Official New Post USDA Official New Post
Area Planted 18,320 18,252 0 18,100
Area Harvested 17,954 17,886 0 17,626
Production 3,694,240 3,353,217 0 3,250,745
Total Supply 3,694,240 3,353,217 0 3,250,745
Utilization for Sugar 3,694,240 3,353,217 0 3,250,745
Utilizatn for Alcohol 0 0 0 0
Total Utilization 3,694,240 3,353,217 0 3,250,745
Sugar:
Production
Post estimates that sugar production will decrease by six percent to 388,405 MT in the 2016/17 MY, from 411,279 MT in the 2015/16 MY due to the decrease in sugarcane delivered for processing at the mills and the lower quality of sugarcane crushed during the season.
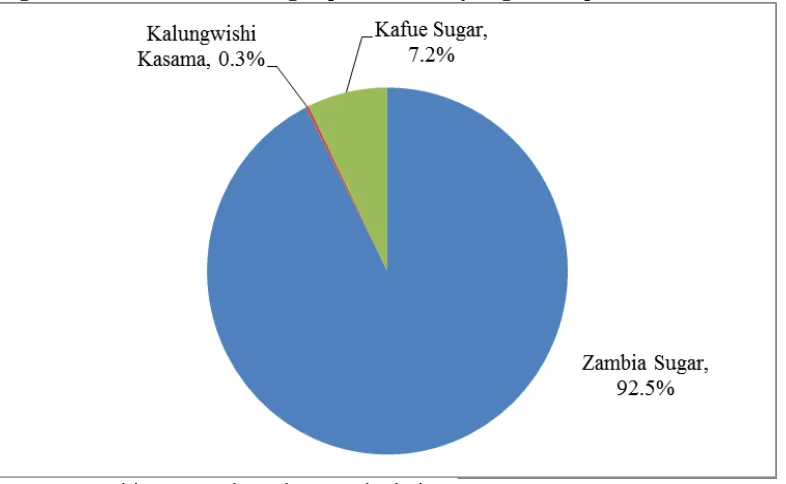
The Zambia sugar industry is dominated by three sugar milling companies, namely Zambia Sugar Plc, Kafue Sugar (Consolidated Farming Ltd) and Kalungwishi Kasama Sugar. Zambia Sugar Plc is the most dominant company contributing about 92.5 % of the total sugar production, and its majority shareholder is Illovo Sugar Pty Ltd (South African based Sugar Company). Figure 3 below shows that Kafue Sugar and Kalungwishi Kasama Sugar, both privately owned companies, contribute about 7.2% and 0.3% to the total sugar production, respectively.
Figure 3: Contribution of sugar production by sugar companies in Zambia
Source: Zambia Sugar Plc and Post calculations
Figure 4 below shows the historic sugar production statistics since 1987. The historic sugar production
trends follows similar trends to sugar cane production as explained previously in Figure 2 above.
Source: Zambia Sugar Plc and Post calculations
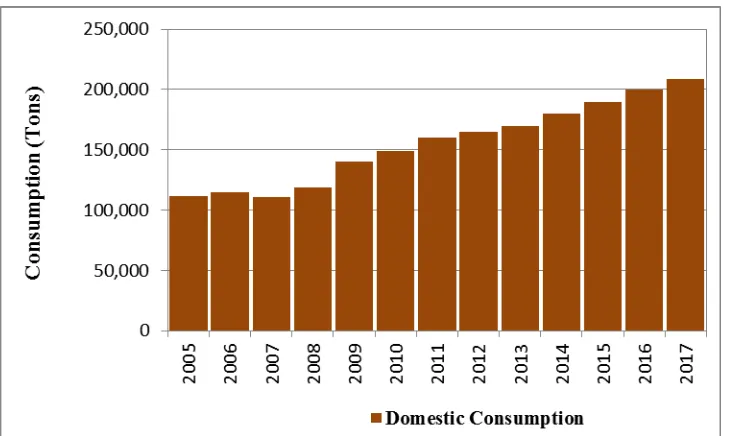
Consumption
Post estimates that domestic consumption will increase by five percent to 209,000 MT in the 2016/17 MY, from 200,000 MT in the 2015/16 MY, based on the increase in the utilization of bottler grade sugar by the beverage and food manufactures who are experiencing increased demand for their products. Zambia has also increased the production and quality of bottler grade sugar following the recent investments in a sugar refinery by Zambia Sugar Plc. The increase in domestic consumption was
partially offset by the drop in domestic sales due to the declining disposable income levels. Zambia has a low per capita consumption of sugar averaging about 12.4 kg, mainly due to the low consumption in the rural areas. Less than 29% of households in rural areas consumed sugar regularly. Sugar sold for direct consumption in Zambia is fortified with vitamin A, under the government mandatory fortification legislation to combat vitamin A deficiency.
Source: Zambia Sugar Plc and Post calculations
Exports
Post estimates that exports will increase by six percent to 209,280 MT in the 2016/17 MY, from 197,000 MT in the 2015/16 MY, based on the available stock, and an increase in regional exports following low supply from drought affected South Africa and Swaziland, Zambia`s main competitors in the region. The increase in exports is also driven by the growth in regional manufactures and an increase in refined sugar exports to the Democratic Republic of Congo (DRC). Zambia has been prioritizing increasing exports of high value products especially to the DRC. Zambia exports sugar to EU markets under the Everything But Arms Arrangement, which allows exports from least developed countries to have duty-free, quota-free access to the EU markets. Zambia does not benefit from the U.S raw sugar tariff-rate quotas (TRQ) because the TRQ allocations are based on historical shares of exports to the United States between 1975 and 1981. Zambia did not export any sugar to the United States during this period, hence its exclusion.
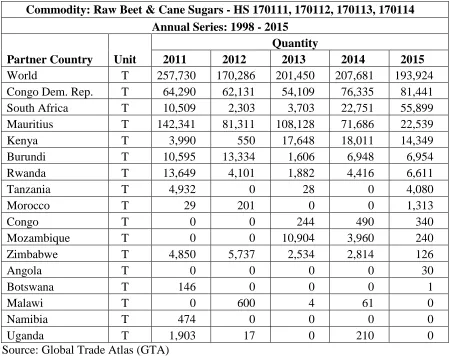
Table 2: Raw Sugar Exports by country
Commodity: Raw Beet & Cane Sugars - HS 170111, 170112, 170113, 170114 Annual Series: 1998 - 2015
Partner Country Unit
Source: Global Trade Atlas (GTA)
Table 3: Refined Sugar Exports by country
Zambia Export Statistics
Commodity: Refined Sugar - HS170199, 170191 Annual Series: 1998 - 2015
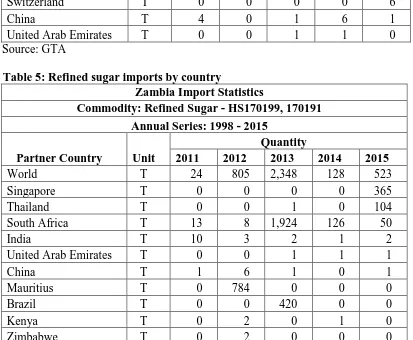
Zambia only imports a minimal amount of sugar because domestic production can satisfy local demand. However, there are reports that there are increasing cases of illegal imports which are not reflected on official trade statistics due to unsecured borders.
Table 4: Raw sugar imports by country
Zambia Import Statistics
Commodity: Raw Beet & Cane Sugars - HS 170111, 170112, 170113, 170114 Annual Series: 1998 - 2015
Partner Country Unit
Table 5: Refined sugar imports by country
Zambia Import Statistics
Commodity: Refined Sugar - HS170199, 170191 Annual Series: 1998 - 2015
Post estimates that the closing stocks will decrease by eighteen percent to 140,111 MT in the 2016/17 MY, from 171,816 MT in the 2015/16 MY, based on the increased utilization of the available stocks for exports and lower production during the 2016/17 MY.
Table 6: PSD Table for sugar
Sugar, Centrifugal 2014/2015 2015/2016 2016/2017 Market Begin Year April 2014 April 2015 April 2016
Zambia USDA Official New Post USDA Official New Post USDA Official New Post
Beginning Stocks 115,275 159,505 171,816
Vitamin A deficiency is a recognized public health concern in Zambia and in 1998 the government introduced mandatory sugar fortification with vitamin A, at a target of 10 mg/kg. While sugar millers and processors have undertaken commitments to comply with the mandatory sugar fortification in Zambia, they have a challenge of the high cost of fortificant. Concerns have also been raised on the potential for excess Vitamin A intake, poisoning or infertility, as well as the limited government
resources or capacity for monitoring, evaluating and enforcing compliance. There are also arguments on the possible ineffectiveness of Vitamin A fortification in sugar, based on research showing that while about 53% of urban households consumed sugar, only about 29% of households in rural areas consumed sugar regularly.
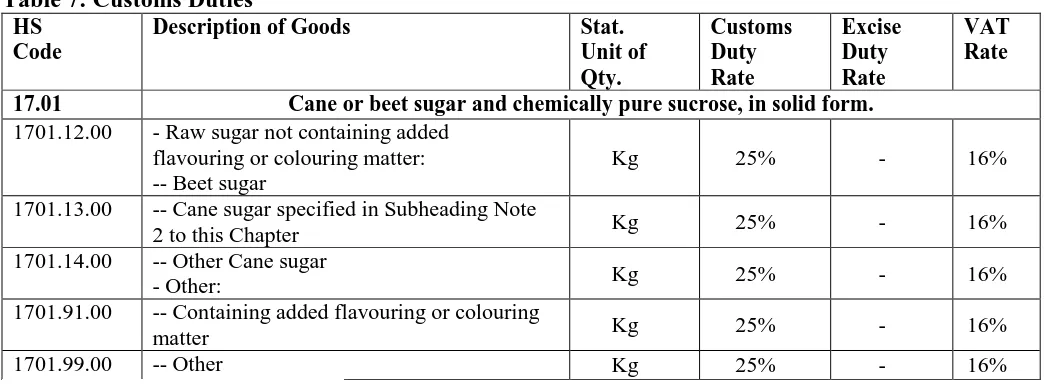
Zambia applies tariffs on the cost, insurance and freight (CIF) basis. Zambia’s tariff schedule is structured around four tiers: 0 %, 5 %, 15% and 25 % rates of duty. All raw materials and most industrial or productive machinery fall within the 0% and 5% tariff categories. Most imported
intermediate goods are subject to 15% and imported final products are subject to a 25% duty. Members of the Southern African Development Committee (SADC) can export duty free to Zambia. Table 7 below shows the import duties and VAT applicable to sugar imports.
Table 7: Customs Duties
17.01 Cane or beet sugar and chemically pure sucrose, in solid form.
1701.12.00 - Raw sugar not containing added flavouring or colouring matter: -- Beet sugar
Kg 25% - 16%
1701.13.00 -- Cane sugar specified in Subheading Note
2 to this Chapter Kg 25% - 16%
1701.14.00 -- Other Cane sugar
- Other: Kg 25% - 16%
1701.91.00 -- Containing added flavouring or colouring
matter Kg 25% - 16%
1701.99.00 -- Other Kg 25% - 16%
Source: Zambia Revenue Authority
Import and Export requirements
Import licensing is required for most agricultural products including sugar and its related products. In addition, food imports must comply with the provisions of the Food and Drugs Act of September 1978. The Food and Drugs Act regulates the packaging and labeling of food, and sets their respective
standards. The Act can be downloaded from the pdf link below. Sanitary and phytosanitary regulations also apply to imports of live animals, plants and seeds. As a result, a phytosanitary certificate is required for the import or export of sugar cane in Zambia.
Food and Drugs Act of September 1978