Oracle® Fusion Middleware
User's Guide for Oracle Business Intelligence Discoverer Plus
11
g
Release 1 (11.1.1)
B40105-02
April 2010
Oracle Fusion Middleware User's Guide for Oracle Business Intelligence Discoverer Plus, 11g Release 1 (11.1.1)
B40105-02
Copyright © 1999, 2010, Oracle and/or its affiliates. All rights reserved.
This software and related documentation are provided under a license agreement containing restrictions on use and disclosure and are protected by intellectual property laws. Except as expressly permitted in your license agreement or allowed by law, you may not use, copy, reproduce, translate, broadcast, modify, license, transmit, distribute, exhibit, perform, publish, or display any part, in any form, or by any means. Reverse engineering, disassembly, or decompilation of this software, unless required by law for interoperability, is prohibited.
The information contained herein is subject to change without notice and is not warranted to be error-free. If you find any errors, please report them to us in writing.
If this software or related documentation is delivered to the U.S. Government or anyone licensing it on behalf of the U.S. Government, the following notice is applicable:
U.S. GOVERNMENT RIGHTS Programs, software, databases, and related documentation and technical data delivered to U.S. Government customers are "commercial computer software" or "commercial technical data" pursuant to the applicable Federal Acquisition Regulation and agency-specific supplemental regulations. As such, the use, duplication, disclosure, modification, and adaptation shall be subject to the restrictions and license terms set forth in the applicable Government contract, and, to the extent applicable by the terms of the Government contract, the additional rights set forth in FAR 52.227-19, Commercial Computer Software License (December 2007). Oracle USA, Inc., 500 Oracle Parkway, Redwood City, CA 94065.
This software is developed for general use in a variety of information management applications. It is not developed or intended for use in any inherently dangerous applications, including applications which may create a risk of personal injury. If you use this software in dangerous applications, then you shall be responsible to take all appropriate fail-safe, backup, redundancy, and other measures to ensure the safe use of this software. Oracle Corporation and its affiliates disclaim any liability for any damages caused by use of this software in dangerous applications.
Oracle is a registered trademark of Oracle Corporation and/or its affiliates. Other names may be trademarks of their respective owners.
Contents
Preface
... xviiIntended Audience... xvii
Documentation Accessibility ... xvii
Oracle BI Discoverer Keyboard Navigation ... xviii
Related Documents ... xviii
Conventions ... xviii
JGoodies License Agreement... xviii
Part I
Getting started
1
Introducing Oracle Business Intelligence Discoverer
What is Oracle BI Discoverer?... 1-1
Why should I use Oracle BI Discoverer?... 1-2
How do I access information using Oracle BI Discoverer?... 1-3
What is a typical workflow with Oracle BI Discoverer?... 1-3 Stage 1: Getting the data you want... 1-4 Stage 2: Analyzing data... 1-4 Stage 3: Sharing data with other people ... 1-4
What are the different components of Oracle BI Discoverer?... 1-5
Who is the Discoverer manager and what do they do?... 1-6
2
Using Discoverer Plus with a relational data source
What is Discoverer Plus Relational?... 2-1
What is a relational data source?... 2-2
What are business areas?... 2-4
What are folders?... 2-5
What are items?... 2-6
What is the Discoverer Plus Relational sample database?... 2-7
What are the new features in Discoverer Plus 11.1.1?... 2-8
Where can I find out more about Discoverer Plus Relational?... 2-8
3
Using Discoverer Plus with a multidimensional data source
How can I tell when I am using Discoverer Plus with a multidimensional data source?... 3-1
What is online analytic processing (OLAP)?... 3-2
What are multidimensional data sources?... 3-3
What are multidimensional cubes?... 3-3
What are measures?... 3-4
What are dimensions and dimension members?... 3-5
What are dimension hierarchies?... 3-5
What are dimension attributes?... 3-6
About aggregating and filtering multidimensional data... 3-6
About applying filters after aggregating multidimensional data... 3-6
About filters and dimensions... 3-7
What is the Discoverer Catalog?... 3-7
About the Discoverer Plus OLAP Tutorial... 3-8
Where can I find out more about Discoverer Plus OLAP?... 3-8
4
Starting Discoverer
What is a Discoverer connection?... 4-1
About starting Discoverer... 4-2
How to display the Discoverer Plus connections page... 4-2
How to start Discoverer using an existing connection... 4-3
How to start Discoverer by connecting directly... 4-4
How to exit Discoverer Plus... 4-4
Frequently asked questions... 4-5 What is the End User Layer (EUL)?... 4-5 What are database accounts?... 4-5 How do I create and save login information in a Discoverer connection?... 4-6 How do I edit a Discoverer connection?... 4-7 How do I delete a Discoverer connection? ... 4-8 What are public connections?... 4-8 What are user-defined connections? ... 4-9 When and why should I change my password? ... 4-9 How do I change the password for a connection? ... 4-9 How do I change the End User Layer for a Discoverer connection?... 4-10 What is Single Sign-on?... 4-10 What is the difference between Single Sign-on and Discoverer passwords?... 4-10 How do I know what Single Sign-on ID is being used in Discoverer Plus?... 4-11
5
About the Discoverer Plus Relational work area
About the work area... 5-1
About Discoverer’s drag and drop features... 5-3 About dragging and dropping items in the Discoverer work area ... 5-3 About repositioning items in the Discoverer work area ... 5-3
About Discoverer menus... 5-4 About the Standard Discoverer menu ... 5-4 About Discoverer’s right-click menus... 5-4
About the Graph toolbar... 5-5 About the Available Items toolbar ... 5-6 About the Selected Items toolbar ... 5-6 About tool tips ... 5-6
About icons used in the Discoverer item navigator... 5-7
What are axis items?... 5-8
About data points... 5-9
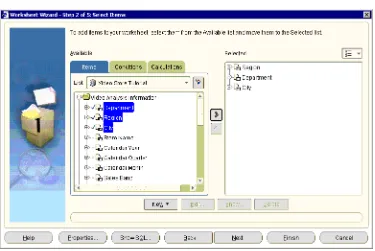
What is the Discoverer Worksheet Wizard?... 5-9
6
Using workbooks and worksheets
What are workbooks?... 6-2
What are worksheets?... 6-3
About Discoverer worksheet types... 6-4
About table worksheets... 6-4
About crosstab worksheets... 6-4
About designing workbooks for maximum performance... 6-4
How to open workbooks... 6-5
About opening workbooks in a non-Oracle database... 6-7
How to edit workbooks... 6-8
About saving a workbook to the database... 6-8
How to save workbooks... 6-8
How to copy workbooks... 6-10
How to delete workbooks from the database... 6-10
About worksheet titles and text... 6-11
How to create or edit worksheet titles or text... 6-12
How to display or hide worksheet titles or text... 6-14
How to rename worksheets and workbooks... 6-14
How to re-order worksheets within a workbook... 6-15
How to refresh worksheets... 6-16
How to delete worksheets... 6-16
How to find data in a worksheet... 6-16
About creating new workbooks... 6-17
How to create new workbooks... 6-18
How to add worksheets to a workbook... 6-21
How to view and update a workbook’s properties... 6-22
About worksheet properties... 6-23
How to view and edit worksheet properties... 6-23
7
Editing worksheets and worksheet items
About editing worksheets... 7-1
How to edit worksheets using the Edit Worksheet wizard... 7-2
How to add items to worksheets... 7-3
How to create new worksheet items... 7-4
How to remove items from worksheets... 7-5
How to duplicate a worksheet... 7-6
How to set the currency symbol for numeric items... 7-9
How to change the format of worksheet item headings... 7-11
How to change the text in item headings... 7-12
8
Creating graphs in Discoverer
What is a Discoverer graph?... 8-1
About using graphs in Discoverer... 8-2
About components of a Discoverer graph... 8-4
About graph types and sub-types... 8-5
About graph types available in Discoverer... 8-5
Notes about creating bubble graphs... 8-6
Notes about creating high-low-close stock graphs... 8-7
Notes about creating dual-Y graphs... 8-8
Notes about creating pie graphs... 8-9
How to edit a graph... 8-10
How to hide and display a graph... 8-15
How to change the position of a graph... 8-16
Part II
Analyzing data
9
Pivoting data
About pivoting worksheet items... 9-1
About pivoting data on a crosstab worksheet... 9-3
How to pivot worksheet items in the Discoverer work area... 9-4
How to pivot worksheet items using the Edit Worksheet dialog... 9-5
About unexpected results with pivoting... 9-6
10
Drilling to analyze data
About drilling in Discoverer worksheets... 10-1
What are drill hierarchies?... 10-2
How to drill up and down... 10-3 How to drill up and down using a drill icon in worksheet data ... 10-3 How to drill up and down using a graph label in graph data ... 10-5 How to drill up and down using the Drill dialog ... 10-6
About drilling to related items... 10-7
How to drill to a related item... 10-8 About user defined drill links ... 10-13 About drill links defined by the Discoverer manager ... 10-14 About using drill links... 10-15
How to create drill links to Internet URLs ... 10-18
How to use drill links... 10-20 How to drill out to a worksheet or Internet URL using a drill link icon ... 10-20 How to drill out to a worksheet or Internet URL using the Drill dialog ... 10-21
11
Using parameters
What are parameters?... 11-1
What are the benefits of using parameters?... 11-2
About using parameters... 11-2
About creating parameters... 11-2
About using parameters to collect dynamic user input... 11-3
About filtering lists of parameter values based on selected conditions (cascading parameters)... 11-3
How to set parameters... 11-5
How to activate parameters... 11-6
How to deactivate parameters... 11-7
How to create parameters... 11-8
How to delete parameters... 11-11
Examples of parameters... 11-12 Example 1: Using a parameter to filter a worksheet ... 11-12 Example 2: Using a parameter that enables multiple values to filter a worksheet ... 11-13 Example 3: Using a parameter to collect dynamic user input ... 11-14
12
Using conditional formatting
What is conditional formatting?... 12-1 What is a conditional format? ... 12-1 What is a stoplight format?... 12-2
About managing conditional formatting... 12-2
Notes on using conditional formats and stoplight formats... 12-4
How to activate and deactivate conditional formats and stoplight formats... 12-4
How to create conditional formats... 12-5
How to create stoplight formats... 12-7
How to edit conditional formats and stoplight formats... 12-9
How to delete conditional formats and stoplight formats... 12-10
How to change the color of stoplight formats... 12-11
Examples of conditional formatting... 12-12 Example 1: Conditional format to highlight Profit SUM values greater than 30000 ... 12-12 Example 2: Stoplight format to categorize Profit SUM values on a table worksheet ... 12-13 Example 3: Stoplight format to categorize hidden Profit SUM values on a crosstab worksheet ... 12-14
13
Using conditions
What are conditions?... 13-1
What are multiple conditions?... 13-2
What are nested conditions?... 13-2
About applying more than one condition... 13-3
How to activate and deactivate existing conditions... 13-3
How to create single conditions... 13-5
How to create multiple conditions... 13-7
How to create nested conditions... 13-9
How to edit conditions... 13-10
How to delete conditions... 13-11
Notes on how Discoverer applies conditions to roll-ups... 13-12
Example of how Discoverer applies conditions to roll-ups... 13-12
Examples of conditions... 13-13
14
Using totals
What are totals?... 14-1
About totals on worksheets... 14-2
About SUM and Cell SUM... 14-2
When to use SUM instead of Cell SUM... 14-3 Example - using SUM to calculate the average sales per employee ... 14-3
When to use Cell SUM instead of SUM... 14-3 Example - using Cell SUM to calculate an increase in sales ... 14-3
About migrating workbook totals to Oracle BI Discoverer... 14-4
What are aggregated values in Discoverer... 14-4
What are linear and non-linear totals... 14-5
How to display or hide totals... 14-5
How to create totals... 14-6
How to edit totals... 14-8
How to delete totals ... 14-9
Examples of totals... 14-10
Examples of worksheet aggregation in Discoverer... 14-12 Example 1: Example of a Rank calculation using an Oracle9i or later database ... 14-12 Example 2: Example showing how Discoverer does not aggregate repeated values using an Oracle9i or later database 14-13
15
Using percentages
About sorting on table worksheets... 16-2
About sorting on crosstab worksheets... 16-2
What is group sorting?... 16-3
How to sort data on a crosstab worksheet... 16-5
About using calculations... 17-2
What are analytic functions?... 17-3
What analytic function templates are available in Discoverer?... 17-4
How to display or hide worksheet calculations... 17-5
How to create calculations... 17-6
How to create a calculation using an analytic function template... 17-8
How to edit calculations... 17-11
How to delete calculations... 17-13
Examples of calculations... 17-14
Part III
Sharing results with others
18
Printing worksheets and graphs
About printing in Discoverer Plus Relational... 18-1
About elements of a printed worksheet in Discoverer Plus Relational... 18-2
What are Page Setup options... 18-3
About Page Setup options for graphs... 18-4
How to change Page Setup options for a worksheet... 18-9
How to print Discoverer workbooks... 18-10
How to print Discoverer worksheets... 18-12
How to print Discoverer workbooks and worksheets to PDF files... 18-14
19
Exporting data to other applications
About exporting Discoverer data to other applications... 19-1
About exporting worksheets to Oracle Reports... 19-2
About exporting worksheets to Microsoft Excel... 19-3
About exporting worksheets to Microsoft Excel Web Query format... 19-4 About Discoverer support for Microsoft Excel Web Query format ... 19-4 About Microsoft Excel Web Query format and Discoverer security... 19-5
About how worksheets and graphs are exported... 19-5
About exporting worksheets that contain page items... 19-6
About accessing exported files... 19-6
How to export Discoverer data... 19-6
20
Sharing workbooks
About sharing workbooks... 20-1
About sharing workbooks and security... 20-3
How to share the currently open workbook with other Discoverer users ... 20-3 How to share multiple workbooks with a single Discoverer user... 20-5
Part IV
Advanced Discoverer Plus Relational features
21
Advanced Discoverer Plus Relational Features
Using scheduled workbooks... 21-1 What are scheduled workbooks?... 21-1 When to use scheduled workbooks... 21-3 An example of using a scheduled workbook... 21-3 About accessing scheduled workbook results sets ... 21-4 About how scheduled workbooks are processed... 21-5 About scheduled workbooks and aggregation... 21-5 Non-aggregable values are not displayed for scheduled workbooks... 21-5 ALL page item value is missing for tabular worksheets... 21-5 How to disable Enhanced Data Aggregation ... 21-5 How to schedule workbooks... 21-6 How to edit scheduled workbooks... 21-9 How to copy a scheduled workbook... 21-10 How to unschedule a scheduled workbook... 21-12 How to delete scheduled workbooks and scheduled workbook results sets ... 21-13
Using lists of values (LOVs)... 21-14 What is a list of values (LOV)? ... 21-15 LOV examples... 21-15 A LOV used to specify worksheet parameters ... 21-16 A LOV used in a condition ... 21-16 A LOV used in the Discoverer item navigator ... 21-17 About using long LOVs... 21-17 How to select single values from long LOVs... 21-17 How to select multiple values from long LOVs ... 21-19
Changing default settings... 21-20 About default Discoverer settings ... 21-20 How to change default Discoverer settings ... 21-21 How to revert to the default format settings... 21-22 How to change default worksheet formats ... 21-22 Notes on setting Advanced options ... 21-23 About automatic querying ... 21-23 About fan traps... 21-23 About multiple join paths... 21-25
How to view a SQL execution plan ... 21-28
Part V
Discoverer Plus Relational Reference
22
Dialog reference
Available Items pane... 22-5
Available Items pane: Calculations tab... 22-6
Available Items pane: Conditions area... 22-8
Available Items pane: Items tab... 22-9
Band by Rank dialog... 22-11
Band by Value dialog... 22-12
Calendar dialog... 22-14
Choose a responsibility dialog... 22-15
Color Chooser dialog... 22-16
Color Palette Editor dialog... 22-18
Choose Worksheet dialog... 22-19
Column Width dialog... 22-20
Conditional Formats dialog... 22-21
Confirm Threshold dialog... 22-23
Data Format dialog (Default Options)... 22-24
Data/graph pane... 22-25
Delete Scheduled Workbook Results dialog... 22-26
Delete Workbooks from Database dialog... 22-27
Difference dialog... 22-28
Drill dialog... 22-30
Edit Calculation dialog... 22-32
Edit Condition dialog... 22-35
Edit Graph dialog: Font dialog tab... 22-39
Edit Graph dialog: Legend tab... 22-40
Edit Graph dialog: Pie Chart Options tab (column)... 22-41
Edit Graph dialog: Pie Chart Options tab (row)... 22-42
Edit Graph dialog: Plot Area tab... 22-43
Edit Graph dialog: Style tab... 22-45
Edit Graph dialog: Titles, Totals, and Series tab... 22-46
Edit Graph dialog: Type tab... 22-48
Edit Graph dialog: X-Axis tab... 22-49
Edit Graph dialog: Y-Axis tab... 22-52
Edit Heading dialog... 22-55
Edit Parameter dialog... 22-56
Edit Parameter Values dialog... 22-59
Edit Percentage dialog... 22-61
Edit Text Area dialog... 22-64
Edit Title dialog... 22-66
Edit Total dialog... 22-68
Edit Worksheet dialog... 22-70
Edit Worksheet dialog: Parameters tab... 22-72
Edit Worksheet dialog: Select Items tab... 22-74 Edit Worksheet dialog: Select Items tab: Items tab ... 22-76 Edit Worksheet dialog: Select Items tab: Conditions tab ... 22-77 Edit Worksheet dialog: Select Items tab: Calculations tab ... 22-78
Edit Worksheet dialog: Sort tab... 22-79
Edit Worksheet dialog: Table Layout tab... 22-81
Edit Worksheet dialog: Worksheet Layout tab... 22-82
Export Log dialog... 22-83
Export Wizard dialog: Format and Name page... 22-84
Export Wizard dialog: Graph page... 22-86
Export Wizard dialog: Page Item Prompts page... 22-87
Export Wizard dialog: Parameter Prompts page... 22-88
Export Wizard dialog: Select page... 22-90
Export Wizard dialog: Supervise page... 22-91
Find dialog (in Item Navigator)... 22-92
Find dialog (in Worksheet)... 22-94
Following Value dialog... 22-96
Format dialog... 22-98
Format Data dialog... 22-99
Format Data dialog: Breaks tab... 22-100
Format Data dialog: Date tab... 22-101
Format Data dialog: Format tab... 22-102
Format Data dialog: Number tab... 22-103
Format Data dialog: Text tab... 22-105
Format heading dialog... 22-106
Group Total dialog... 22-107
Header/Footer Font dialog... 22-108
Heading Format dialog (Default Options)... 22-109
Join folders dialog... 22-110
Manage Links dialog... 22-111
Manage Workbooks dialog... 22-112
Move Worksheets dialog... 22-114
Moving Total dialog... 22-115
New Calculation dialog... 22-117
New Condition dialog... 22-120
New Conditional Format dialog... 22-124
New Link dialog... 22-126
New Parameter dialog... 22-129
New Percentage dialog... 22-132
New Scheduled Workbook Results dialog... 22-135
New Stoplight Format dialog... 22-136
New Total dialog... 22-137
Open Workbook from Database dialog... 22-139
Options dialog: Advanced tab... 22-141
Options dialog: EUL tab... 22-143
Options dialog: General tab... 22-145
Options dialog: Query Governor tab... 22-147
Options dialog: Sheet tab... 22-149
Page Setup dialog... 22-152
Page Setup dialog: Graph tab... 22-153
Page Setup dialog: Header/Footer tab... 22-154
Page Setup dialog: Margins tab... 22-156
Page Setup dialog: Table/Crosstab tab... 22-158
Page Setup dialog: Worksheet tab... 22-162
Parameters dialog... 22-164
Percent Contribution dialog... 22-166
Percent Difference dialog... 22-167
Percent Rank dialog... 22-169
Percent Running Contribution dialog... 22-171
Preceding Value dialog... 22-172
Print dialog... 22-174
Print Preview dialog... 22-176
Rank dialog... 22-177
Reference Lines dialog... 22-179
Running Total dialog... 22-180
Save Workbook to Database dialog... 22-181
Schedule Wizard dialog... 22-183
Schedule Wizard dialog: General tab... 22-184
Schedule Wizard dialog: Schedule tab... 22-185
Scheduling Manager dialog... 22-187
Select Condition dialog... 22-189
Select Item dialog... 22-190
Select item to drill dialog... 22-191
Selected items pane... 22-192
Select Parameter dialog... 22-193
Select User dialog... 22-194
Select Value dialog... 22-195
Select Values dialog... 22-196
Select Workbook from Database dialog... 22-198
Share Workbooks dialog: User -> Workbook tab... 22-199
Share Workbooks dialog: Workbook -> User tab... 22-201
Show Condition dialog... 22-203
Sort Crosstab dialog... 22-204
Stoplight colors dialog... 22-206
Text area ... 22-207
Title area... 22-208
Total Format dialog (Default Options)... 22-209
Workbook Properties dialog... 22-210
Workbook Wizard: Create/Open Workbook dialog... 22-212
Worksheet Properties dialog: Aggregation tab... 22-214
Worksheet Properties dialog: General tab... 22-216
A
Discoverer calculation examples
How to find more information about Oracle analytic functions... A-1
About the examples in this chapter... A-1
How do I create calculations?... A-1
About using parameters to provide dynamic input to calculations... A-1
Simple calculation examples... A-2
Example: Compute the median profit using the PERCENTILE_DISC function ... A-29 Example: Compute the median profit using the PERCENTILE_CONT function... A-30 Hypothetical rank and distribution examples ... A-30 Example: Calculate hypothetical rank ... A-31 Banding example... A-32 Example: Producing equi-width bands using WIDTH_BUCKET... A-32 FIRST/LAST aggregate examples ... A-33 Example: Find the largest sales transactions in area with most sales trans’ ... A-34 Example: Find the average sales transaction in area with least sales trans’... A-35
Examples of using row-based and time-based intervals... A-36 Example: Creating a Difference calculation using a row-based interval ... A-36 Example: Creating a Difference calculation using a time-based interval ... A-38 Example: Creating a Preceding value calculation using a time-based interval ... A-40
B
Discoverer support for Oracle Applications
What are Oracle Applications?... B-1
What features does Discoverer support for Oracle Applications users?... B-1
What are the prerequisites to run Discoverer with Oracle Applications?... B-2
About using indexes and values in parameters... B-2
How to start Discoverer in Oracle Applications mode using an existing connection... B-2
Glossary 1
Preface
Welcome to Discoverer Plus - the complete business intelligence (BI) analysis tool that works over the Internet.
Discoverer Plus enables you to query complex databases without having to understand the database language SQL (Structured Query Language). You can use Discoverer Plus to retrieve and analyze data, and produce reports in printed format or a range of electronic formats.
Intended Audience
Use this guide when you want to use Discoverer to view and manipulate data to support business decisions and you want to know how to:
■ create new workbooks (that is, collections of business intelligence reports) or use
existing workbooks to find the information you are interested in
■ format the information to meet your requirements
■ analyze the information in different ways
■ share the information with other users
Documentation Accessibility
Our goal is to make Oracle products, services, and supporting documentation accessible to all users, including users that are disabled. To that end, our
documentation includes features that make information available to users of assistive technology. This documentation is available in HTML format, and contains markup to facilitate access by the disabled community. Accessibility standards will continue to evolve over time, and Oracle is actively engaged with other market-leading
technology vendors to address technical obstacles so that our documentation can be accessible to all of our customers. For more information, visit the Oracle Accessibility Program Web site at http://www.oracle.com/accessibility/.
Accessibility of Code Examples in Documentation
Screen readers may not always correctly read the code examples in this document. The conventions for writing code require that closing braces should appear on an
Accessibility of Links to External Web Sites in Documentation
This documentation may contain links to Web sites of other companies or
organizations that Oracle does not own or control. Oracle neither evaluates nor makes any representations regarding the accessibility of these Web sites.
Access to Oracle Support
Oracle customers have access to electronic support through My Oracle Support. For information, visit http://www.oracle.com/support/contact.html or visit
http://www.oracle.com/accessibility/support.html if you are hearing impaired.
Oracle BI Discoverer Keyboard Navigation
Oracle BI Discoverer supports standard keyboard navigation. Standard keyboard navigation includes the use of the tab key, mnemonics (using the Alt key and the underlined character), and accelerators (such as Alt+F4 to exit a window).
Related Documents
You can access the documents referenced in this guide, and other information about Oracle Business Intelligence (for example, whitepapers, best practices, documentation updates, other collateral) on Oracle Technology Network at:
http://www.oracle.com/technology
Conventions
Conventions used in this manual are shown in the table below:
JGoodies License Agreement
Oracle Business Intelligence includes the JGoodies software, whose License Agreement follows:
Copyright© 2003 JGoodies Karsten Lentzsch. All rights reserved.
Redistribution and use in source and binary forms, with or without modification, are permitted provided that the following conditions are met:
Convention Meaning
boldface Boldface type indicates graphical user interface elements associated with an action, or terms defined in text or the glossary.
italic Italic type indicates book titles, emphasis, or placeholder variables for which you supply particular values.
monospace Monospace type indicates commands within a paragraph, URLs, code in examples, text that appears on the screen, or text that you enter. < > Angle brackets enclose user-supplied names or values.
[] Square brackets enclose optional clauses from which you can choose one or none.
Menu name | Command
■ Redistributions of source code must retain the above copyright notice, this list of
conditions and the following disclaimer.
■ Redistributions in binary form must reproduce the above copyright notice, this list
of conditions and the following disclaimer in the documentation and/or other materials provided with the distribution.
■ Neither the name of JGoodies nor the names of its contributors may be used to
endorse or promote products derived from this software without specific prior written permission.
THIS SOFTWARE IS PROVIDED BY THE COPYRIGHT HOLDERS AND CONTRIBUTORS "AS IS" AND ANY EXPRESS OR IMPLIED WARRANTIES, INCLUDING, BUT NOT LIMITED TO, THE IMPLIED WARRANTIES OF MERCHANTABILITY AND FITNESS FOR A PARTICULAR PURPOSE ARE DISCLAIMED. IN NO EVENT SHALL THE COPYRIGHT OWNER OR CONTRIBUTORS BE LIABLE FOR ANY DIRECT, INDIRECT, INCIDENTAL, SPECIAL, EXEMPLARY, OR CONSEQUENTIAL DAMAGES (INCLUDING, BUT NOT LIMITED TO, PROCUREMENT OF SUBSTITUTE GOODS OR SERVICES; LOSS OF USE, DATA, OR PROFITS; OR BUSINESS INTERRUPTION) HOWEVER CAUSED AND ON ANY THEORY OF LIABILITY, WHETHER IN CONTRACT, STRICT
Part I
Part IGetting started
1
1
Introducing Oracle Business Intelligence
Discoverer
This chapter introduces Oracle Business Intelligence Discoverer (Oracle BI Discoverer), and includes the following topics:
■ "What is Oracle BI Discoverer?"
■ "Why should I use Oracle BI Discoverer?"
■ "How do I access information using Oracle BI Discoverer?" ■ "What is a typical workflow with Oracle BI Discoverer?" ■ "What are the different components of Oracle BI Discoverer?" ■ "Who is the Discoverer manager and what do they do?"
What is Oracle BI Discoverer?
Oracle BI Discoverer is an intuitive ad-hoc query, reporting, analysis, and Web publishing toolset that gives business users immediate access to information in databases.
Oracle BI Discoverer enables business users at all levels of the organization to make faster and more informed business decisions. Using any standard Web browser, you have secure and immediate access to data from both relational and multidimensional data sources. Oracle BI Discoverer provides a business view to hide the complexity of the underlying data structures, enabling you to focus on solving business problems.
Why should I use Oracle BI Discoverer?
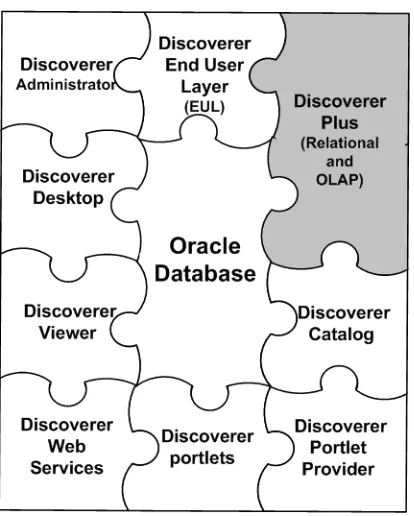
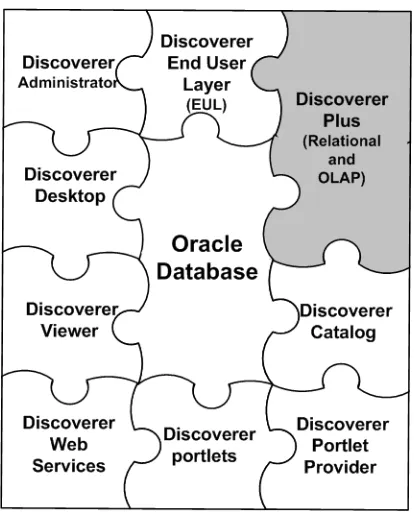
Figure 1–1 Oracle BI Discoverer components
The Oracle BI Discoverer component that you use depends on the task you want to perform.
■ To create new worksheets and analyze data from both relational and
multi-dimensional data sources across the Web, you use Discoverer Plus
■ To create new worksheets and analyze data from relational data sources using a
Windows application on a PC, you use Discoverer Desktop
■ To analyze data in existing worksheets, you use Discoverer Viewer or Discoverer
portlets (that have been added to an Oracle Portal page or Oracle WebCenter Spaces using Discoverer Portlet Provider)
■ To obtain Discoverer connections, workbooks, worksheets, and execute queries in
Oracle BI Publisher, or from a Java client application using the SOAP protocol, you use Discoverer Web Services
■ To display Discoverer worksheets as gauges in dashboard-style portals, you use
Discoverer Portlet Provider and Discoverer portlets
■ To manage the end user view of relational data, you use Discoverer Administrator
The Oracle BI Discoverer components use definitions of Discoverer objects stored in the Discoverer End User Layer or the Discoverer Catalog.
For more information about the Oracle BI Discoverer components, see "What are the different components of Oracle BI Discoverer?".
Why should I use Oracle BI Discoverer?
Comparing Oracle BI Discoverer with other ways of accessing data that you might have used helps you understand why Discoverer is so powerful. Imagine that you want to analyze information in a database. In the past you typically had to:
■ understand databases and a programming language called SQL to find the data
(or ask a programmer to find the data for you)
What is a typical workflow with Oracle BI Discoverer?
■ reformat the data to analyze it (often by exporting the data to a spreadsheet
package, graphics package, or statistical analysis package)
With Oracle BI Discoverer, you simply open a workbook containing the data you want to see and start analyzing. You do not have to know anything about databases. You do not have to wait a long time to get information. You do not have to use another application to analyze your data.
Oracle BI Discoverer’s powerful and intuitive user interface enables you to:
■ find data that you know is in the database
■ access data quickly without waiting for the computer to search through the entire
database
■ view data in a familiar spreadsheet-style format that is easy to read and
understand
■ analyze data using a variety of powerful techniques including:
■ drilling up and down through data
■ finding data that meets certain conditions or that falls within ranges that you
specify
■ sorting data
■ prepare reports showing the results of your analysis
■ share data with other people, and in other applications (for example, Microsoft
Excel)
How do I access information using Oracle BI Discoverer?
You use Oracle BI Discoverer to analyze information by creating and using Discoverer workbooks and worksheets.
A workbook is simply a named collection of worksheets. Each worksheet contains the data and graphs that you require to extract business information from the database. Each worksheet contains the result of a query.
Worksheets can show information:
■ as data points in cells (formatted as tables or as crosstabs)
■ as graphs (Oracle BI Discoverer supports many different graph types)
You can create and analyze worksheets using Discoverer Plus and Discoverer Desktop.
You can view, analyze, and customize worksheets using Discoverer Viewer and Discoverer portlets.
What is a typical workflow with Oracle BI Discoverer?
As you become more familiar with Oracle BI Discoverer, you will find a workflow that suits you best.
Typically, using Oracle BI Discoverer is a three-stage process:
■ "Stage 1: Getting the data you want" ■ "Stage 2: Analyzing data"
What is a typical workflow with Oracle BI Discoverer?
Stage 1: Getting the data you want
When working with Oracle BI Discoverer, you get the data you want by:
■ using existing workbooks created by the Discoverer manager or by other
Discoverer users
■ creating new workbooks to analyze data in a new way using Discoverer Plus or
Discoverer Desktop
Stage 2: Analyzing data
Your ultimate goal in using Oracle BI Discoverer is to analyze data to arrive at a profitable business decision. To do this, you might ask yourself questions about your business. For example:
■ What is the average time for a hospital stay for heart transplant patients?
■ How many engineers have we hired in the last twelve months?
■ Which telephone lines need greater bandwidth?
With Discoverer's data analysis tools, you can find the answers to these and other business questions by:
■ pivoting data to create comparisons
■ drilling up and down in data to see consolidated or more detailed information
■ drilling out to analyze data in other applications
■ creating totals, calculating percentages, and creating custom calculations
■ displaying data visually in graphs and charts
The result is a collection of worksheets and graphs that persuasively support your business decisions.
Stage 3: Sharing data with other people
When you have retrieved and analyzed data, you probably want to share your results with other people at your organization, with customers, or with business partners.
If the people you want to share data with also use Oracle BI Discoverer:
■ you can share your Discoverer workbooks and worksheets with them (for more
information about sharing workbooks, see "About sharing workbooks")
Discoverer Plus users can open worksheets and save their own personal copy to the database. Discoverer Viewer users can view worksheets, and save their own personalizations (personalizations do not affect the source worksheets in the database).
■ you can use Discoverer Portlet Provider to publish worksheets as portlets on
Oracle Portal pages (for more information, see Oracle Fusion Middleware Guide to Publishing Oracle Business Intelligence Discoverer Portlets)
If the people you want to share data with do not use Oracle BI Discoverer, you can export Discoverer worksheets in popular application formats (for example, Microsoft Excel, HTML). For more information about exporting worksheets, see "About
What are the different components of Oracle BI Discoverer?
What are the different components of Oracle BI Discoverer?
Oracle BI Discoverer comprises the following components:■ Oracle Business Intelligence Discoverer Plus
This component runs over the internet or intranet and enables you to:
– create new worksheets and graphs to get the data you want
– analyze the data
– share worksheets and graphs with other people For more information:
– about using Discoverer Plus Relational, see "Using Discoverer Plus with a relational data source"
– about using Discoverer Plus OLAP, see "Using Discoverer Plus with a multidimensional data source"
■ Oracle Business Intelligence Discoverer Viewer
This Oracle BI Discoverer component runs over the internet or intranet inside a web browser. Use Discoverer Viewer to analyze the data in worksheets created in Discoverer Plus, and Discoverer Desktop. You can personalize worksheets (for example, by repositioning items) and save your changes.
For more information about Discoverer Viewer, see the Oracle Fusion Middleware User's Guide for Oracle Business Intelligence Discoverer Viewer.
■ Oracle Business Intelligence Discoverer Portlet Provider and Discoverer portlets
These Oracle BI Discoverer components run over the internet or intranet inside a web browser. Use Discoverer Portlet Provider to include Discoverer worksheets as areas (or portlets) within existing Oracle Portal pages. Discoverer Portlet Provider enables you to publish the following types of Discoverer portlet:
– a List of Worksheets portlet
– a Worksheet portlet
– a Gauges portlet
You can personalize worksheets (for example, by adding stoplight formatting) and save your changes.
■ Oracle BI Discoverer Desktop
This Oracle BI Discoverer component is a Windows-only application that enables you to build new worksheets to analyze data from relational data sources. The worksheets you create in Discoverer Desktop can be used in Discoverer Plus, Discoverer Viewer, and Discoverer portals.
For more information about Discoverer Desktop, see the Oracle Fusion Middleware User's Guide for Oracle Business Intelligence Discoverer Desktop.
■ Oracle BI Discoverer Administrator
This Oracle BI Discoverer component is a Windows-only application used by the Discoverer manager to create and maintain a business oriented view of relational data. Discoverer Administrator provides wizards and dialogs to:
– control access to data
Who is the Discoverer manager and what do they do?
– administer batch scheduling
For more information about Discoverer Administrator, see the Oracle Fusion Middleware Administrator's Guide for Oracle Business Intelligence Discoverer.
■ Oracle BI Discoverer End User Layer (EUL)
The Discoverer End User Layer component is a repository for storing and retrieving definitions of objects used when querying relational data sources.
For more information about the End User Layer, see the Oracle Fusion Middleware Administrator's Guide for Oracle Business Intelligence Discoverer.
■ Oracle BI Discoverer Catalog
The Discoverer Catalog component is a repository for storing and retrieving definitions of user objects when querying multidimensional data sources.
For more information about the Discoverer Catalog, see "What is the Discoverer Catalog?".
Who is the Discoverer manager and what do they do?
The Discoverer manager is the person in your organization that is responsible for setting up and maintaining Discoverer. In some organizations, the Discoverer manager also creates predefined workbooks for Discoverer users.
The Discoverer manager uses the Discoverer Administrator component to:
■ organize the data in your organization’s database into business areas
■ give Discoverer users access to data that they are authorized to see
■ optimize Discoverer performance
The Discoverer manager also maintains the Discoverer Catalog.
2
2
Using Discoverer Plus with a relational data
source
This chapter introduces Discoverer Plus Relational and contains the following topics:
■ "What is Discoverer Plus Relational?" ■ "What is a relational data source?" ■ "What are business areas?" ■ "What are folders?" ■ "What are items?"
■ "What is the Discoverer Plus Relational sample database?" ■ "What are the new features in Discoverer Plus 11.1.1?"
■ "Where can I find out more about Discoverer Plus Relational?"
What is Discoverer Plus Relational?
What is a relational data source?
Figure 2–1 Oracle BI Discoverer components
Other Discoverer users can open the worksheets you share with them, using
Discoverer Plus Relational, Discoverer Viewer, Discoverer portals, Discoverer Desktop, and Discoverer Web Services.
What is a relational data source?
What is a relational data source?
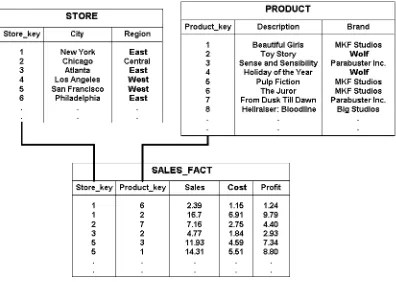
Figure 2–2 Three related database tables
The example above shows three database tables:
■ the STORE table contains three columns:
– Store_key
– City
– Region
■ the PRODUCT table contains three columns:
– Product key
– Description
– Brand
■ the SALES_FACT table contains five columns:
– Store_key
– Product_key
– Sales
– Cost
– Profit
Relational databases are a widely used data source. However, relational databases can become complicated when they contain hundreds of related tables, with thousands of columns, and millions of rows. Finding information in such a database can be a real challenge.
What are business areas?
manager enables you to use Discoverer Plus Relational to find just the data you want to analyze.
What are business areas?
A business area is a collection of related information in the database.
The Discoverer manager works with the different departments in your organization to identify the information that each department requires from the database. The
Discoverer manager locates the information in the database and groups it into business areas. Within each business area, the Discoverer manager organizes information into folders.
For example, the key areas of a company’s business might be sales, production, and human resources. So the Discoverer manager might create three corresponding business areas.
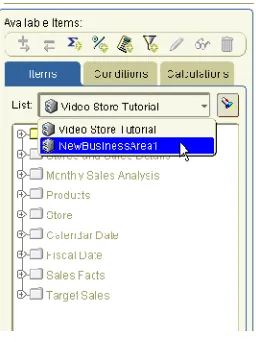
Figure 2–3 Three Discoverer business areas
The Discoverer manager also decides which users can access which business areas.
The figure below shows how business areas are displayed in Discoverer Plus Relational. The business areas in this example are called Video Store Tutorial, and NewBusinessArea1.
What are folders?
What are folders?
A folder is a collection of closely related information. For example, information about products that your company produces might be in a folder called Products.
If you are familiar with relational databases, a folder is similar to a database table or view. Indeed, a folder can be based directly on a database table or view.
The different folders in a business area might contain related information. For example, a business area might contain two folders:
■ a Products folder containing information about each product (for example,
product ID, product description, product brand)
■ a Sales folder containing information about the sales of each product (for example,
the store where a particular product was sold, the price for which the product was sold, the cost of the product, the profit made on each sale, and the product
reference number)
Figure 2–5 A business area containing two folders
By querying the Sales folder, you can see information about a particular sales
transaction. But to see the description of the product that was sold (rather than simply the product reference number) you must also query the Products folder.
The Discoverer manager might combine information from several folders into one folder to make it easy to find all the information you need. For example, the
What are items?
Figure 2–6 A Discoverer folder containing information from a Products folder and a
Sales folder
Figure 2–7 shows how folders (for example, Video Analysis Information, Stores and Sales Details, Monthly Sales Analysis) are displayed in Discoverer Plus Relational’s item navigator tab.
Figure 2–7 Folders in Discoverer
What are items?
Items are different types of information within a folder.
If you are familiar with relational databases, an item is similar to a column in a database table. Indeed, an item might be based on a column in a database table.
What is the Discoverer Plus Relational sample database?
Figure 2–8 A Discoverer folder containing three items
Each item contains individual pieces of information. For example, the reference number item might contain a list of reference numbers.
The Discoverer manager decides which items are included in folders based on the information you want to analyze.
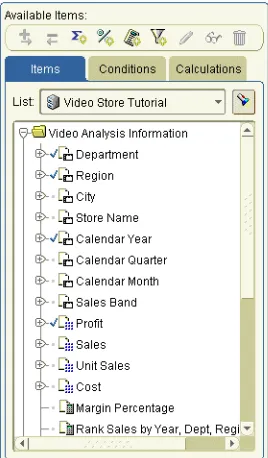
Figure 2–9 shows how items (for example, Department, Region, City) are displayed in Discoverer Plus Relational’s item navigator tab.
Figure 2–9 Items in Discoverer
What is the Discoverer Plus Relational sample database?
Discoverer is supplied with a sample database containing data about a fictitious company called Video Stores. Information in the Video Stores sample database includes:
■ sales region
■ year
■ department
■ sum of profit
■ size of store (in square metres)
What are the new features in Discoverer Plus 11.1.1?
■ store name
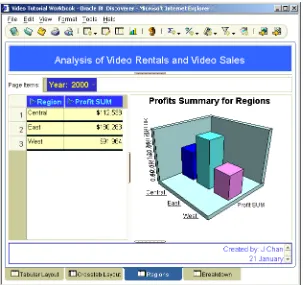
Discoverer is also supplied with a sample workbook called Video Tutorial Workbook that you can use to analyze the example data. The Video Tutorial Workbook contains several worksheets, including:
■ a table worksheet called Tabular Layout
■ a crosstab worksheet called Crosstab Layout
Note: The Discoverer manager might have given the sample workbook a different name from Video Tutorial Workbook.
Both worksheets enable you to analyze the sales and profitability of Video Stores (see
Figure 2–10).
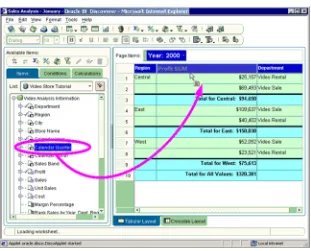
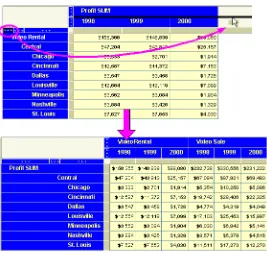
Figure 2–10 Sample Discoverer worksheets in the Video Tutorial Workbook
Key to figure:
a. The Tabular Layout worksheet, showing profit figures for departments across regions for 2000.
b. The Crosstab Layout worksheet, showing a comparison of profit figures for each department in quarter one (Q1) and quarter two (Q2) across regions for 2000.
What are the new features in Discoverer Plus 11.1.1?
Discoverer Plus has been enhanced with Oracle BI Discoverer Web Services, which is an Application Programming Interface (API) that enables a client to obtain Discoverer connections, workbooks, and worksheets; to execute worksheet queries; and to return worksheet content using the SOAP protocol (version 1.1 with RPC/Encoded
messaging format). This API enables you to use Discoverer Plus features programmatically and through the user interface.
For information see the Oracle Fusion Middleware User's Guide for Oracle Business Intelligence Discoverer Web Services API.
Where can I find out more about Discoverer Plus Relational?
To find out more about Discoverer Plus Relational, use:Where can I find out more about Discoverer Plus Relational?
The Discoverer Plus Relational help system gives you context sensitive access to reference information from the Oracle Fusion Middleware User's Guide for Oracle Business Intelligence Discoverer Plus.
Click the Help button or press F1 in any Discoverer Plus Relational dialog to display context sensitive help, or choose Help | Help Topics to see a list of the topics in the help system.
To find a topic in the help system:
■ use the Contents tab to see a structured list of the topics in the help system
■ use the Index tab to search the help system using pre-defined keywords and
phrases
■ use the Search tab to search the help system for keywords and phrase s that
you define
■ the Oracle Fusion Middleware User's Guide for Oracle Business Intelligence Discoverer
Plus
The Oracle Fusion Middleware User's Guide for Oracle Business Intelligence Discoverer Plus is available in html and PDF format on:
■ the Oracle Application Server Documentation CD
■ the Oracle Technology Network at www.oracle.com/technology
■ Oracle Technology Network
Other information about Discoverer Plus (for example, white papers, best practices) is available from Oracle Technology Network at
3
3
Using Discoverer Plus with a
multidimensional data source
This chapter introduces Discoverer Plus OLAP and contains the following topics:
■ "How can I tell when I am using Discoverer Plus with a multidimensional data
source?"
■ "What is Discoverer Plus OLAP?"
■ "What is online analytic processing (OLAP)?" ■ "What are multidimensional data sources?" ■ "What are multidimensional cubes?" ■ "What are measures?"
■ "What are dimensions and dimension members?" ■ "What are dimension hierarchies?"
■ "What are dimension attributes?"
■ "About aggregating and filtering multidimensional data"
■ "About applying filters after aggregating multidimensional data" ■ "About filters and dimensions"
■ "What is the Discoverer Catalog?"
■ "About the Discoverer Plus OLAP Tutorial"
■ "Where can I find out more about Discoverer Plus OLAP?"
How can I tell when I am using Discoverer Plus with a multidimensional
data source?
When you are using Discoverer Plus with a multidimensional data source, the
Connect to property of the connection that you choose to start Discoverer Plus is set to Oracle BI Discoverer for OLAP.
What is Discoverer Plus OLAP?
What is Discoverer Plus OLAP?
Discoverer Plus OLAP enables you to access and analyze multidimensional data from the database of your company, without having to understand complex database concepts. Using wizards and menus, Discoverer Plus OLAP guides you through the steps to retrieve and analyze data that supports your business decisions.
Figure 3–1 Oracle BI Discoverer components
Note: Discoverer Plus OLAP is supplied with sample workbooks stored in the Discoverer Catalog that you can use to familiarize yourself with Discoverer. For more information about accessing the sample workbooks, contact the Discoverer manager.
What is online analytic processing (OLAP)?
Online analytic processing (OLAP) describes queries that are run against a multidimensional data source. While a simple query might ask, "When did order 84305 ship?", a typical series of OLAP queries might ask, "How do sales in the Southwestern region for this quarter compare with sales a year ago? What can we predict for sales next quarter? What factors can we alter to improve the sales forecast?".
What are multidimensional cubes?
What are multidimensional data sources?
A multidimensional data source is optimized for analyzing large amounts of data. Such data sources are sometimes called data warehouses, or online analytical processing (OLAP) data sources.
In a relational data source, data is organized in tables. A table is a data structure with columns and rows. Multidimensional data is data that is organized by one or more dimensions. These multidimensional data structures are often referred to as cubes.
Figure 3–2 depicts the tables in a relational data source and the cubes in a multidimensional data source. Oracle9i (and later) databases can include both relational data structures (tables and columns) and multidimensional data structures (cubes). This combination provides fast multidimensional data access while providing summaries of the relational data.
Figure 3–2 Tables and cubes in the Oracle database
For information on relational data sources, see "What is a relational data source?".
What are multidimensional cubes?
A cube in a multidimensional data source has the following components:
■ A measure, which is the name given to the data itself; that is, to the data that you
track such as sales figures or cost numbers.
■ One or more dimensions. Dimension is the name given to the parts of the cube
that categorize the data, such as Product, Geography, and Time. Dimensions have dimension members, dimension hierarchies, and attributes.
For example, Figure 3–3 shows a cube that contains sales figures for different products in different years and in different cities:
■ The sales figures are the data in the cells of the cube. Sales is the measure for this
cube.
■ The parts of the cube that categorize the data are Product, Time, and City. Product,
What are measures?
Figure 3–3 Cube of Sales data
The cube contains a measure value for each possible combination of the different dimensions. It is therefore very quick for applications such as Discoverer Plus OLAP to find the value for sales of a particular product in a particular city in a particular year. For example, to find sales of Product C in 2003 in Dallas, Discoverer Plus OLAP simply uses the Product, Time, and City dimensions to identify the cell that contains the required value, as shown in Figure 3–4.
Figure 3–4 One measure value in a cube
What are measures?
In OLAP metadata, measures represent data that can be examined and analyzed in crosstabs and graphs. Examples include Sales, Cost, and Profit.
What are dimension hierarchies?
Figure 3–5 Crosstab that is displaying the Sales measure
What are dimensions and dimension members?
Measures have dimensions that categorize the data in the measure. For example, a Sales measure might have Product, Time, and Geography as its dimensions. When a measure has a particular dimension, the measure is said to be dimensioned by that dimension. For example, Sales is dimensioned by Product. The group of dimensions for a measure constitute the dimensionality of that measure. For example, the dimensionality of Sales is Product, Time, and Geography.
Each element in a dimension is a dimension member. For example, January 2001, February 2001, March 2001, Quarter 1 2001, and the year 2001 are likely members of the Time dimension.
Measures can be dimensioned by more than three dimensions. In this document, we use a three-dimensional cube to present a virtual and easy-to-understand
representation of multidimensional data.
What are dimension hierarchies?
A dimension hierarchy describes a hierarchical relationship among two or more dimension members.
Individual dimension members might be related to each other in a hierarchical way. For example, a specific day belongs to a particular month, which in turn is within a particular year. To reflect such relationships, dimension members are organized into dimension hierarchies. Hierarchies allow you to drill deeper into the data, to view more detailed information.
What are dimension attributes?
Figure 3–6 Sample dimension hierarchy
Figure 3–7 presents another view of the hierarchy for the Time dimension. Data for the year 2003 can be broken into four quarters, and each quarter can be broken into three months.
Figure 3–7 Alternative view of a time hierarchy
A dimension can have multiple hierarchies. For example, a Time dimension might have different hierarchies if a company has a Fiscal year that does not correspond to a Calendar year. One hierarchy might be Calendar Year->Calendar Quarter->Month while another is Fiscal Year->Fiscal Quarter->Month. Where several dimension hierarchies exist for the same dimension, one dimension hierarchy must be specified as the default hierarchy.
What are dimension attributes?
A dimension attribute describes a characteristic that is shared by dimension members. Dimension attributes enable you to select data based on similar characteristics. For example, a Product dimension might have a Color attribute that enables you to search for all red products.
About aggregating and filtering multidimensional data
This section describes aggregation and filtering in Discoverer Plus OLAP.
About applying filters after aggregating multidimensional data
What is the Discoverer Catalog?
look at regions where Sales are greater than $2 billion. You likely want to examine values that contribute to the success of these regions.
With multidimensional data, the different levels in a hierarchy contain aggregations of the data at lower levels. The aggregation of data values happens first, then you filter those values. Thus, values for aggregate data are not dependent on the filter. For example, suppose you create a query in which you are displaying Total Company and region values where Sales are greater than $2 billion and Quota Variance is greater than 7%, as shown in " Example of applying filters after aggregating".
The value for Company A’s Sales would not change when underlying dimension values have been filtered. So in our example, Company A’s Sales remain $10 billion even though only the regions who Sales are greater than $2 billion are displayed in the query.
An aggregate value would meet the filter condition even if not all of its children do, which enables you to drill into underlying issues. For example, consider our example above in which Quota Variance is greater than 7% for Company A and for the
Northeast and Southwest regions. When you drill into the Southwest region, you discover that the Quota Variance for the state of Arizona is -50%; a pressing problem that needs attention.
Aggregate values and their children are often at different scales. For example, a region might be 100 times bigger than any one of its children.
About filters and dimensions
Filters apply to dimensions. Each dimension has an associated query. The data selected by a dimension's query might or might not be dependent on the data selected by another dimension's query. Consider the following example:
■ Time dimension: Select latest 6 months
■ Geography: Select territories where Sales is greater than Quota.
■ Product: For each territory, select categories where Sales growth is negative.
For clarity, a filter must be fully qualified. For example, suppose you create a query in which you want to display the top three selling products for each Geography, and Time is set to January. If you change the value of Time to February, then you change the result of the query; that is, the top three selling products might be different for February.
What is the Discoverer Catalog?
The Discoverer Catalog is a repository for storing and retrieving definitions of objects for Discoverer Plus OLAP and can be used by applications that are built with Oracle Business Intelligence Beans (BI Beans). With Discoverer Plus OLAP, you use the Catalog to store objects such as workbooks, calculations, and saved selections and to share objects with others who have access to the Catalog. For example, you can use a
Table 3–1 Example of applying filters after aggregating
Regions Sales Dollars Quota Variance
About the Discoverer Plus OLAP Tutorial
BI Beans application to create a graph and store it in the Catalog. If another user has appropriate access, that user can retrieve the graph that you stored in the Catalog and insert the graph into a new worksheet in Discoverer Plus OLAP.
The Catalog provides security at the object level, by allowing users and system administrators to specify access to certain objects.
About the Discoverer Plus OLAP Tutorial
For a hands-on introduction to using Discoverer Plus OLAP, see the Discoverer Plus OLAP Tutorial. The tutorial guides you through the creation of a sample workbook, which displays data about a fictitious company.
You can access the Discoverer Plus OLAP Tutorial and other information about Discoverer (such as white papers and best practices) from Oracle Technology Network at www.oracle.com/technology.
Where can I find out more about Discoverer Plus OLAP?
To find out more about Discoverer Plus OLAP, use:■ the Discoverer Plus OLAP help system
Click the Help button or press F1 in any Discoverer Plus OLAP dialog to display context sensitive help, or choose Help | Help Topics to see a list of the topics in the help system.
To find a topic in the help system:
■ use the Contents tab to see a structured list of the topics in the help system
■ use the Index tab to search the help system using pre-defined keywords and
phrases
■ use the Search tab to search the help system for keywords and phrase s that
you define
■ the Discoverer Plus OLAP Tutorial
Use the Discoverer Plus OLAP tutorial to begin learning about Discoverer Plus OLAP. For more information, see "About the Discoverer Plus OLAP Tutorial".
■ Oracle Technology Network
Other information about Discoverer Plus OLAP (for example, white papers, best practices) is available from Oracle Technology Network at
4
4
Starting Discoverer
This chapter explains how to start Discoverer, and contains the following topics:
■ "What is a Discoverer connection?" ■ "About starting Discoverer"
■ "How to display the Discoverer Plus connections page" ■ "How to start Discoverer using an existing connection" ■ "How to start Discoverer by connecting directly" ■ "How to exit Discoverer Plus"
■ "Frequently asked questions"
What is a Discoverer connection?
A Discoverer connection stores login details that enable you to connect to Discoverer. Each connection stores the following information:
■ database user name
■ database password (not required for Oracle Applications SSO users)
■ database name
■ (optional) Oracle Applications responsibility
■ language
■ EUL
Discoverer login details are saved automatically when you create a connection. From then on, you can start Discoverer simply by clicking on a connection name in the Discoverer connections list that is displayed when you run Discoverer.
Notes
■ You can also start Discoverer without creating a connection, by connecting directly
(for more information, see "How to start Discoverer by connecting directly").
■ For more information about saving login information in a private connection, see
"How do I create and save login information in a Discoverer connection?".
■ If you require login details to enable you to create your own Discoverer