Preparation Of Nanoparticle Silica From Silica Sand and
Quartzite By Ultrafine Grinding
Agus Wahyudia, Teguh Nurasidb And Siti Rochania
a
R&D Centre for Mineral and Coal Technology
Jalan Jenderal Sudirman 623 Bandung 40211 INDONESIA Phone. (022) 6030483, Fax. (022) 6003373
b
Department of Chemistry, University of Jenderal Achmad Yani Jalan Terusan Jendral Sudirman, PO Box 148 Cimahi INDONESIA Phone. (022) 6656190, Fax. (022) 6652069
E-mail : [email protected]
Abstract :
In this work nanoparticle silica was synthesized using silica sand and quartzite by top down approach using ultrafine grinding. Silica sand was obtained from Bangka island while quartzite rocks from Rokan Hulu, Riau. Both samples have good SiO2 value about 98% and increase up to 99.7% after leached with sulfuric acid in room temperature. The high grade silica then was milled by planetary ball mill in several milling time. The optimum result occured in 30-50 hours milling time produce nanoparticle silica about 80 nm in size. By TEM characterization this
a oparti le looks agglo erated as typi al illi g produ t hi h as aused y Va der Walls’ for e et ee parti le after illing process. This nanoparticle silica has good potential for applying in industry, such as for additive materials in ultra high performance concrete for the next development.
Keywords: nanoparticle silica, planetary ball mill, quartzite, silica sand, ultrafine grinding.
1. Introduction
Silica (SiO2) plays an important role for industry, either as a main ingredient or as an added ingredient, such
as for cement industry, glass, bottles and crockery, enamel, paints, ceramics, electronics, industrial tire and even cosmetics [1].
With development in technology resulted in the use of silica in industrial applications is rapidly increasing, especially in the use of silica in the small particle size up to a micron or even nano-scale silica, which has different properties that can improve its quality. As an example of nano silica widely applied in building material, ie as a mixture of the concrete [2, 3]. Empty cavities between the particles of cement will be filled by nano silica serving as concrete reinforcing materials (mechanical properties) and increased durability. During this time the need of micro / nano-silica in a country filled with imported products. Other applications of nano silica is used as an additive in rubber and tire industry. Benefit of adding nano silica in tires will make the tire adhesion has better quality especially on the road of snow, reducing the noise generated and better display than the old tire products without the addition of nano-silica [4, 5].
Based on economic value, nano silica particles have excellent potential to be developed. As an illustration (Figure 1), the price of 1 kg of natural silica sand is Rp. 500, but if the levels are to be pure silica enhanced the
value of Rp. 150,000/kg. This value continues to increase when processed into nano silica at a price of Rp. 3,000,000/kg [6].
To obtain the size of silica to nano size we need special treatment to process it. To mikrosilika can usually be obtained from the top down (crushing and grinding) with special milling method, which is the usual method of milling has been specially modified so that the ability to destroy far more effective, even with this method it is also possible to obtain materials at the nanometer scale [7].
On the other hand, some national constraints faced by them are still locally produced silica products do not meet the specifications required by the market, namely the size of the sub-micron silica, silica produced locally
Figure 1. Price comparisons of natural silica, pure silica and nano silica [6]
Activities performed on this fieldwork is the preparation of silica nanoparticles of silica sand and quartzite rock mechanically; includes the study of raw materials, increased levels of silica and silica particle size reduction by ultrafine grinding tool. The goal is to increase the SiO2 content of silica sand and quartzite up to> 99% and reduce
the particle size of up to order of nanometer (<100 nm) into nano-silica particles.
2. Material and Methods
Rp. 500,-/kg
Rp. 150.00,-/kg
Rp. 3.000.000,-/kg
Silica Sand/Quartzite
(-Leaching at room temperature
Washing with water (until pH netral)
Filtration
Drying (110 0C)
High grade silica
Ultra milling by PBM (planetary ball mill)
Nano powder silica
H2SO4
Aqua DM
Characterization of chemical composition
Silica sand was obtained from Bangka while quartzite rocks from Rokan Hulu, Riau. The samples were then dried at 105 0C and crushed to -200 mesh using a jaw crusher and ball mill. To increase levels of SiO2 in silica sand and quartzite conducted leaching with sulfuric acid at room temperature with a variation of the concentration of sulfuric acid to the sample.
Synthesis of nano-silica performed by means of grinding PBM (planetary ball mill) with a variation of milling time 10-60 hours. The results obtained and characterized by means of PSA (particle size analyzer) and TEM (transmission electron microscopy). Figure 2 shows schematically the process of research conducted.
3. Result and Discussion.
3.1. Characterization of Raw Materials
Characterization of raw materials include mineralogical analysis using XRD and chemical composition using XRF. The results of XRD analysis of samples of silica sand and quartzite shown in Figures 3 and 4. While the chemical composition of samples is shown in Table 1.
Figure 3. Difractogram silica sand samples show peaks of quartz (Q)
Figure 4. Difractogram quartzite samples show peaks of quartz (Q)
Table 1. The chemical composition of silica sand and quartzite
Samples SiO2 (%) TiO2 (%) Al2O3 (%) Fe2O3 (%) CaO (%) Na2O (%) MgO (%) K2O (%) LOI (%)
Silica sand 98,75 0,079 0,054 0,389 0,003 0,217 - - 0,25
Quartzite 98,65 0,018 0,262 0,385 0,013 0,303 0,021 - -
Based on the above it appears that difractogram silica sand and quartzite samples are dominated by the initial mineral quartz (SiO2). This is supported by the XRF data showing that silica sand and quartzite obtained a
3.2. Upgrading of SiO2
Prior to the ultra-milling process with a PBM, it is done first with sulfuric acid leaching process to increase the silica content in the samples of silica sand and quartzite. Leaching process carried out with the 20% solid, with a variation of the concentration of acid (sulfuric acid weight ratio of sample weight), which is 1%, 2.5%, 5%, 7.5%, 10% and 15%, leaching performed on room temperature (no heat) for 4 hours. The chemical composition of silica
sand and quartzite after leaching with sulfuric acid shown in Table 2 below. The results obtained at the optimum leaching sulfuric acid concentration of 7.5% for silica sand and quartzite with a 5% to reach levels above 99% SiO2.
Table 2. The chemical composition of silica sand and quartzite after leaching with sulfuric acid
Samples SiO2 (%) Al2O3 (%) Fe2O3 (%) Na2O (%) variation of milling time of 10-60 hours. The results of milling and then characterized by the PSA with the results shown in Table 3 below.
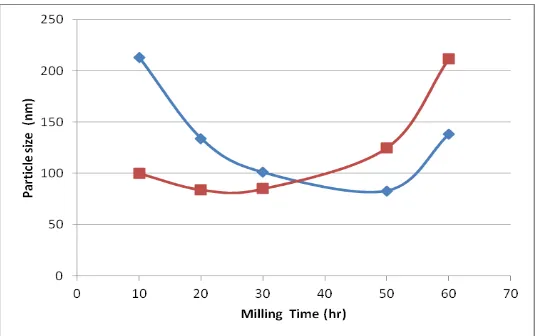
Table 3. The average particle size of silica sand and quartzite at some time milling
Milling Time 10 hours 20 hours 30 hours 50 hours 60 hours
Particle size Silica Sand 100 nm 84 nm 85 nm 125 nm 212 nm
Quartzite 213 nm 134 nm 101 nm 83 nm 138 nm
Both minerals have successfully reduced the particle size of up to 80 nm sized milling within 20-50 hours. The pattern of the two samples are likely to be similar in terms of the resulting particle size relationships of milling time. Curves appear in Figure 5 the resulting particle size during the milling process.
Figure 5. Curve of the sample particle size silica sand and quartzite at some time milling
Based on the milling pattern that occurs can be concluded that the mineral is brittle is characterized by
Figure 6. Milling curve patterns in ductile materials [9]
This phenomenon is different from the type ductile material, where the process of milling the particle size increased first and then decreases (Figure 6). This happens because the ductile material, usually metal, having flattening / plastic deformation when subjected to collision beforehand, so that at the beginning of milling material seems to grow the "width". The metal particles are kept flattened and crushed each other to certain conditions and decreased stability breaks down into particles small partkel (Suryanarayana, 2001). Unlike the brittle material is immediately broken (shrinking) when subjected to the collision. Figure 7 shows the mechanism of particle collisions in the ball mill equipment and products impact on non-metal materials and metals.
Figure 7. Initial collision products in the metal material and non-metals [9]
Figure 8. TEM photographs of nano silica products from silica sand by milling process
3.4. Development for The Next Research (Silica Nanoparticles Applications)
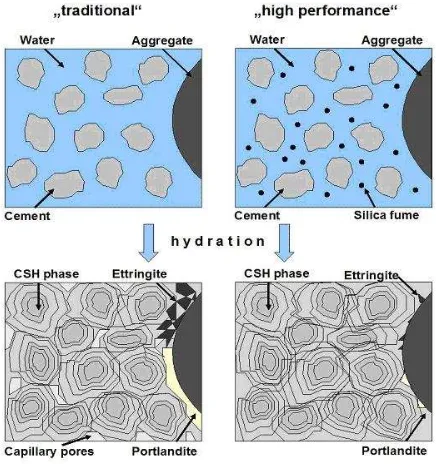
Silica nanoparticles generated in this study could potentially be developed as an additive to concrete to UHPC (ultra high performace concrete) for material applications [10]. Concrete UHPC can anticipate the dangers that can be caused by the presence of small cavities (voids) that has occurred in the cement-aggregate mixture (Figure 9).
These cavities can be the entrance of water or other aggressive materials into the concrete and reinforcing steel structure can be attacked in it which can lead to corrosion.
Figure 9. Different mixtures of concrete: with and without nano silica [10]
To overcome these cavities is necessary to add material that is amazingly smooth so that the concrete can become more dense and compact. Researchers in Germany using silica nanoparticles to fill the empty space
4. Conclusion and Suggestion
1. SiO2 content in the samples of silica sand from Bangka and the Riau origin quartzite rocks quite high,
around 98%
2. By leaching with sulfuric acid method, levels of SiO2 in silica sand and quartzite can be increased up to
99.7%.
3. Synthesis of silica nanoparticles from silica sand and quartzite by milling method (top-down) produces nano silica with average particle size of 80 nm.
4. Need further research in applying the resulting silica nanoparticles as additives for making concrete UHPC (ultra high performace concrete).
References
[1] Sudrajat, Adjat, Supriatna Suhala dan M. Arifin, 1997. Pasir Kuarsa (Bahan Galian Industri), Pusat Penelitian dan Pengembangan Mineral. 260-279p.
[2] Bimantoro, D.A., 2008, Pemanfaatan Nanosilika sebagai Beton Kuat Tekan Tinggi, Skripsi: Institut Teknologi Sepuluh Nopember Surabaya
[3] Quercia, G. and H.J.H. Brouwers, 2010, Application of Nano-Silica in Concrete Mixtures, Proceeding of 8th fib PhD Symposium in Kgs. Lyngby, Denmark.
[4] Chen, Ying, 2008, Natural Rubber Nanocomposite Reinforced with Nano-Silica, J. Polymer Engineering and Science, p. 1674-1677.
[5] Zhou, Hong Jun, et.al., 2007, Role of Reactive Compatibilization in Preparation of Nano-Silica/Polypropylene Composites,
J. Polymer Engineering and Scince, Vol. 47 (4), p. 499-509.
[6] Anonymous, Sekilo Silika Setara Satu Truk Pasir, published in www.radarbanjarmasin.co.id, accessed on 5th November 2011
[7] Dutta, J., H. Hofmann, 2005. Nanomaterials, E-book, 37-39
[8] Departemen ESDM, 2009, Sumber Daya Geologi Indonesia, Buku 2: Pulau Sumatera. [9] Suryanarayana, C., 2001. Mechanical Alloying and Milling. Progeress in Material Science.
[10] Anonymous, Traditional vs High Performance Concrete, www.observatorynano.eu, accessed on 5th November 2011 [11] Buitelaar, Peter, 2004, Ultra High Performance Concrete: Developments and Applications during 25 years, Proceeding of
![Figure 1. Price comparisons of natural silica, pure silica and nano silica [6]](https://thumb-ap.123doks.com/thumbv2/123dok/1138380.655608/2.595.237.420.465.748/figure-price-comparisons-natural-silica-pure-silica-silica.webp)

![Figure 6. Milling curve patterns in ductile materials [9]](https://thumb-ap.123doks.com/thumbv2/123dok/1138380.655608/5.595.163.454.448.655/figure-milling-curve-patterns-ductile-materials.webp)